International Journal of Intelligence Science
Vol.2 No.4A(2012), Article ID:24184,6 pages DOI:10.4236/ijis.2012.224019
Gender Prediction on Twitter Using Stream Algorithms with N-Gram Character Features
Department of Computer Science, Houghton College, Houghton, USA
Email: wei.hu@houghton.edu
Received July 26, 2012; revised August 30, 2012; accepted September 10, 2012
Keywords: Twitter; Gender Identification; Stream Mining; N-Gram; Feature Selection; Text Mining
ABSTRACT
The rapid growth of social networks has produced an unprecedented amount of user-generated data, which provides an excellent opportunity for text mining. Authorship analysis, an important part of text mining, attempts to learn about the author of the text through subtle variations in the writing styles that occur between gender, age and social groups. Such information has a variety of applications including advertising and law enforcement. One of the most accessible sources of user-generated data is Twitter, which makes the majority of its user data freely available through its data access API. In this study we seek to identify the gender of users on Twitter using Perceptron and Naïve Bayes with selected 1 through 5-gram features from tweet text. Stream applications of these algorithms were employed for gender prediction to handle the speed and volume of tweet traffic. Because informal text, such as tweets, cannot be easily evaluated using traditional dictionary methods, n-gram features were implemented in this study to represent streaming tweets. The large number of 1 through 5-grams requires that only a subset of them be used in gender classification, for this reason informative n-gram features were chosen using multiple selection algorithms. In the best case the Naïve Bayes and Perceptron algorithms produced accuracy, balanced accuracy, and F-measure above 99%.
1. Introduction
Social networking is one of the fastest growing industries on the web today [1]. Structured to accommodate personal communication across large networks of friends, social networks produce an enormous amount of usergenerated data. The open availability of this data on public networks, particularly Twitter, provides a good opportunity to research the unique characteristics of informal language. As such, Twitter has become the subject of many studies seeking to obtain useful information from user-generated tweets. Some of the topics for this research include the determination of gender, age, and geographical location of Twitter users. Any information that can be gleaned from authorship may have applications across a variety of fields; for instance, gender and age identification have applications in marketing, advertising, and legal investigation [2]. Collecting such information from Twitter does, however, have unique challenges.
Unlike traditional authorship analysis problems which are based on samples hundreds of words in length [3], the analysis of Twitter is hindered by the 140 character limit on tweets. Other difficulties include both accidental and purposeful misspellings, and internet slang. However, certain distinctive traits, which have emerged as a result of the limitations of Twitter and informality of social networks, provide the possibility for accurate analysis. Of particular interest among these characteristics is the proliferation of informal acronyms, emoticons, and purposeful misspellings. Acronyms such as, “lol”, “rofl”, and “omg” and emoticons like “=P”, “<3”, and “:” (“express a clear meaning in only a few characters [4]. Purposeful misspellings such as “heyy” and “pwned” are commonly used by a particular group of authors and therefore may be indicators of authorship. Although the informal language on Twitter presents multiple challenges to traditional text mining, many of the distinctive traits of informal text may provide useful information for authorship analysis.
Gender prediction through text in the past has primarily used either sentence structure and punctuation or word counts, parts of speech, and other dictionary based methods [5]. However, in an environment like Twitter, where meanings are greatly condensed and the use of acronyms, emoticons, and misspellings is ubiquitous, it is nearly impossible to prepare a dictionary of distinguishing features. For this reason our study utilizes characterbased n-grams and the selection of the most prominent grams, not only to predict gender accurately, but also to identify the most representative features.
Another difficulty with Twitter is the rate at which tweets are generated. Stream algorithms are designed to handle enormous amounts of continuous data that evolves over time, and are required to make only one pass over the data. Because of their streaming nature, these algorithms are able to update themselves and follow trends in the data. The single pass, however, can result in decreased performance of the algorithms, because data may not be stored or revisited. Our study proposes the use of the Perceptron and Naïve Bayes stream algorithms for gender prediction on Twitter, with feature selected ngrams to represent streaming tweets.
2. Data and Their Representation
2.1. Data Collection and N-Gram Feature Extraction
Using the Twitter Streaming API, a set of 36,238 unlabeled tweets was downloaded. These tweets were then manually labeled as male or female instances, a time consuming task hindered by Twitter’s hourly restrictions on requests. While labeling, we kept one tweet from each user and removed any instances where either the gender was unclear or the user did not write in English. By doing this, our data set was reduced to roughly 3000 users with about 60% females, a ratio representative of Twitter users [6]. To train and test the classifiers, the data was split into two equal sets, training and testing. The training set was used to extract and select usable features from tweets. Representations of the testing set were generated using these features to measure the performance of our gender identification methods.
To represent the tweet text, we employed n-grams, collections of n consecutive characters, from a standard US keyboard. Only these characters were used in order to reduce the number of 1-grams from the complete set of 256 ASCII characters to the 95 most used. Each count of a particular n-gram was used as a feature. Because higher orders of n-grams reveal the correlation of different characters within a text, 1-grams through 5-grams were used to represent each tweet. The only downside to using higher orders of n-grams is that as n increases, the number of features also increases exponentially. In other words, if 95 1-grams were extracted, then 952 = 9025 2-grams would be needed, and so on. If we were to use every possible 1 through 5-gram for the 95 characters, we would have to store 7,820,126,495 features for each instance.
Only the n-grams of the tweets observed in the training set were extracted, which further reduced the feature count from 7,820,126,495 to 109,228. At the same time, we also removed any tweets that were deemed too short. Because the length of tweets can vary substantially, tweets were divided by their minimum length creating a set for each minimum length of 25, 30, 40, 50, 60, and 75. It should also be noted that the sets of shorter tweet length contain the sets of longer length.
2.2. Feature Selection
After the tweets had been sorted by their minimum length, six feature selection algorithms were run on the training set using Weka [7], as a means to reduce feature space and noise in the represented data. The algorithms used were Chi-Square, Information Gain, Information Gain Ratio, Relief, Symmetrical Uncertainty, and Filtered Attribute Evaluation. All of these use the Ranker filter to order the features. Chi-Squared uses the chisquared statistic to evaluate individual attributes probability with respect to each class. Information Gain is synonymous with Kullback-Leibler divergence and utilizes a decision tree to calculate the entropy within a set of values. Information Gain Ratio is a slight variation of Information Gain, which divides Information Gain by intrinsic value. The Relief algorithm samples random instances and compares them with neighboring instances of each possible class. Symmetrical Uncertainty measures the correlation between two attributes to determine which attributes have little inter-correlation. The diverse collection of algorithms used in feature selection ensured that the features selected from the training set would not be biased by any particular technique.
Each of these algorithms was run on all six sets of tweets with different minimum lengths, in order to determine the feature rankings from each algorithm for each set. The selections of the six algorithms were then compared, requiring a feature to receive votes from at least four of the six algorithms to be included. To do this, top features were read in order; any of these features which were contained in at least four of the rankings were then added to our selected features. The process continued until a user-specified number of features was reached; this number was determined for each minimum length. If more than 3% of the instances of our testing set were not represented by any of the selected features, the number of features selected was increased. We call these unrepresented instances zero-instances, since these instances have only zeros in their representation. Eventually a feature set was created for each of the six minimum tweet lengths (Table 1), we refer to this collection as Feature Set A. In addition to these feature sets, a set of 15,000 features, Feature Set B, was selected for each length in order to analyze the effect of tweet length on classification accuracy. Counts of these features were recorded for each instance in the testing set as a vector to be used by our gender classification algorithms, producing a total of 12 representations, one for each minimum tweet length in both feature sets. Some of the most prominent and recognizable features selected are displayed in Table 2. These

Table 1. Number of features for each minimum tweet length in feature set A.
features include both emoticons and purposeful misspellings with “:)”, “ ”, and “hey”, which appeared several times and were used primarily by female authors. The majority of the features in the table are female, because a large number of the most informative male features were profane.
3. Methods
In this study we employ both the Perceptron and Naïve Bayes stream classification algorithms. Perceptron is a simple neural network that uses a hard limit function to make predictions about an instance, while Naïve Bayes uses a probabilistic model for classification. Although these algorithms are generally considered classical classification algorithms, they are inherently stream oriented, as they only make one pass over the data and store their models as compact representations.
3.1. Perceptron
Perceptron is an artificial neural network that is designed for classification [8]. Due to its simple structure, Perceptron is able to quickly classify any real-valued instance x with true class t. At the core of this algorithm is the function:
 (1)
(1)
where w is the weight matrix, b is the bias and  is the hard limit function.
The  function forces c to be either 1 or 0 which serves as the predicted class of the instance x. Once the prediction is made, the algorithm calculates the error value
 ; a value of zero means a correct prediction was made while a non-zero means the opposite. The weight matrix is then updated using the formula:
 (2)
(2)
And the bias is updated using the equation:
 (3)
(3)
Because Perceptron uses a linear function to differentiate the two classes, it has trouble dealing with nonlinearly separable data. In this study, we used the implementation of Perceptron within the MOA framework [9].
3.2. Naïve Bayes
The Naïve Bayes classifier uses a probabilistic model according to Bayes’ theorem [10], which requires the multiplication of the probabilities of each feature, based on the assumption that all features are independent of one another. The Naïve Bayes algorithm calculates a probability from the occurrence of each feature, with regards to the true class of the instance. For each new instance, the probability of this instance belonging to each class is calculated using the formula:
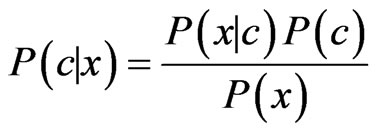 (4)
(4)
where c is the predicted class and x is the instance. The class with the highest probability is considered to be the predicted class of the instance. Like Perceptron, we used the MOA implementation of the Naïve Bayes classifier [9].
4. Results
In this section, we report the gender classification ability of each stream algorithm. The performance of these systems is measured by a variety of metrics including accuracy, balanced accuracy, and F-Measure. Accuracy is the percentage of instances predicted correctly, while balanced accuracy is the average of the accuracies for each class. F-Measure is used in several previous studies in gender identification as an overall assessment of performance because takes into account both precision and recall. When measured by these metrics, each algorithm demonstrates its own gender prediction capability. Once the important features were selected from the training data set, both the Perceptron and the Naïve Bayes algorithms were run on the testing set, represented by the selected features, to gauge their gender discriminatory power (Figures 1-4).
4.1. Gender Identification Using Feature Set A
Using Feature Set A, both the Perceptron and Naïve Bayes classifiers were run to measure the effectiveness of these selected features. All metrics demonstrating the gender identifying power of both algorithms are above 75%, so we only display the range 75% - 100% in Figures 1-4. Perceptron (Figure 1) demonstrated a high precision between 90% and 95% but a low recall (75% - 85% for most minimum lengths). On the other hand, Naïve Bayes (Figure 2) had a slightly lower precision, but was able to have higher F-Measure and recall rates (above 90%). Because the number of features varied significantly as the minimum length of tweets changed, the performances
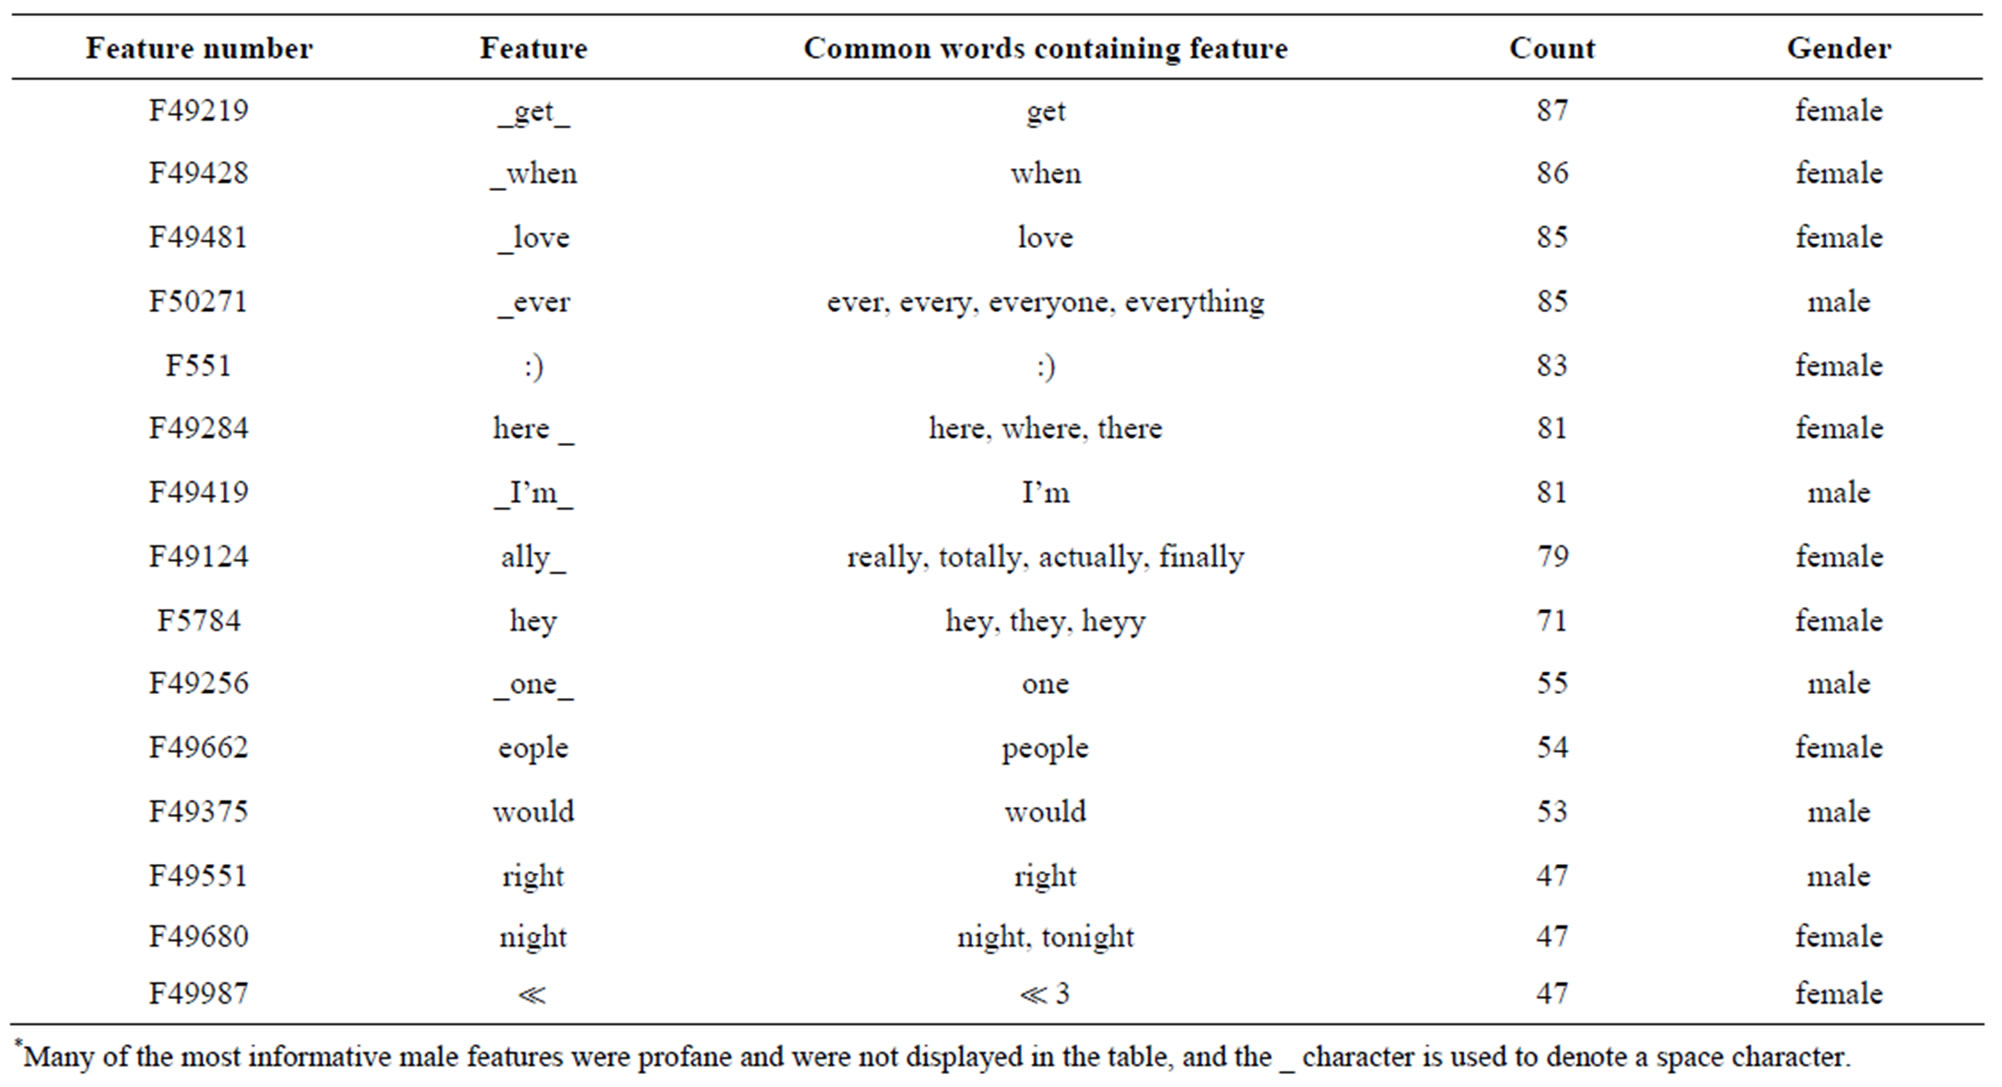
Table 2. Prominent gender specific features*.

Figure 1. Gender identification performance metrics of Perceptron using feature set A.
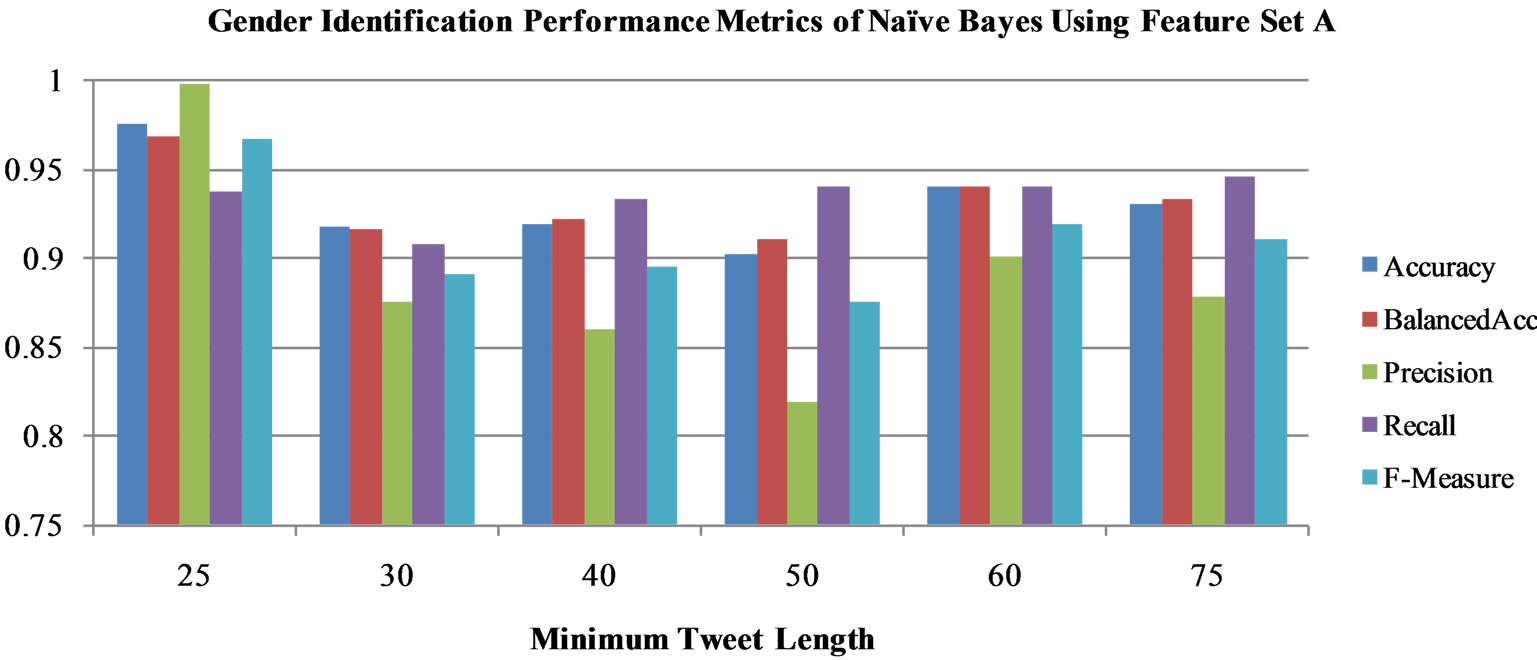
Figure 2. Gender identification performance metrics of Naïve Bayes using feature set A.
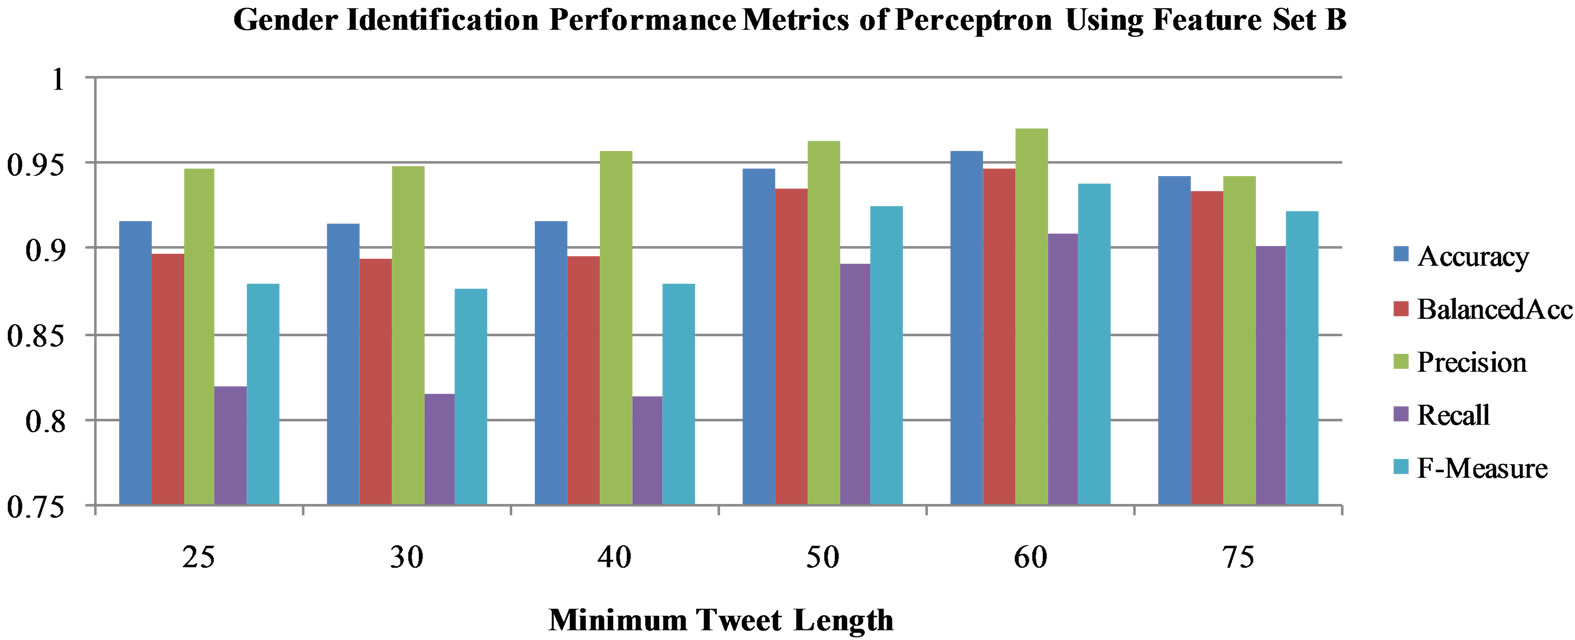
Figure 3. Gender identification performance metrics of Perceptron using feature set B.
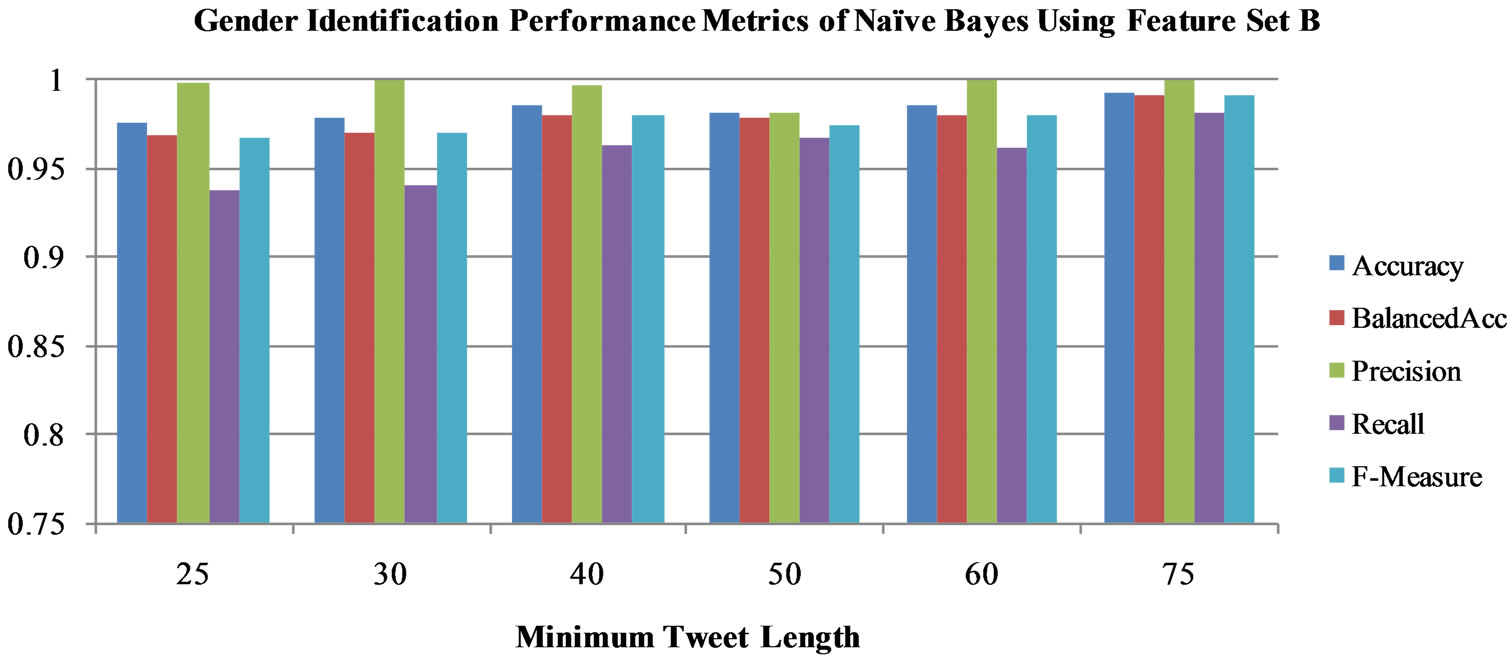
Figure 4. Gender identification performance metrics of Naïve Bayes using feature set B.
fluctuated and may not be compared. Of particular interest is the performance of Perceptron using the minimum tweet length of 75. Here, all five of the performance metrics are within 5% of one another, and are above 90%. The Naïve Bayes algorithm demonstrates a similar trend when run on the minimum tweet length of 25.
4.2. Gender Identification Using Feature Set B
In order to find an overall comparison between the two algorithms, we then ran the classifiers on the testing data sets represented by 15,000 features (Feature Set B). With Feature Set A, Perceptron improved its classification, but still did not do as well as Naïve Bayes. Perceptron was unable to achieve a high recall value (Figure 3). This algorithm had its highest accuracy and balanced accuracy when it was run on the testing data set with a minimum length of 60 characters. In contrast, Naïve Bayes (Figure 4) using Feature Set B was able to improve on every metric. In particular, the precision metric of Naïve Bayes increased from 80% - 90% using Feature Set A to 95% - 100% using Feature Set B, which caused its F-Measure to increase substantially. This algorithm performed best with a minimum tweet length of 75 characters. The results of Naïve Bayes using Feature Set B are displayed in Table 3.
The Naïve Bayes classifier performs much better than Perceptron in most metrics, which suggests that probabilistic modeling is well suited to the task of gender identification on Twitter (Figures 1-4). It is also interesting that the algorithms classify better using Feature Set B rather than Feature Set A. This implies that by using a larger number of features, each tweet is able to have a better representation. Although processing the increased number of features in Feature Set B requires more memory and time, the use of 15,000 features does not pose a significant problem because of the speed of our algorithms, and the two algorithms using these features show significant improvement in all metrics. Both the Perceptron and Naïve Bayes algorithms using Feature Set B, perform well for author gender identification, warranting further study with more complex stream algorithms.
5. Conclusions
The rapid growth of social networks, particularly Twitterhas produced an unprecedented amount of user generated text which may be used for authorship analysis, including

Table 3. Tabulated gender identification results of Naïve Bayes using feature set B.
gender prediction. Because of the anonymity on the Internet, many times the text is the only data source for gender identification. Data collected from social networking sites like Twitter is often restricted by text length causing further difficulties for gender classification. Also, information generated at high speeds cannot be processed well by traditional batch mining techniques and thus stream mining algorithms must be used instead.
In this study, we attempt to identify user genders on Twitter by representing each tweet as a vector based on 1 through 5-gram features. To better represent acronyms, emoticons, and misspellings frequently used on Twitter; n-grams are employed instead of traditional dictionaries. Although higher orders of n-grams provide more insight into the text of the tweets, they also require exponentially more features to be used. To extract the informative features and improve the classification and runtime of our gender prediction algorithms, six feature selection algorithms were employed. To evaluate the effectiveness of these selected features for gender identification on Twitter, we used two simple stream mining algorithms: Perceptron and Naïve Bayes. Perceptron preformed relatively well with very high precision (97%), and a balanced accuracy of 94%, which was outperformed by Na- ïve Bayes scoring between 90% and 100% for all metrics. The performance of the Perceptron and the Naïve Bayes stream algorithms on gender identification of Twitter users demonstrate the value of the n-gram feature representations as well as the feature selection techniques.
6. Acknowledgements
We would like to thank the Summer Research Institute at Houghton College for providing financial support for this study.
REFERENCES
- “Social Networking Sites in the US: Marketing Report,” 2009. http://www.ibisworld.com/industry/social-networking-sites.html
- J. D. Burger, J. Henderson, G. Kim and G. Zarella, “Discriminating Gender on Twitter,” Proceedings of EMNLP, 2011, pp. 1301-1309.
- H. Craig, “Authorial Attribution and Computational Stylistics: If You Can Tell Authors Apart, Have You Learned Anything about Them?” Literary and Linguistic Computing, Vol. 14, No. 1, 1999, pp. 103-113. doi:10.1093/llc/14.1.103
- J. Walther and K. P. D’Addario, “The Impacts of Emoticons on Message Interpretation in Computer-MediatedCommunication,” Social Science Computer Review, Vol. 19, No. 3, 2001, pp. 324-347.
- M. W. Corney, “Analyzing E-Mail Text Authorship for Forensic Purposes,” Master’s Thesis, Queensland University of Technology, Queensland, 2003.
- “Study: Males vs. Females in Social Networks,” 2009. http://royal.pingdom.com/2009/11/27/study-males-vs-femalesin-social-networks/
- I. H. Witten and E. Frank, “Data Mining: Practical Machine Learning Tools and Techniques,” 2nd Edition, Morgan Kaufmann, San Francisco, 2005.
- F. Rosenblatt, “The Perceptron: A Probabilistic Model for Information Storage and Organization in the Brain,” Psychological Review, Vol. 65, No. 6, 1958, pp. 368-408.
- A. Bifet, G. Holmes, R. Kirkby and B. Pfahringer, “MOA: Massive Online Analysis,” Journal of Machine Learning and Research, Vol. 11, 2010, pp. 1601-1604.
- M. E. Maron and J. L. Kuhns, “On Relevance, Probabilistic Indexing, and Information Retrieval,” Journal of the Association for Computing Machinery, Vol. 7, No. 3, 1960, pp. 216-244. doi:10.1145/321033.321035

