Open Journal of Soil Science
Vol.4 No.3(2014), Article ID:43756,6 pages DOI:10.4236/ojss.2014.43014
Evaluation of Available Phosphorus by Soil Test Methods in an Acidic Soil Incubated with Different Levels of Lime and Phosphorus
Ashoka Sarker, Md. Abul Kashem*, Khan Towhid Osman, Imam Hossain, Farzana Ahmed
Department of Soil Science, University of Chittagong, Chittagong, Bangladesh
Email:*kashem00@yahoo.com
Copyright © 2014 by authors and Scientific Research Publishing Inc.
This work is licensed under the Creative Commons Attribution International License (CC BY).
http://creativecommons.org/licenses/by/4.0/


Received 21 January 2014; revised 21 February 2014; accepted 28 February 2014
ABSTRACT
An incubation study was conducted in laboratory to determine the effect of lime (L) as CaCO3 and phosphorus (P) as TSP on soil pH and available soil P in an acid soil. Four rates of L equivalent to 0, 1, 2 and 3 ton CaCO3 ha−1 and four rates of P equivalent to 0, 25, 50 and 75 mg P kg−1 were applied in combinations as treatments. The soil was incubated at field capacity for 8 weeks (wk) after which they were extracted using NaHCO3 (Olsen), Mehlich-3, Kelowna and Bray & Kurtz-1 extractants and soil pH was determined. Lime significantly (P < 0.001) increased soil pH. Phosphorus decreased it, though not significantly. Both L and P had significant effects (P < 0.001) on P availability irrespective of extractants used. Two ton CaCO3 plus 75 mg P kg−1 gave the highest available phosphorus. Mehlich-3 method extracted the largest amount of P (14.54 - 67.35 mg∙kg−1) while Olsen extracted the smallest amount (3.25 - 32.77 mg∙kg−1). The mean extractable P in soils was found to be in the order of Olsen < Kelowna < Bray & Kurtz-1 < Mehlich-3. Although the four methods extracted different amounts of P from soil, values of P extracted by the different methods were strongly correlated among themselves (R2 = 0.87 to 0.95).
Keywords:Available P; Extraction Methods; Lime; Phosphorus; Incubation

1. Introduction
A large number of methods to evaluate available phosphorus (P) indicate the complexity of this nutrient in the soil, mainly due to strong interaction with soil colloids and other elements present in soil solution [1] . Several soil test phosphorus (STP) methods are used to estimate available soil P. The higher level of STP, the higher is the risk of P exports from the soil. STP methods can be divided into two broad categories: agronomic P tests and environmental P tests. Agronomic tests such as Olsen, Kelowna and Mehlich-3 have been developed to estimate the amount of P that will be available to a plant throughout the growing season [2] -[4] . However environmental soil P tests extract a portion of soil P that is easily lost through surface runoff or subsurface flow and therefore use mild extractrants, for example, distilled water [5] . Several studies have shown that agronomic soil P tests are often correlated with soil P measured by environmental P tests as well as P in the runoff and drainage waters [6] [7] .
A large proportion of soil resource found in the humid tropics is acidic and deficient in phosphorus (P). The occurrence of high levels of aluminium (Al) and iron (Fe) in soil usually give rise to low pH and P release. Wherever Fe and Al imbalances exist, a corresponding P stress occurs [8] . One of the primary reasons commonly proposed for liming acid soils is to increase phosphate availability to plants [9] . However, conflicting views are held as to the effects of liming on the phosphate-supplying power of highly weathered acid soils. Liming has been reported to increase, decrease, or not affect [10] the P that can be extracted from soils. Similarly, the phosphorus (P) content of plants has been observed to increase, decrease or remain unchanged following liming [11] -[13] .
In view of the importance of soil acidity in world agriculture, and the inevitable increases in the price of fertilizer phosphate, a full understanding of phosphate availability in acid soils is essential. The objectives of the present incubation study were:
1) To investigate possible interaction of lime and TSP fertilizer in the P availability extracted by Olsen, Kelowna, Mehlich-3 and Bray & Kurtz-1 methods in a P deficient acidic soil; and 2) To determine the relationship among the soil test P extraction methods.
2. Materials and Methods
2.1. Experimental Soil
A laboratory incubation study was conducted using a sandy loam surface soil (0 - 15 cm) collected from a crop producing field of the Department of Soil Science, University of Chittagong, Bangladesh. Soil sample was air dried and crushed to pass through 2-mm sieve for using it in the study. Analysis of the soil, prior to incubation, revealed its characteristics to be: soil pH was of 5.18 (1:2.5 s:w), organic carbon [14] was 0.98% (organic matter 1.69%), CEC (extraction with 1 N NH4OAc) [15] was of 4.18 cmol∙kg−1. The soil contained 69% sand, 16% silt and 16% clay measured by hydrometer method [16] .
Phosphorus in the soil was measured by ascorbic acid blue color method [17] and the absorbance was measured by spectrophotometer at wave length of 882 nm. Total P concentration in the experimental soil was 500 mg∙kg−1. Extractable P of the soil was determined by the same procedure as mentioned above after extraction with different extractants (Table 1). The available P of the soil sample extracted by 0.5 M NaHCO3 (Olsen), Mehlich-3, Kelowna and Bray and Kurtz-1 were 3.60, 14.90, 8.70 and 12.80 mg∙kg−1, respectively.
2.2. Incubation Experiment
Combinations of four levels of L equivalent to 0 (L0), 1 (L1), 2 (L2) and 3 (L3) ton CaCO3 ha−1 and four levels of P equivalent to 0 (P0), 25 (P1), 50 (P2) and 75 (P3) mg P∙kg−1 constituted the treatments. The experiment was a 4 × 4 factorial with 3 replicates in a completely randomized block design. A 50 g of soil sample with different treatments was placed in a 250 ml plastic jar with perforated lid to allow gas exchange. The soil was incubated at field capacity for 8 weeks at room temperature. At the end of incubation, soil samples collected from each jar were air-dried, ground and passed through a 2 mm sieve to measure soil pH and available P by different extractants such as Olsen, Mehlich-3, Kelowna, and Bray and Kurtz-1 (Table 1).
2.3. Statistical Analyses
Data from each extractant was analyzed independently. Minitab statistical software, Released 11 [19] was used for analysis of variance and correlation. Significant means were separated using Tukey’s Multiple Range Test (TMRT).

Table 1. Different methods used for extracting P from soil.
3. Results and Discussion
3.1. Effect of Lime and Phosphorus on Soil pH
Table 2 shows the effect of treatments on soil pH. Lime had a significant effect (P < 0.001) on soil pH with the highest rate of 3 ton CaCO3 ha−1 giving the highest rise from pH 5.2 to 6.6. Two ton CaCO3 ha−1 gave optimum soil pH range (6.2 - 6.3) for availability of P in soil (Table 2). Addition of P did not appear to have any remarkable effect on the neutralizing effect of lime [20] .
3.2. Effect of Lime and Phosphorus on Soil Available P
Significant variations (P < 0.001) in available P were observed due to application of L, P and their combinations at various levels (Figure 1). The amount of available P extracted with 0.5 M NaHCO3 (Olsen), Mehlich-3, Kelowna and Bray & Kurtz-1 methods ranged from 3.25 to 32.77 mg∙kg−1, 14.54 to 67.35 mg∙kg−1, 8.62 to 42.48 mg∙kg−1 and 12.57 to 54.38 mg∙kg−1, respectively (Figure 1). The results obtained after 8 weeks incubation, as extracted by NaHCO3 (Olsen-P) are used to illustrate the treatment effect of soil test P. The trend in the data obtained with other three extractants was similar to that of the NaHCO3-extractable P (Olsen-P) (Figure 1).
The different lime levels influenced the available phosphorus in the soil at four soil test P extraction methods. The highest available phosphorus in the soil was noticed with the application of lime at L2 level (2 ton CaCO3 ha−1) at all the extraction methods (Figure 1). The Ca2+ and Mg2+ in lime displace Al3+, Fe2+ and H+ ions from the soil sorption sites. This results into reduction in soil acidity and P fixation [21] .
The application of different levels of P affected the availability of P in the soil. The application of P at P3 level (75 mg P Kg−1) recorded maximum available P in the soil compared to other levels of P. Phosphorus increased with P rates applied singly but not as much as in combination with L (Figure 1). Lower P availability following P application alone is due to its fixation by Al and Fe ions in acid soils [22] .
Although L and P increased available P, this effect was boosted by combining L with P applied. Among the combinations of L and P level, the lime at L2 level and P at P3 level (2 ton CaCO3 ha−1 and 75 mg P Kg−1) recorded higher available P in the soil regardless of soil test P extraction methods. Varying rates of P combined with L at L2 level (2 ton CaCO3 ha−1) gave better values of available soil P than P combined with L at L3 level (3 ton CaCO3 ha−1) (Figure 1). It is obvious that available P was sharply reduced by application of 3 ton CaCO3 ha−1. At high soil pH, the precipitation of insoluble calcium phosphates can decrease phosphate availability. This suggests that the soil has been over limed at this high application rate [20] .
3.3. Comparison of the Phosphorus Extractability in Soil
A paired t-test was performed to compare the mean differences of P removed by different extractants. Tukey’s test for multiple means comparison showed that the means of Olsen, Mehlich-3, Kelowna and Bray & Kurtz-1 extractable P were significantly different (P < 0.05; Figure 2). The average value of extractable P with Olsen was of 13.54 mg∙kg−1, with Mehlich-3 was of 35.40 mg∙kg−1, with Kelowna was of 21.60 mg∙kg−1 and with Bray & Kurtz was of 28.89 mg∙kg−1. The amounts of P extracted from incubated soils increased in the order: NaHCO3 < Kelowna < Bray & Kurtz-1 < Mehlich-3 (Figure 2 ). Taking the Olsen test as the reference method, this sequence can be expressed by calculating the ratio between the mean values of the P extracted by each procedure and that extracted by the Olsen test multiplied by 100: 100 < 160 < 213 < 261. The differences among the P extraction methods probably arose from the fact that plant available P in the soil is not from a discreet fraction but from a continuum of fractions: extracting agents preferentially extract from different fractions depending on their reactions with soil components involved in P sorption [23] . Furthermore, each extracting solution has a
Table 2 . Effects of lime and P on soil pH after 8 weeks of incubation.
Means followed by the same letter in column or row were not significantly different at P < 0.05.
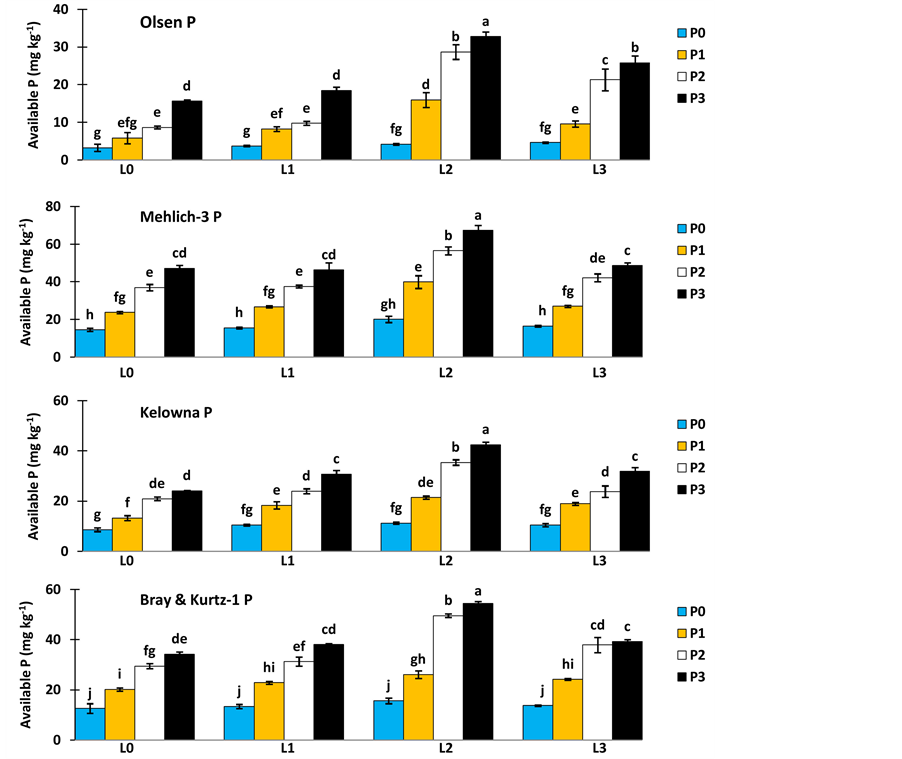
Figure 1. Effect of L and P treatments on the amount of available soil P extracted with Olsen, Mehlich-3, Kelowna and Bray & Kurtz-1. Means indicated with the same letter were not significantly different (P < 0.05).
different ability to extract varying portions of soil P because they were targeted at different pools of soil P [24] . The mean of Olsen P is significantly small than the means of other three extractants. This is an indication that other extracting agents extracted some forms of labile P that are not immediately available to 0.5 M NaHCO3 extractant. Though, NaHCO3 is used for calcareous soil, however, it has been commonly used as a soil P extractant in acid and neutral soils [2] .
Extractable P by the Olsen, Mehlich-3, Kelowna and Bray & Kurtz-1 in this study were correlated among themselves. Linear regression models were fitted to the data as given in Table 3. The coefficient of determination (R2) varied from 0.87 to 0.95 indicating that any of these extractants can be used to estimate P extractability
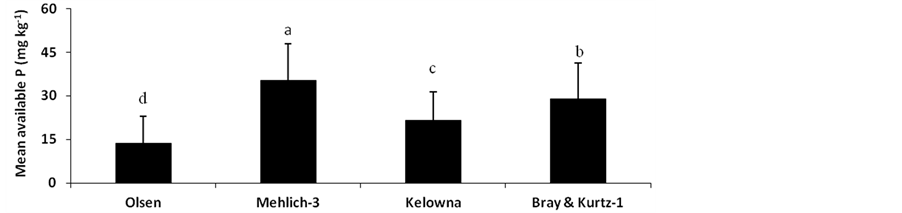
Figure 2. Mean of P extracted by the different extractable methods. Means indicated with the same letter were not significantly different (P < 0.05).
Table 3. Regression equation and coefficients of determination (R2) for relationships among soil test methods (all values are significant at P < 0.001).
(available P) in soils. The highest coefficient of determination resulted for the relationship between Kelowna P and Bray & Kurtz-1 P (R2 = 0.951) (Table 3). The determination of conversion equations is especially important when studying new soil tests, as it allows the use of relations between soil nutrient contents and crop response evaluated by the usual methods. In addition, knowledge of the parameters of the regression conversion equations permits the comparison of P data, which are obtained using the different extractants [25] .
4. Conclusion
Lime application rate at 2 ton ha−1 gave favourable soil pH values that permitted the highest release of available P regardless of extraction methods. This indicates that liming at 2 ton∙ha−1 is required to ameliorate the acid condition of the experimental soil and over liming should be avoided as it could precipitate P deficiency again. The high correlation coefficient of determination between the various extractants, shows that all of them will provide a good index of P labiality in this soil.
References
- Silva, F.C. and van Raij, B. (1999) Phosphorus Availability Assessed by Different Extractants. Pesquisa Agropecuária Brasileira, 34, 267-288. http://dx.doi.org/10.1590/S0100-204X1999000200016
- Olsen, S.R., Cole, C.V. and Watanabe, F.S. (1954) Estimation of Available Phosphorus in Soils by Extraction with Sodium Bicarbonate. USDA Circular No. 939, US Government Printing Office, Washington DC.
- Mehlich, A. (1984) Mehlich 3 Soil Test Extractants: A Modification of Mehlich 2 Extractant. Communications in Soil Science and Plant Analysis, 15, 1409-1415. http://dx.doi.org/10.1080/00103628409367568
- Van Lierop, W. (1988) Determination of Available Phosphorus in Acid and Calcareous Soils with Kelowna MultipleElement Extractant. Soil Science, 146, 284-291. http://dx.doi.org/10.1097/00010694-198810000-00009
- Van der Paaw, F. (1971) An Effective Water Extraction Method for the Determination of Plant Available Phosphorus. Plant and Soil, 34, 467-481. http://dx.doi.org/10.1007/BF01372799
- Sims, J.T. (2000) Soil Test Phosphorus: Olsen P. In: Pierzynski, G.M., Ed., Methods for Phosphorus Analysis for Soils, Sediments, Residuals and Water, Kansas State University, Manhttan, 20-21.
- McDowell, R.W. and Sharpley, A.N. (2001) Phosphorus Losses in Subsurface Flow before and after Manure Application to Intensively Farmed Land. Science of the Total Environment, 278, 113-125.
- Fageria, N.K., Baligar, V.C. and Wright, R.J. (1991) Influence of Phosphate Rock Sources and Rates on Rice and Common Bean Production in an Oxisol. In: Wright, R.J., Baligar, V.C. and Murrmann, R.P., Eds., Plant and Soil Interaction at Low pH, Kluwer Academic Publisher, Norwell, 539-546. http://dx.doi.org/10.1007/978-94-011-3438-5_61
- Sanchez, P.A. and Uehara, G. (1980) Management Considerations for Acid Soils with High Phosphorus Fixation Capacity. In: Khasawneh, F.E., Sample, E.C. and Kamprath, E.J., Eds., The Role of Phosphorus in Agriculture, American Society of Agronomy, Madison, 471-514.
- Sumner, W.E. (1979) Response of Alfalfa and Sorghum to Lime and P on Highly Weathered Soils. Agronomy Journal, 71, 763-766. http://dx.doi.org/10.2134/agronj1979.00021962007100050014x
- Amarasiri, S.L. and Olsen, S.R. (197) Liming as Related to Solubility of P and Plant Growth in an Acid Tropical Soil. Soil Science Society of America Journal, 37, 716-721. http://dx.doi.org/10.2136/sssaj1973.03615995003700050026x
- Janghorbani, M., Roberts, S. and Jackson, T.L. (1975) Relationship of Exchangeable Acidity to Yield and Chemical Composition of Alfalfa. Agronomy Journal, 67, 350-354. http://dx.doi.org/10.2134/agronj1975.00021962006700030017x
- Jones, J.P. and Fox, R.L. (1978) Phosphorus Nutrition of Plants Influenced by Manganese and Aluminium Uptake from an Oxisol. Soil Science, 126, 230-236. http://dx.doi.org/10.1097/00010694-197810000-00005
- Walkley, A. and Black, I.A. (1934) An Examination of Degtjareff Method for Determining Soil Organic Matter and a Proposed Modification of the Chromic Acid Titration Method. Soil Science, 37, 29-38. http://dx.doi.org/10.1097/00010694-193401000-00003
- Soil Survey Laboratory Staff (1992) Soil Survey Laboratory Methods Manual. Soil Survey Laboratory Investigations Report No. 42, USDA-SCS, Washington DC.
- Bouyoucos, G.J. (1962) Hydrometer Method Improved for Making Particle Size Analysis of Soils. Agronomy Journal, 54, 464-465. http://dx.doi.org/10.2134/agronj1962.00021962005400050028x
- Murphy, J. and Riley, J.P. (1962) A Modified Single Solution Methods for the Determination of Available Phosphate in Natural Water. Analytica Chimica Acta, 27, 31-36. http://dx.doi.org/10.1016/S0003-2670(00)88444-5
- Bray, R.H. and Kurtz, L.T. (1945) Determination of Total Organic and Available Forms of Phosphorus in Soils. Soil Science, 59, 39-45. http://dx.doi.org/10.1097/00010694-194501000-00006
- Minitab. Inc. (1996) Minitab User Guide Release 11. Minitab, State College.
- Oluwatoyinbo, F.I., Akande, M.O. and Adediran, J.A. (2005) Response of Okra (Abelmoschus esculentus) to Lime and Phosphorus Fertilization in An Acid Soil. World Journal of Agricultural Sciences, 1, 178-183.
- Kamprath, E.J. (1984) Crop Response to Lime in the Tropics. In: Adams, F., Ed., Soil Acidity and Liming, 2nd Edition, Agronomy Monograph 12, Agronomy and Soil Science Society of America, Madison, 349-368.
- Buresh, R.J., Smithson, P.C. and Hellums, D.T. (1997) Building Soil Phosphorus Capital in Africa. In: Buresh, R.J., Sanchez, P.A. and Calhoun, F., Eds., Replenishing Soil Fertility in Africa, SSSA Special Publication No.51, Madison Wisconsin, 111-149.
- Council for Agricultural Science and Technology (2000) Relevance of Soil Testing to Agriculture and the Environment. CAST, Ames, 1-12.
- Zhang, M., Wright, R., Heaney, D. and Vanderwel, D. (2004) Comparison of Different Phosphorus Extraction and Determination Methods Using Manured Soils. Canadian Journal of Soil Science, 84, 469-475. http://dx.doi.org/10.4141/S02-023
NOTES

*Corresponding author.