Open Journal of Soil Science
Vol.3 No.1(2013), Article ID:28721,7 pages DOI:10.4236/ojss.2013.31004
Background Soil Mercury: An Unrecognized Source of Blood Mercury in Infants?
![]()
1College of Medicine, University of Cincinnati, Cincinnati, USA; 2College of Engineering and Applied Science, University of Cincinnati, Cincinnati, USA.
Email: Pheckel@cdc.gov
Received December 18th, 2012; revised January 9th, 2013; accepted January 31st, 2013
Keywords: Mercury; Blood Mercury; Pharmacokinetics; Air Toxics
ABSTRACT
Introduction: During the past four decades, mercury (Hg) research focused on fish consumption has explained less than 22% of Hg in human blood. One overlooked exposure pathway for infants and young children is the concentration of Hg in soils. Although 75% of the US population lives in urban areas near industrial facilities, minimal data exist regarding the concentration and speciation of Hg in residential soils. Chronic exposure through ingestion of low concentrations of Hg in soils may explain a portion of the blood Hg levels noted in infants. Methods: Three relatively unexposed residential sites in a suburban community were selected. The primary route of contamination was atmospheric deposition. Soils were digested in a nitric acid-hydrofluoric acid solution and analyzed by cold vapor atomic absorption spectrophotometry. Measured concentrations of total Hg in local suburban soil samples were compared to levels measured in a national study of 27 remote and rural sites. The Al-Shahristani pharmacokinetic model, developed after the 1971 Iraqi Methyl Hg poisoning incident, was used to calculate the blood Hg concentration in a hypothetical year-old infant. Results: Soil samples contained Hg concentrations ranging from 0.01 to 0.24 ppmw. The distribution of Hg in the soil samples was non-linear and non-normal. The mean soil Hg concentrations at the three locations were 0.08, 0.05 and 0.08 ppm. Calculated blood Hg concentrations for a 10 kg, year-old infant due to ingestion of soil (200 mg/day) containing 0.2, 0.4 and 0.8 ppm Hg were 0.08, 0.17 and 0.26 μg/L, respectively. Conclusions: The pilot study data appear to support the hypothesis that chronic, low-level soil ingestion may be a significant source of Hg for infants. Further study is warranted.
1. Introduction
Mercury (Hg) is a known potent toxicant and is found in the blood, brain and kidney tissues [1]. Organic methyl mercury (CH3Hg) is associated with fish consumption, whereas inorganic Hg corresponds to exposure from dental amalgams and other sources of Hg vapor [2]. Elemental mercury (Hg0) crosses the placenta and concentrates in the fetus [3]. There have also been several publications that summarized past research into the speciation of Hg and related biomarkers [4-7].
Decades of research indicate that the developing infant brain is highly susceptible to damage from neurotoxincants such as Hg [8]. Research over the past 30 years has confirmed the presence of Hg in fish. Although a statistical analysis indicates a link between fish consumption and Hg concentrations in infant cord blood, the correlation is weak. Nevertheless, the United States Environmental Protection Agency (USEPA) issued fish consumption advisories for pregnant women [1]. Weekly records of dietary intake of fish by women during their pregnancy in Poland explained only 22% of the variability of Hg in umbilical cord blood [9]. A weak dose-response relationship (r2 = 0.21) between fish consumption and infant cord blood Hg was confirmed in another study of pregnancies among women living along the St. Lawrence River who ate an average of 3.5 fish meals/month [10]. Thus, in both studies, fish consumption explained 22% or less of the Hg in cord blood. Hundreds of studies have examined the possible Hg contribution from foods, but none of the exposures correlated above 22% with blood concentrations. Therefore, other routes of exposure need to be considered.
According to the 2000 census, more than 75% of the United States population lives in urban areas [11]. Our pilot study determined the concentration of Hg in topsoil in the suburbs of an industrialized metropolis. We suggest that there may be a link between Hg in soil and Hg in infant blood due to increased hand-to-mouth behaviors during the first two years of life, based in part to a similar relationship observed with lead (Pb) exposure. Previous research established a link between lead in soil and in infant blood due primarily to the hand-to-mouth behaviors associated with infants [12]. However, the relationship between Hg in soils and blood Hg concentrations in children has been mostly ignored. Could Hg in soils contribute to the unexplained portion of Hg in the blood of infants? What is the potential contribution of low concentrations of Hg in soils to infant blood Hg?
Hg emissions are deposited on the surface of the Earth through precipitation and other natural processes [1]. Elemental (Hg0), particulate (Hgp), and reactive gaseous mercury (RGM) have been measured in precipitation by the Mercury Deposition Network, which reports that 99% of ambient Hg is Hg0 [6]. Hgp is generally bound to sulfur or chlorine. RGM has a chemical affinity for sulfuric acid, hydroxyl ions, and chloride ions. Each of these species may be found in soil. Anaerobic bacteria in pond sediments can convert inorganic mercuric compounds into CH3Hg. Hg emitted from industrial and mobile sources is deposited everywhere [13].
The Hg concentration is highest near the soil surface where children play and gardens are planted [14]. Does Hg in soils pose a health risk for our children? A study reported higher levels of lead in house dust during the summer when children played outdoors [15]. A study in Ottawa, Canada compared Hg concentrations in house dust, garden soil, and street dirt and reported levels of 3.6, 0.11 and 0.03 ppmw respectively [16]. How do those levels compare to soils from exposed and unexposed sites? An analysis of lakeshore soils in Voyageurs National Park in Minnesota, where Hg was used to extract gold ore, reported a range of concentrations from below detection limit (0.020 ppmw) at bedrock to a high of 0.448 ppmw in topsoil [17]. In 2003, the USEPA conducted a survey of soils collected from 27 rural/remote areas in North America and found an average background Hg concentration of 0.022 ppm with a range of 0.0005 to 0.07 ppmw [13]. The authors selected three suburban sites considered representative of suburban sites within a metropolitan area to determine Hg concentrations and to compare them against soil Hg concentrations reported [13]. These levels were then used in a widely-accepted pharmacokinetic model to predict blood Hg concentrations in a hypothetical, year-old infant.
2. Methods
2.1. Study Area
Fifteen industrial point sources are located within a 50 mile radius of the study area and collectively emit a ton of Hg each year [18]. When smoke stacks are designed in accordance with good engineering practice, emitted Hgp typically falls within the plant fence lines, while gaseous Hg0 is carried higher into the atmosphere, transported longer distances, and removed by scavenging. Estimates of Hg in precipitation published by the Mercury Deposition Network were developed by a mathematical model based on measurements at two sites located on either side of the state of Ohio. In 2008, precipitation in the Ohio River Valley at Cincinnati, OH contained 10 to 12.1 ng Hg/L, an average for the United States [19].
Our three suburban sites were far enough away from stationary and mobile sources to avoid Hgp fallout [20]. Our sites were located more than two kilometers from the aforementioned industrial facilities and more than 500 m from highways. Site A was located 561 m west of an interstate highway and 1297 m north of a state highway. Site B was in an older neighborhood 1675 m east of an interstate highway and 1855 m south of a state highway. Site C was located 2801 m west of an interstate highway and 4624 m north of a state highway. These three suburban sites were considered to be relatively unexposed.
Further, there were no known amendments or in situ environmental factors that might elevate the levels of soil Hg at our sites. None had been fertilized or reseeded within the past three years. Adjacent driveways and roads had not been resurfaced or sealed within the past three years. Thus, the primary route of exposure was assumed to be atmospheric deposition.
2.2. Sampling and Sample Preparation
Approximately 300 g of topsoil was collected from each site at a depth of 8 cm. Common sample contamination-avoidance procedures were followed throughout [21]. To avoid loss of Hg through evaporation, all the samples were freeze-dried. Samples from a given site were sifted, riffled and divided at room temperature. A typical sifted soil sample passed through a No. 40 sieve with a particle diameter dp < 0.420 mm. Grass, roots and rocks were discarded. Sifted soils were marked and stored in a plastic bag in the freezer [22].
2.3. Soil Mercury Analysis
The total Hg concentration in soil samples was determined by cold vapor atomic absorption spectrophotometry (CVAAS). Soil samples (approximately 1.0 g each) were digested overnight at 90˚C in sealed 100 ml Teflon® perfluoroalkoxy resin polymer pressure vessels with 49% hydrofluoric acid (36 ml/digestion vessel) and aqua regia (36 ml/digestion vessel). Digested 100 ml aliquots were combined in an Erlenmeyer flask containing an 8% boric acid solution. A 5% stannous chloride solution was immediately added prior to CVAAS analysis (Buck Scientific Mercury Analyzer, Model 400A) [22, 23]. The published detection limit for the CVAAS was 0.005 μg.
Additional samples from site A were analyzed on two different Combustion AA Mercury analyzers. These instruments incorporate USEPA Method 7473 (CAS No. 7439-97-6) Mercury Solids and Solutions by Thermal Decomposition, Gold Amalgamation, and Atomic Absorption Spectrophotometry for Hg analysis [24]. The primary difference between the two Combustion AA Hg analyzers was the size of the sample boat, which limited the size of the soil sample. The lower detection limit for the Nippon Instruments North America, Mercury Analyzer Model MA-2000 and for the Milestone Direct Mercury Analyzer, Model DMA-80 was 0.005 ng.
Liquid Hg standard solutions were used to assess instrument performance. Analytical quality control procedures included the calibration of each instrument, analysis of blank aliquots and spiked aliquots. Liquid Hg standard solutions were also used to verify the absence of analyzer drift. One procedural blank was processed with each set of samples. Spiked and blank sample recoveries were within QC goals. The average percent recovery was 99 ± 0.47 for the CVAAS, 99 ± 0.07 for the MA-2000 and 99 ± 1.5 for the DMA-80.
2.4. Assumptions
The pilot study did not include human subjects. Instead, physical characteristics of a hypothetical year-old infant were extracted from the annual National Health and Nutrition Examination Survey (NHANES). Survey data were collected from a representative sample of 5000 persons and were used by the National Center for Health Statistics (NCHS) to access the health of United States residents.
According to the USEPA [13], the proportion of organic Hg in soil depends on the organic content of the soil sample. Hair and blood are the preferred biomarkers to measure organic Hg exposure and urine is typically used to measure exposure to inorganic Hg and Hg0 [25]. In the absence of any speciation data for this study, the Hg contained in our topsoil samples was assumed to be organic Hg.
Several different pharmacokinetic models were examined. Allen et al. developed a Bayesian model to estimate a priori organic Hg exposure of 1582 women based on their blood Hg levels reported in the 1999-2000 NHANES study [26]. Farris et al. documented excretion kinetics based on five adult males exposed intravenously to inorganic mercury [27]. Gearhart et al. used previously published estimates of tissue volume, the red blood cell to plasma ratio and blood flow parameters to compare CH3Hg kinetics in humans and monkeys [28]. To test a new translation of the multi-compartment, physiologically based pharmacokinetic model developed by Carrier et al. [29], Ruiz et al. compared computer-simulated urinary and fecal excretion patterns to the actual excretion of Hg over 200 days by three volunteers who were deliberately exposed to methyl mercuric nitrate in fish [30].
The pharmacokinetic model presented in Equation (6) was developed after the Iraqi Hg poisoning incident [31]. Grain harvests in Iraq were poor in 1969 and 1970. In 1971, wheat seeds covered with CH3Hg, a fungicide, were imported from Mexico for planting in Basra. The seed arrived late, after the sowing season. Eventually, the farmers and their families ate the seeds. Thousands died. Thousands of children were born with Hg poisoning.
The Al-Shahristani pharmacokinetic model for blood Hg provides a snapshot in time. Although in most longitudinal cohort studies, some appointments are missed and rescheduled, we assumed that our hypothetical child was exactly 365 days old. Other required biological parameters include the initial blood Hg concentration at birth, body weight and blood volume on the 365th day, Hg concentration in soil and the soil ingestion rate, percent absorption in the gut, and CH3Hg half-life. For the initial blood Hg concentration, we used the average Hg concentration in umbilical cord blood (5.8 μg/L) based on the NHANES 2000-2004 data [4].
The body weight used for our hypothetical infant was 10 kg. The average weight of a year-old infant was extracted from growth rate charts [32]. At one year of age, boys in the 50th percentile weighed 10.3 kg. Girls in the 50th percentile weighed 9.5 kg.
Children double their body weight during the first year of life with some change in blood volume. We used the average estimated blood volume for a one year-old infant, 82.4 ml/kg [33].
Soil ingestion is strongly correlated with hand-tomouth behaviors. For this study we assumed that, on average, children ingest up to 200 mg soil/day [34]. This number may be conservative for teething infants and may be too high for infants who are never placed on the floor.
The accepted oral reference dose for CH3Hg (0.0001 mg/kg-day) was determined from a benchmark dose approach based on maternal blood Hg levels; however, no reference dose has been established for chronic oral exposure to inorganic mercury. A study of five subjects exposed intravenously to inorganic mercury assumed a linear relationship between exposure, uptake, transport and excretion [27]. Their two-compartment model defines the immobile compartment as Hg bound to protein while the mobile compartment contains Hg bound to small molecules, which can easily enter excretory pathways. Almost all of the Hg eliminated via feces or urine originates in the immobile compartment. Rates of elimination appear dependent upon glutathione-mercury transport to the kidneys, metallothionein binding of Hg in the gut, bile production, and exfoliation of GI mucosal cells. Thus, the fraction of Hg absorbed in the gut varies between 10% - 30% [35]. We used 20% in our calculation.
The Farris study provides some understanding of the mechanisms that contribute to the variability noted in the determination of inorganic mercury half-life in the body [27]. Two Iraqi studies observed a range for the half-life of CH3Hg in blood between 35 and 189 days [31,36]. The half-life of CH3Hg in infants may be somewhat longer due to delayed bile production and immature protein synthesis pathways [27,36]. The authors agreed with a study of young children by Pichichero et al., which recommended a half-life of 44 days for ingested CH3Hg [37].
The analytical method used did not reveal the speciation of Hg in our soil samples. The species of most concern is CH3Hg. Thus, soil ingestion was modeled as a chronic, daily exposure to CH3Hg. A final simplifying assumption was that the sequestration of Hg in bone and tissue was incorporated in the half-life rate constant k. The development of the equation follows.
Half-life calculations based on pharmacokinetics:
A0 = initial blood Hg concentration At = blood Hg concentration on day t k = reaction rate constant t = duration of exposure in days At = A0 * e–kt, Equation (1)
The rate constant k for a half-life of 44 days [37] is:
T1/2 = 44 days = (ln 2)/k, Equation (2)
k = 0.015753345 day−1.
“Safe” levels of Hg exposure have not been established for children. The relationship between soil contamination levels (CS) and infant blood levels (B) is developed:
E = Daily Exposure (mg/day)
E = CS × IR × CF1 × FA, where Equation (3)
CS = Chemical concentration in soil IR = Ingestion rate (200 mg soil/day) [34]
CF1 = Conversion factor (10−6 kg/mg)
FA = fraction absorbed (10% - 30%) [35], assume 20% Conversion of exposure with regards to blood volume:
EBV = Estimated blood volume (82.4 ml/kg) [33]
BW = Body weight (10 kg) [32]
CF2 = conversion factor (L/1000 ml)
CF3 = conversion factor (1000 μg/mg)
EBC = Estimated blood concentration due to daily soil ingestion (μg/L-day)
EBC = (E × CF3)/(EBV × BW × CF2), Equation (4).
Relationship between infant blood Hg (B), daily exposure (EBC) and Hg elimination (kB), ignoring sequestration [36]:
B0 = 5.8 μg/L, average umbilical cord blood Hg [4]
B = Blood Hg at time t t = days of exposure = 365 dB/dt = rate of change in blood Hg kB = elimination rate dB/dt = EBC – kB, Equation (5)
B = B0 * e–kt + [EBC/k * (1 – e−kt)], Equation (6).
3. Data Analysis
3.1. Soil Samples
Descriptive statistics were calculated for weight, total measured Hg, and Hg concentration for each set of soil samples: mean, standard error, median, mode, standard deviation, sample variance, skew, kurtosis, range, minimum, maximum, and sum. The data sets were further examined using appropriate statistical methods.
3.2. Blood Mercury Calculations
Equations (1) to (6) were used to calculate the blood Hg concentration of a one year-old infant based on the assumptions presented in our Methods [32-36]. Soil concentrations used in Equation (3) were 0.02 mg/kg, 0.04 mg/kg, and 0.08 mg/kg. Using Equation (4), the corresponding increase in blood concentration after one exposure was 9.7 × 10⁻⁴ μg/L-day, 2.4 × 10⁻³ μg/L-day, and 3.9 × 10⁻³ μg/L-day. After a year of chronic, daily exposure, our theoretical infant’s total blood Hg concentration, calculated by Equation (6), would be 0.08 μg/L, 0.17 μg/L, 0.26 μg/L.
4. Results
Three homogenized topsoil samples (16900 ± 1530 mg) from site A digested and analyzed by CVAAS contained an average Hg concentration of 0.043 ppmw (Tables 1 and 2). Additional soil samples were analyzed with the Combustion AA instruments. Five soil samples (484 ± 143 mg) from site A analyzed on the MA-2000 contained an average Hg concentration of 0.103 ppmw (Table 1). Four soil samples (67 ± 29 mg) analyzed on the DMA-80 contained an average Hg concentration of 0.081 ppmw (Table 1). Using the data for all 12 samples, the weighted-adjusted average Hg concentration of topsoil (53.3 g) from site A was 0.046 ppmw.
Nine aliquots containing soil (17390 ± 1320 mg) from site B were digested and analyzed by CVAAS. The average Hg measured was 1.42 μg ± 1.06 μg (Table 2). The average Hg concentration in site B topsoil (156.5 g) was 0.081 ppmw.
Fifteen homogenized samples (1031 ± 32 mg each; total 15.5 g soil) from site C were digested and analyzed by CVAAS. Hg measured in those samples ranged from BDL to a high of 0.08 μg. The average concentration of Hg in topsoil from these samples was 0.022 ppmw. The data appeared to have a non-normal distribution. Six additional samples were analyzed from 1 divot measuring “(3/4)f × 2(1/2)” deep and containing 8.99 g soil. The
Table 1. Observations of mercury at site A.

*The average of all samples (n = 12) is 0.046 ppm.
Table 2. Comparison of CVAAS results topsoil analysis at suburban residential sites.
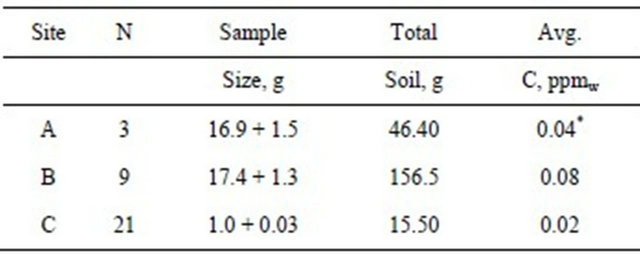
*Average for samples analyzed by CVAAS.
average concentration was 0.082 ppmw. The sample with the highest concentration (0.29 ppm) was located at a depth of 5/16” from the exposed surface of the divot. The distribution of Hg in this divot was non-linear. Using all 21 samples, the average concentration of Hg in topsoil from site C was 0.044 ppmw (Table 2).
5. Discussion
This is the first study to propose that measured Hg in soil may have some effect on blood Hg levels in infants. The range of Hg contamination in topsoil in suburban areas has not established. The USEPA survey of soils collected in North America reported an average background Hg concentration of 0.022 ppm with a range of 0.0005 to 0.07 ppmw [13]. How do our topsoil samples compare? Samples from site A and non-divot samples from site C contained an average Hg concentration of 0.046 ppmw and 0.021, respectively. The topsoil Hg concentration for sites A and C were within the range (0.0005 to 0.07 ppmw) reported for remote and rural soils [13]. The average Hg concentration measured in topsoil at site A was similar to the concentration reported by Sloan for un-amended agricultural soils (0.05 ppmw) [38]. The highest concentration (0.08 ppmw), measured at site B and in the divot at site C, was less than the concentration measured in Ottawa garden soil (0.107 ppm) [16]. The Hg concentration in site C non-divot samples was lower than the concentration reported in the USEPA study for rural soils at Caldwell, Ohio (0.026 ppm) [13]. All three sites contain significantly lower concentrations than the 10 ppm permitted by law in the State of Massachusetts [39].
The differences noted in soil Hg concentrations at our three sites may be due to local variations in precipitation volume or other factors, but all are within the expected range for relatively unexposed soils.
Descriptive statistics were calculated for each set of data. The mean, median and variance for Hg concentration at site A were (0.080, 0.1007, 0.0039). The mean, median and variance for Hg concentration at site B were (0.080, 0.0604, 0.0034). The mean, median and variance for Hg concentration at site C were (0.045, 0.0195, 0.0047). The difference of means suggests that the soils at sites A and B are more similar to each other in terms of Hg concentration than they are to soils at site C.
What is the average concentration of Hg in infant blood? The adjusted geometric mean total blood Hg for children ages one to five, according to NHANES 1999- 2006 data (n = 3456), ranges from 0.32 to 0.34 μg/L [3]. Another study of children (n = 452) ages two to five reported geometric mean concentrations of Hg in blood from 0.16 to 0.26 μg/L [40]. Infants do not eat fish. Is there enough Hg in soil to explain the measured Hg in infant blood?
How plausible is our hypothesis? Ignoring genetic, behavioral, dietary and environmental factors and assuming a 44-day half-life of Hg in blood, 365 days of exposure to 200 mg soil containing 0.08 ppm Hg (CSB) may result in a blood Hg concentration of BB44 = 0.26 μg/L (Table 3). This compares to the higher reported average blood Hg concentration in the Hertz-Picciotto study [40]. Lower soil Hg concentrations (CSA = 0.046 ppm and CSC = 0.021 ppm) correspond to lower infant blood concentrations of BA44 = 0.17 and BC44 = 0.08 μg/L, respectively. The uncertainty of half-life estimates for infants muddies this discussion. If Wigle’s 50 days half-life is assumed for infants, the resulting blood Hg concentrations would be somewhat higher (0.21 μg/L at site A, 0.32 μg/L at site B, and 0.11 μg/L at site C) [8]. Thus, previously ignored environmental factors such as garden soil and house dust ingestion may explain a significantly greater portion of blood Hg than can be attributed to dietary sources such as fish. We believe there are significant health benefits associated with fish consumption. Since Hg ingestion through eating fish explains less than 22% of blood Hg in fish-eating communities, the current USEPA advisory against fish consumption by
Table 3. Calculated blood Hg concentration, μg/L.
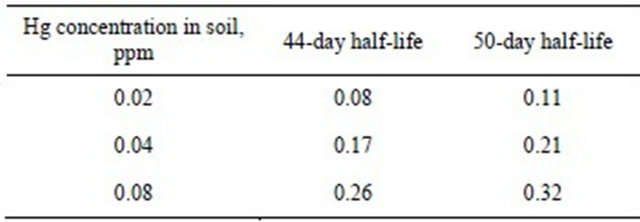
pregnant women may need to be revisited.
Our study used a hypothetical, average year-old infant exposed to an average daily ingestion of soil containing a very low level of Hg-and the Al-Shahristani model [31, 36] may explain the measured blood Hg concentration in infants. To assess the effect of measured soil Hg concentrations on our hypothetical infant, several assumptions were made, including the amount of soil Hg metabolized to CH3Hg (100%), percent absorption of mercury in the gut (20%), initial blood Hg concentration (5.8 μg/L), infant blood volume at age 365 days (82.4 ml/kg), and infant weight (10 kg) [32-35]. Changes in blood volume and weight from birth to 365 days were not considered in the Al-Shahristani model [31,36]. Future studies of specific cohorts of infants and soil and dust samples taken from their residences are needed to confirm or refute our findings.
6. Acknowledgements
Partial funding for this research was provided by National Institute of Environmental Health Sciences (NIEHS) T32 ES010957, NIEHS P30-ES06096 and NIEHS ES11170. Additional funding through the National Institute for Occupational Safety and Health (NIOSH), Pilot Research Project Training Program of the University of Cincinnati, Education and Research Center, Grant #T42/OH008432-04.
Samples from site A were analyzed on the Milestone Direct Mercury Analyzer, Model DMA-80 through an agreement with Souhail Al-Abed at the U.S.E.P.A. and Patricio Pinto with Pegasus Technical Services. Access to the Nippon Instruments North America, Mercury Analyzer Model MA-2000 was made possible by an agreement with Jennifer Triplett of Terra Technologies Inc., Louisville, KY, USA, and Jason Gray of AGS Scientific, Inc. in College Station, TX, USA.
The authors thank David Dankovic, Ph.D. and Thomas J. Lentz, Ph.D. of the Centers for Disease Control and Prevention, National Institute for Occupational Safety and Health and Andy Maier, Ph.D., CIH., DABT of Tera Technologies for their assistance with the preparation of the manuscript.
REFERENCES
- United States Environmental Protection Agency, “Mercury Study Report to Congress,” Office of Air Quality Planning and Standards and Office of Research and Development, Washington, 1997.
- K. R. Mahaffey, “Exposure to Mercury in the Americas,” In: Dynamics of Mercury Pollution on Regional and Global Scales: Atmospheric Processes and Human Exposures around the World, Springer Science, New York 2005, pp. 345-384. doi:10.1007/0-387-24494-8_15
- K. L. Caldwell, M. E. Mortensen, R. L. Jones, S. P. Caudill and J. D. Osterloh, “Total Blood Mercury Concentrations in the US Population: 1999-2006,” International Journal of Hygiene and Environmental Health, Vol. 212, No. 6, 2009, pp. 588-598. doi:10.1016/j.ijheh.2009.04.004
- K. R. Mahaffey, R. P. Clickner and R. A. Jeffries, “Adult Women’s Blood Mercury Concentrations Vary Regionally in the United States: Association with Patterns of Fish Consumption (NHANES 1999-2004),” Environmental Health Perspectives, Vol. 117, No. 1, 2009, pp. 47-53. doi:10.1289/ehp.11674
- H. J. Mason, P. Hindell, N. R. Williams, “Biological Monitoring and Exposure to Mercury,” Occupational Medicine (London), Vol. 51, No. 1, 2001, pp. 2-11. doi:10.1093/occmed/51.1.2
- M. R. Risch, E. M. Prestbo and L. Hawkins, “Measurement of Atmospheric Mercury Species with Manual Sampling and Analysis Methods in a Case Study in Indiana,” Water, Air, and Soil Pollution, Vol. 184, No. 1-4, 2007, pp. 285-297. doi:10.1007/s11270-007-9416-y
- J. F. Risher, H. E. Murray and G. R. Prince, “Organic Mercury Compounds; Human Exposure and Its Relevance to Public Health,” Toxicology and Industrial Health, Vol. 18, No. 3, 2002, pp. 109-160. doi:10.1191/0748233702th138oa
- D. T. Wigle, “Child Health and the Environment,” University Press, Oxford, 2003.
- W. Jedrychowski, F. Perera, J. Jankowski, V. Rauh, E. Flak, K. L. Caldwell, R. L. Jones, A. Pac and I. Lisowska-Miszczyk, “Fish Consumption in Pregnancy, Cord Blood Mercury Level and Cognitive and Psychomotor Development of Infants Followed over the First Three Years of Life: Krakow Epidemiologic Study,” Environment International, Vol. 33, No. 8, 2007, pp. 1057- 1062. doi:10.1016/j.envint.2007.06.001 http://www.ncbi.nlm.nih.gov/pubmed/17643489
- J. Morrissette, L. Takser, G. St-Amour, A. Smargiassi, J. Lafond and D. Mergler, “Temporal Variation of Blood and Hair Mercury Levels in Pregnancy in Relation to Fish Consumption History in a Population Living Along the St. Lawrence River,” Environmental Research, Vol. 95, No. 3, 2004, pp. 363-374. doi:10.1016/j.envres.2003.12.007
- United States Census Bureau, “2000 Census,” 2010. http://www.census.gov/main/www/cen2000.html
- B. P. Lanphear and K. J. Roghmann, “Pathways of Lead Exposure in Urban Children,” Environmental Research, Vol. 74, No. 1, 1997, pp. 67-73. doi:10.1006/enrs.1997.3726
- United States Environmental Protection Agency, “Pilot Survey of Levels of Polychlorinated Dibenzo-p-Dioxins (PCDDs), Polychlorinated Dibenzofurans (PCDFs), Polychlorinated Biphenyls (PCB) and Mercury in Rural Soils of the US,” US Environmental Protection Agency, Washington, 2007.
- D. G. Turer and J. B. Maynard, “Heavy Metal Contamination in Highway Soils. Comparison of Corpus Christi, Texas and Cincinnati, Ohio Shows Organic Matter is Key to Mobility,” Clean Technologies and Environmental Policy, Vol. 4, No. 4, 2003, pp. 235-245. doi:10.1007/s10098-002-0159-6
- L. M. Yinn, G. G. Rhoads, P. J. Lioy, “Seasonal Influences on Childhood Lead Exposure,” Environmental Health Perspectives, Vol. 108, No. 2, 2000, pp. 177-182. doi:10.1289/ehp.00108177
- P. E. Rasmussen, K. S. Subramanian and B. J. Jessiman, “A Multi-Element Profile of Housedust in Relation to Exterior Dust and Soils in the City of Ottawa, Canada,” Science of the Total Environment, Vol. 267, No. 1-3, 2001, pp. 125-140. doi:10.1016/S0048-9697(00)00775-0
- J. G. Wiener, B. C. Knights, Sandgeinrich, J. D. Jeremiason, M. E. Brigham, D. R. Engstrom, L. G. Woodruff, W. F. Cannon and S. J. Balogh, “Mercury in Soils, Lakes, and Fish in Voyageurs National Park (Minnesota): Importance of Atmospheric Deposition and Ecosystem Factors,” Environmental Science and Technology, Vol. 40, No. 20, 2006, pp. 6261-6268. doi:10.1021/es060822h
- United States Environmental Protection Agency, “Toxic Release Inventory,” 2009. http://www.epa.gov/triexplorer
- National Air Deposition Program Mercury Deposition Network, “2008 Concentration Maps,” 2009. http://nadp.sws.uiuc.edu/MDN
- P. F. Heckel and G. K. LeMasters, “The Use of AERMOD Air Pollution Dispersion Models to Estimate Residential Ambient Concentrations of Elemental Mercury,” Water Air Soil Pollution, Vol. 219, No. 1, 2011, pp. 377-388. doi:10.1007/s11270-010-0714-4
- United States Environmental Protection Agency, “Preparation of Soil Sampling Protocols: Sampling Techniques and Strategies,” Office of Research and Development, Washington, 1992. http://www.epa.gov/swerust1/cat/mason.pdf
- P. Heckel, “Environmental Mercury Exposure of Terrestrial Life Forms,” VDM Verlagsservicegesellschaft mbH, Saarbrücken, 2010.
- P. F. Heckel and T. C. Keener, “Acidic Digestion of Soils to Determine Mercury Concentration,” American Laboratory News, Vol. 39, 2007, pp. 13-18.
- United States Environmental Protection Agency, “Method 7473 Mercury Solids and Solutions by Thermal Decomposition, Gold Amalgamation, and Atomic Absorption Spectrophotometry,” 2004. http://www.epa.gov/sam/pdfs/EPA-7473.pdf
- J. F. Risher and C. DeRosa, “Inorganic: The Other Mercury,” Journal of Environmental Health, Vol. 70, No. 4, 2007, pp. 9-16.
- B. C. Allen, C. E. Hack and H. J. Clewell, “Use of Markov Chain Monte Carlo Analysis with a Physiologicallybased Pharmacokinetic Model of Methylmercury to Estimate Exposures in US Women of Childbearing Age,” Risk Analysis, Vol. 27, No. 4, 2007, pp. 947-959. doi:10.1111/j.1539-6924.2007.00934.x
- F. F. Farris, A. Kaushal and J. G. Strom, “Inorganic Mercury Pharmacokinetics in Man: A Two-Compartment Model,” Toxicological & Environmental Chemistry, Vol. 90, No. 3, 2008, pp. 519-533. doi:10.1080/02772240701602736
- J. M. Gearhart, H. J. Clewell III, K. S. Crump, A. M. Shipp and A. Silvers, “Pharmacokinetic Dose Estimates of Mercury in Children and Dose-response Curves of Performance Tests in a Large Epidemiological Study,” Water, Air, and Soil Pollution, Vol. 80, No. 1-4, 1995, pp. 49-58. doi:10.1007/BF01189652
- G. Carrier, M. Bouchard and R. C. Brunet, “A Toxicokinetic Model for Predicting the Tissue Distribution and Elimination of Organic and Inorganic Mercury Following Exposure to Methyl Mercury in Animals and Humans. II. Application and Validation of the Model in Humans,” Toxicology and Applied Pharmacology, Vol. 171, No. 1, 2001, pp. 50-60. doi:10.1006/taap.2000.9113
- P. Ruiz, B. A. Fowler, J. D. Osterloh, J. Fisher, M. Mumtaz, “Physiologically Based Pharmacokinetic (PBPK) Tool Kit for Environmental Pollutants-Metals,” SAR and QSAR in Environmental Research, Vol. 219, No. 7-8, 2010, pp. 603-618. doi:10.1080/1062936X.2010.528942
- H. Al-Shahristani and K. M. Shihab, “Variation of Biological Half-Life of Methylmercury in Man,” Archives of Environmental Health, Vol. 28, No. 6, 1974, pp. 342-344.
- Centers for Disease Control and Prevention, “Growth Charts,” 2010. http://www.cdc.gov/growthcharts/
- O. Linderkamp, H. T. Versmold, K. P. Riegel and K. Betke, “Estimation and Prediction of Blood Volume in Infants and Children, European Journal of Pediatrics, Vol. 125, No. 4, 1977, pp. 227-234. doi:10.1007/BF00493567
- P. K. LaGoy, “Estimated Soil Ingestion Rates for Use in Risk Assessment,” Risk Analysis, Vol. 7, No. 3, 1987, pp. 355-359. doi:10.1111/j.1539-6924.1987.tb00471.x
- Agency for Toxic Substances and Disease Registry, “Health Consultation. Technical Support Document for a Methylmercury Reference Dose as a Basis for Fish Consumption Status Values,” 2009. http://www.atsdr.cdc.gov/HAC/pha/MethylmercuryReference/TechnicalSupportDocumentforAMethylcercuryReferenceDoseasaBasisforFCSVs9-10-2009.pdf
- H. Al-Shahristani, K, Shihab and I. K. Al-Haddad, “Mercury in Hair as an Indicator of Total Body Burden,” Bulletin of the World Health Organization, Vol. 53, 1976, pp. 105-112.
- M. E. Pichichero, A. Gentile, N. Giglio, V. Umido, T. Clarkson, E. Cernichiari, G. Zareba, C. Gotelli, M. Gotelli, L. Yan and J. Treanor, “Mercury Levels in Newborns and Infants after Receipt of Thimerosal-Containing Vaccines,” Pediatrics, Vol. 121, No. 2, 2008, pp. 208-214. doi:10.1542/peds.2006-3363
- J. J. Sloan, R. H. Dowdy, S. J. Balogh and E. Nater, “Distribution of Mercury in Soil and Its Concentration in Runoff from a Biosolids-Amended Agricultural Watershed,” Journal of Environmental Quality, Vol. 30, No. 6, 2001, pp. 2173-2179. doi:10.2134/jeq2001.2173
- State of Massachusetts, “Chapter 5: Regulatory Standards and Controls,” 2010. http://www.mass.gov/dep/toxics/stypes/mercurych5.htm
- I. Hertz-Picciotto, P. G. Green, L. Delwiche, R. Hansen, C. Walker and I. N. Pessah, “Blood Mercury Concentrations in CHARGE Study Children with and without Autism,” Environmental Health Perspectives, Vol. 118, No. 1, 2010, pp. 161-166. doi:10.1289/ehp.0900736