Open Journal of Acoustics
Vol. 3 No. 2A (2013) , Article ID: 33438 , 14 pages DOI:10.4236/oja.2013.32A004
Advancements in Sound Reflection and Airborne Sound Insulation Measurement on Noise Barriers
Department of Industrial Engineering, University of Bologna, Bologna, Italy
Email: paolo.guidorzi@unibo.it, massimo.garai@unibo.it
Copyright © 2013 Paolo Guidorzi, Massimo Garai. This is an open access article distributed under the Creative Commons Attribution License, which permits unrestricted use, distribution, and reproduction in any medium, provided the original work is properly cited.
Received May 1, 2013; revised June 1, 2013; accepted June 8, 2013
Keywords: Noise Barrier; Reflection Index; Sound Insulation Index; MLS; In-Situ Measurements
ABSTRACT
The in-situ measurement of sound reflection and airborne sound insulation characteristics of a noise barrier in Europe are currently performed following the CEN/TS 1793-5 European standard guidelines (last revision published in 2003 [1]). After some years a large number of barriers measured, the original method has been significantly enhanced and validated in the frame of the EU funded QUIESST project, WP3 [2]. The sound reflection measurement method has been improved using a square 9-microphone grid not rigidly connected to the loudspeaker, an optimized alignment algorithm of free-field and reflected impulse responses, including fractional step shifts and least squares estimation of the best relative position, and a correction for geometrical divergence and sound source directivity. Each single measurement is then validated by means of the Reduction Factor calculation. The airborne sound insulation measurement method has not been markedly changed since 2003, because the procedure is robust and easily applicable as it is, but some problems may still be encountered when measuring highly insulating noise barriers, due to a poor signal to noise ratio of the transmitted impulse response. In those cases it is difficult to realize just after the measurement whether the obtained data are valid or not. A method, applicable on site, to overcome this problem is described here. It is based on the Signal to Noise Ratio estimation of critical parts of the acquired impulse responses and gives a strong validation criterion.
1. Introduction
Noise barriers can be very different for shape and materials, and every day new ones are appearing on the market. It is essential to know their performance in terms of sound absorption and airborne sound insulation—the so called intrinsic characteristics—when placed on the installation site. In spite of this, until few years ago the intrinsic performances of noise barriers have been tested only in the laboratory, in conditions not representative of the vast majority of practical applications.
For example, in the laboratory sound absorption is tested placing a 10 m2 sample on the floor of a reverberation room according to the European standard EN 1793-1 [3]. Similarly, airborne sound insulation is tested placing a 10 m2 sample between two reverberation rooms according to the European standard EN 1793-2 [4]. Then the measurements are done almost as in building acoustics. These laboratory methods imply that the samples are tested in a diffuse sound field, i.e. the sound waves arrive on the test sample from all angles of incidence. This is relevant for applications where the sound field is almost diffuse, like for claddings in tunnels or deep trenches, but it is totally inadequate in open spaces, like alongside roads and railways, where the sound field in not diffuse.
Also, laboratory samples are not representative of real installation conditions and workmanship. Moreover this laboratory methods do not allow an easy control of the long term acoustic performances of noise barriers years after years, as is needed in order to assess their sustainabilities.
Therefore what is really needed is a method to characterize noise barriers in situ, i.e. where they are installed.
For in situ measurements, the European technical specification CEN/TS 1793-5 [1], based on the results of the former ADRIENNE project [5], has been a big step forward and it is currently used by several Member States [6-12], but some problems still remain to be addressed, especially for sound reflection (with the ADRIENNE procedure, sound reflection instead of sound absorption is measured, as of course the two are strictly correlated: the higher the sound absorption, the lower the sound reflection).
2. The ADRIENNE Measurement Method for Sound Reflection
The basic principle of the ADRIENNE measurement method for sound reflection is as follows. A controlled sound source (loudspeaker) emits a transient sound wave that travels past the microphone position to the device under test and is then reflected on it (Figure 1(a)). The microphone placed between the sound source and the device under test receives both the direct sound pressure wave travelling from the sound source to the device under test and the sound pressure wave reflected (including scattering) by the device under test. The power spectra of the direct and the reflected components, corrected to take into account the path length difference of the two components, gives the basis for calculating the Reflection Index.
A loudspeaker-microphone assembly is used, with a microphone rigidly fixed in front of the loudspeaker at a distance of 1.25 m from it and of 0.25 m from the noise barrier reference plane; this assembly can rotate both in the vertical and horizontal directions (Figures 1(a) and 2). A reference position is defined, as the point where the microphone is located when the loudspeaker-microphone assembly is horizontal normal to the noise barrier under test at half the barrier height (Figure 1(a)) and as far as possible from the edges of the sample; additional reference positions can be defined for non flat or non homogeneous samples (see CEN/TS 1793-5 [1]).
Around the reference position, a set of nine measurement positions, including the reference position itself, are defined; they are reached by rotation of the loudspeaker-microphone assembly, around the axis of rota tion, on the same plane in steps of 10˚ (Figures 1(a) and 2).
For flat homogeneous samples having a distance between posts smaller than 4 m, the vertical rotation is
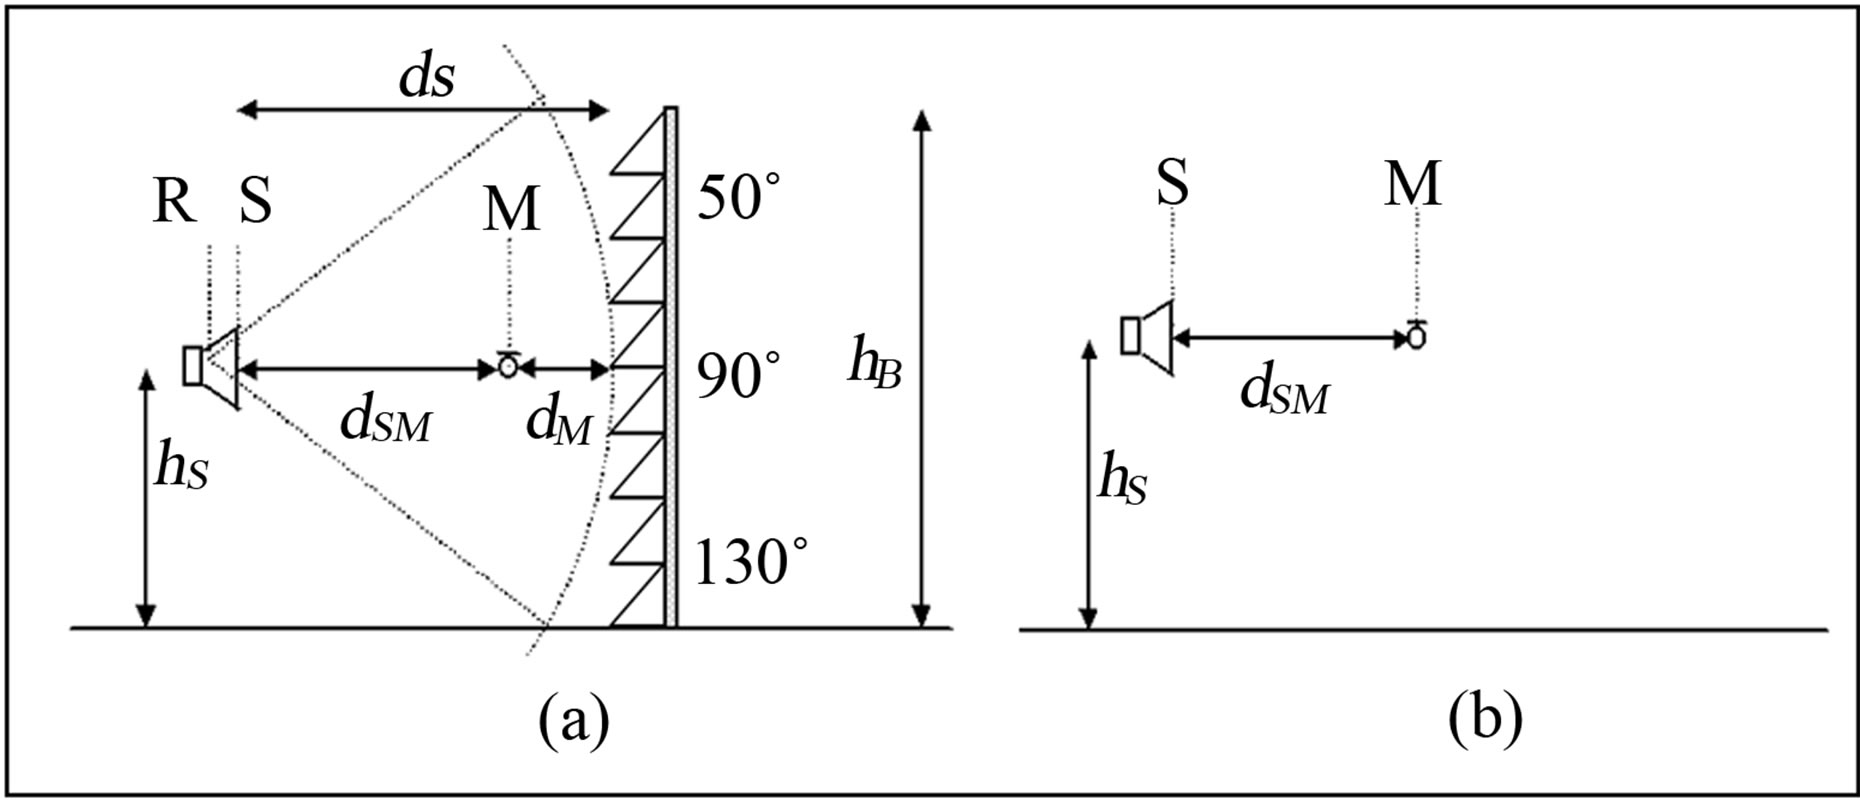
Figure 1. Sketch of the set-up for the reflection index measurement according to CEN/TS 1793-5 (example for rotation in vertical direction). R: axis of rotation; S: loudspeaker front panel; M: microphone. (a) Reflected sound measurements, from 50˚ to 130˚ in step of 10˚ on the same rotation plane, in front of a non flat noise reducing device; (b) Reference “free-field” sound measurement.
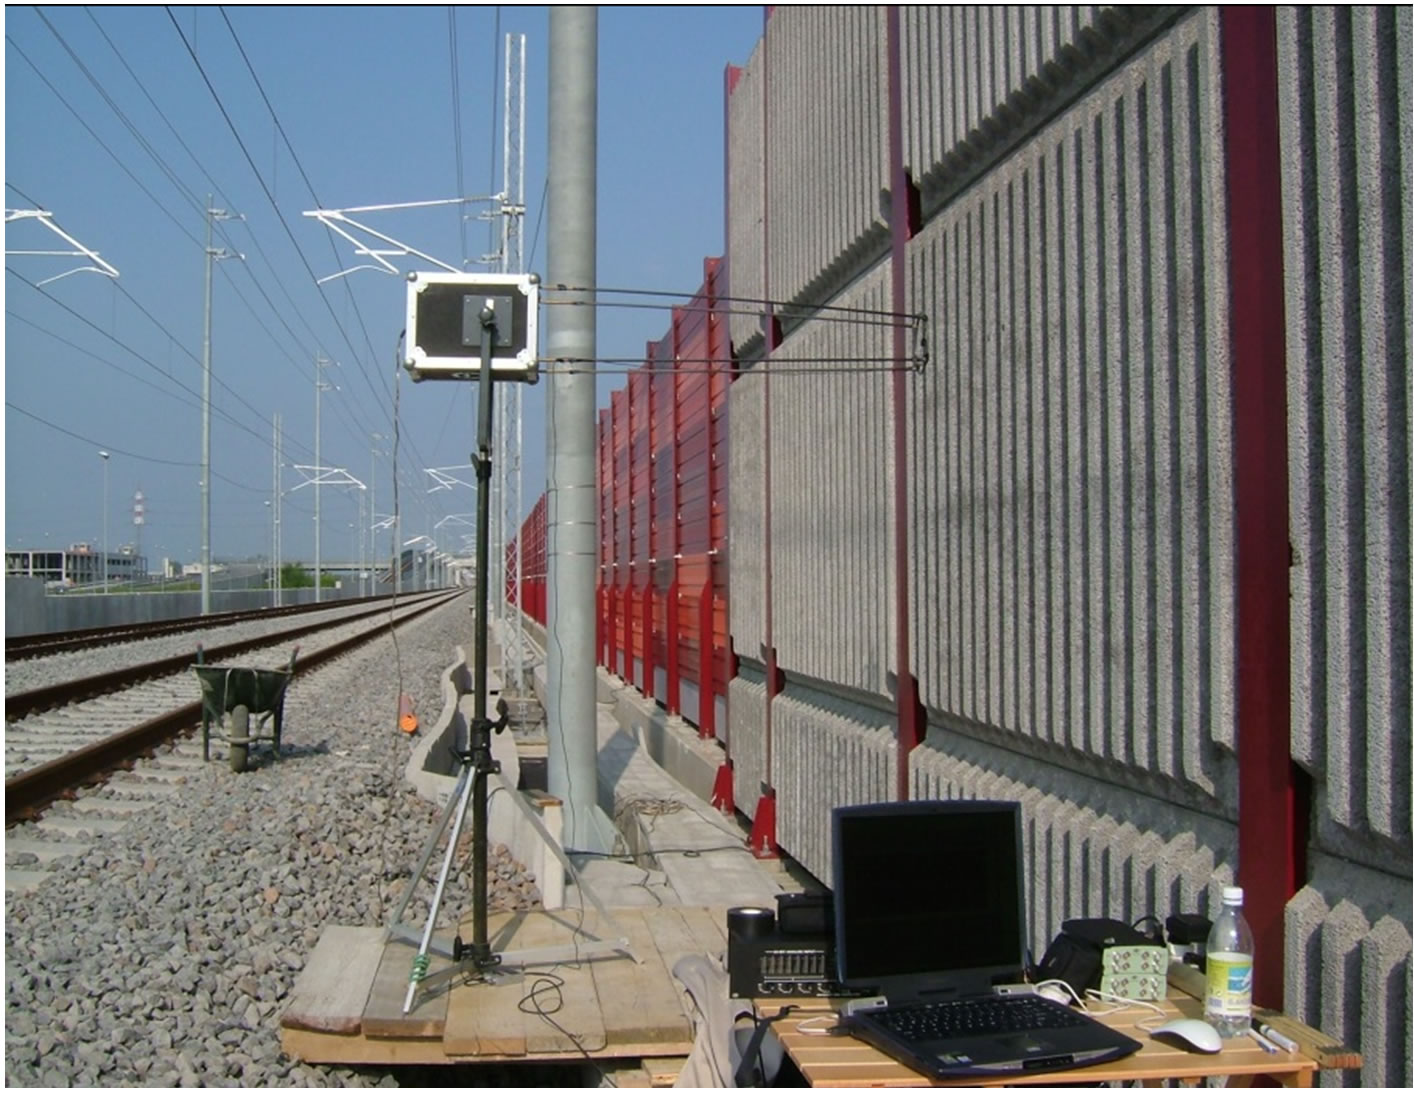
Figure 2. Reflection index measurement according to CEN/ TS 1793-5 along a railway line.
recommended; otherwise, the horizontal rotation is recommended. The nine angles are labelled as follows: 50˚, 60˚, 70˚, 80˚, 90˚(reference), 100˚, 110˚, 120˚, 130˚.
Impulse response measurements are taken in each of the nine positions.
A free-field measurement is taken displacing and/or rotating the loudspeaker-microphone assembly in order to avoid facing any nearby object, including the ground (Figure 1(b)).
Impulse responses are measured using an MLS signal, which is exactly repeatable and can give a strong background immunity [13].
The measurements taken in front of the sample plus the corresponding free-field measurement are then processed and averaged according to Equation (1), where, for each one-third octave band, the measurements to be taken into account in the averaging process are selected according to Table 1 of CEN/TS 1793-5 [1].
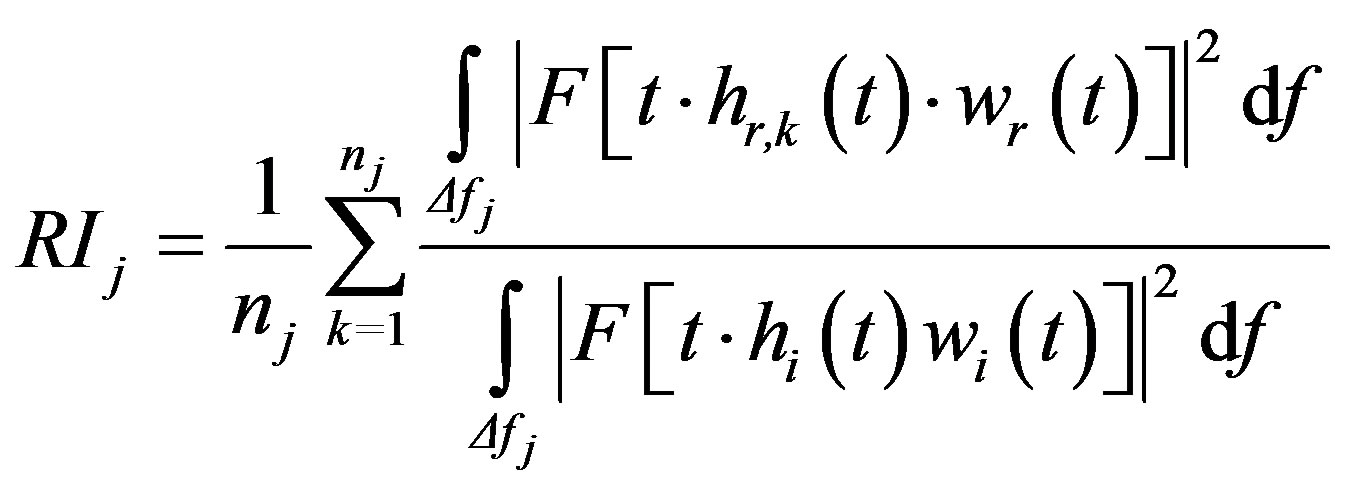 (1)
(1)
where:
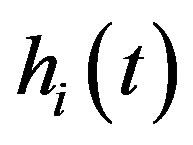 is the incident reference component of the free-field impulse response;
 is the reflected component of the impulse response at the k-th angle;
 is the incident reference free-field component time window (Adrienne temporal window, see below);
 is the reflected component time window (Adrienne temporal window);
 is the symbol of the Fourier transform;
 is the index of the one-third octave frequency bands (between 100 Hz and 5 kHz);
 is the width of the j-th one-third octave frequency band;
 is the number of angles on which to average (
 per rotation);
t is a time whose origin is at the beginning of the impulse response acquired by the measurement chain.
The reflections from different portions of the surface under test arrive at the microphone position at different times, depending on the travel path from the loudspeaker to the position of each test surface portion and back. The longer the travel path from the loudspeaker to a specific test surface portion and back, the greater the time delays. Thus, the amplitude of the reflected sound waves from different test surface portions, as detected at the microphone position, is attenuated in a manner inversely pro portional to the travel time. In order to compensate for this effect, a “t” factor is included in both numerator and denominator in Equation (1).
The European technical specification [1] also allows to compute a single number rating, called  and expressed in dB, from the Reflection Index values in one-third octave bands, in order to categorize and compare the noise barriers, but here only the RI values as a function of frequency will be presented and discussed.
In this procedure, a step is particularly challenging from the point of view of signal processing: the overall impulse response measured in front of the noise barrier consists of a direct component, a component reflected from the surface under test and other parasitic reflections (Figure 3(a)). The direct component and the reflected component from the device under test must be separated. This is done using the signal subtraction technique: the reflected component is extracted from the overall impulse response after having removed the direct component by subtraction of an identical signal (Figures 3(c) and (d)). This means that the direct sound component must be exactly known in shape, amplitude and time delay. This can be obtained by performing a free-field measurement using the same geometrical configuration of the loudspeaker and the microphone. In particular, their relative position must be kept strictly constant. This requirement can be obtained by using a fixed and stable connection between the source and the microphone. The direct component is extracted from the free-field measurement (Figure 3(b)). This technique allows broadening of the time window, leading to a lower frequency limit of the working frequency range, without having very long distances between loudspeaker, microphone and noise barrier under test.
The measurement must take place in a sound field free from reflections coming from objects other than the device under test. However, the use of a time window to select the interesting parts of the impulse response cancels out reflections arriving after a certain time delay, and thus originating from locations further away than a certain distance. According to CEN/TS 1793-5, windowing operations in the time domain are performed using a temporal window, called Adrienne temporal window, with the following specifications (see Figure 4):
• a leading edge having a left-half Blackman-Harris shape and a total length of 0.5 ms (“pre-window”) ;
• a flat portion having a total length of 5.18 ms (“main body”) ;
• a trailing edge having a right-half Blackman-Harris shape and a total length of 2.22 ms.
The total length of the Adrienne temporal window is  ms.
ms.
While this method had the great merit of opening the possibility of extensive checking of noise barriers on site just after their installation (see for example [7,8]), some points need to be further improved.
For example, when doing vertical rotations of the loudspeaker-microphone assembly, the data acquired
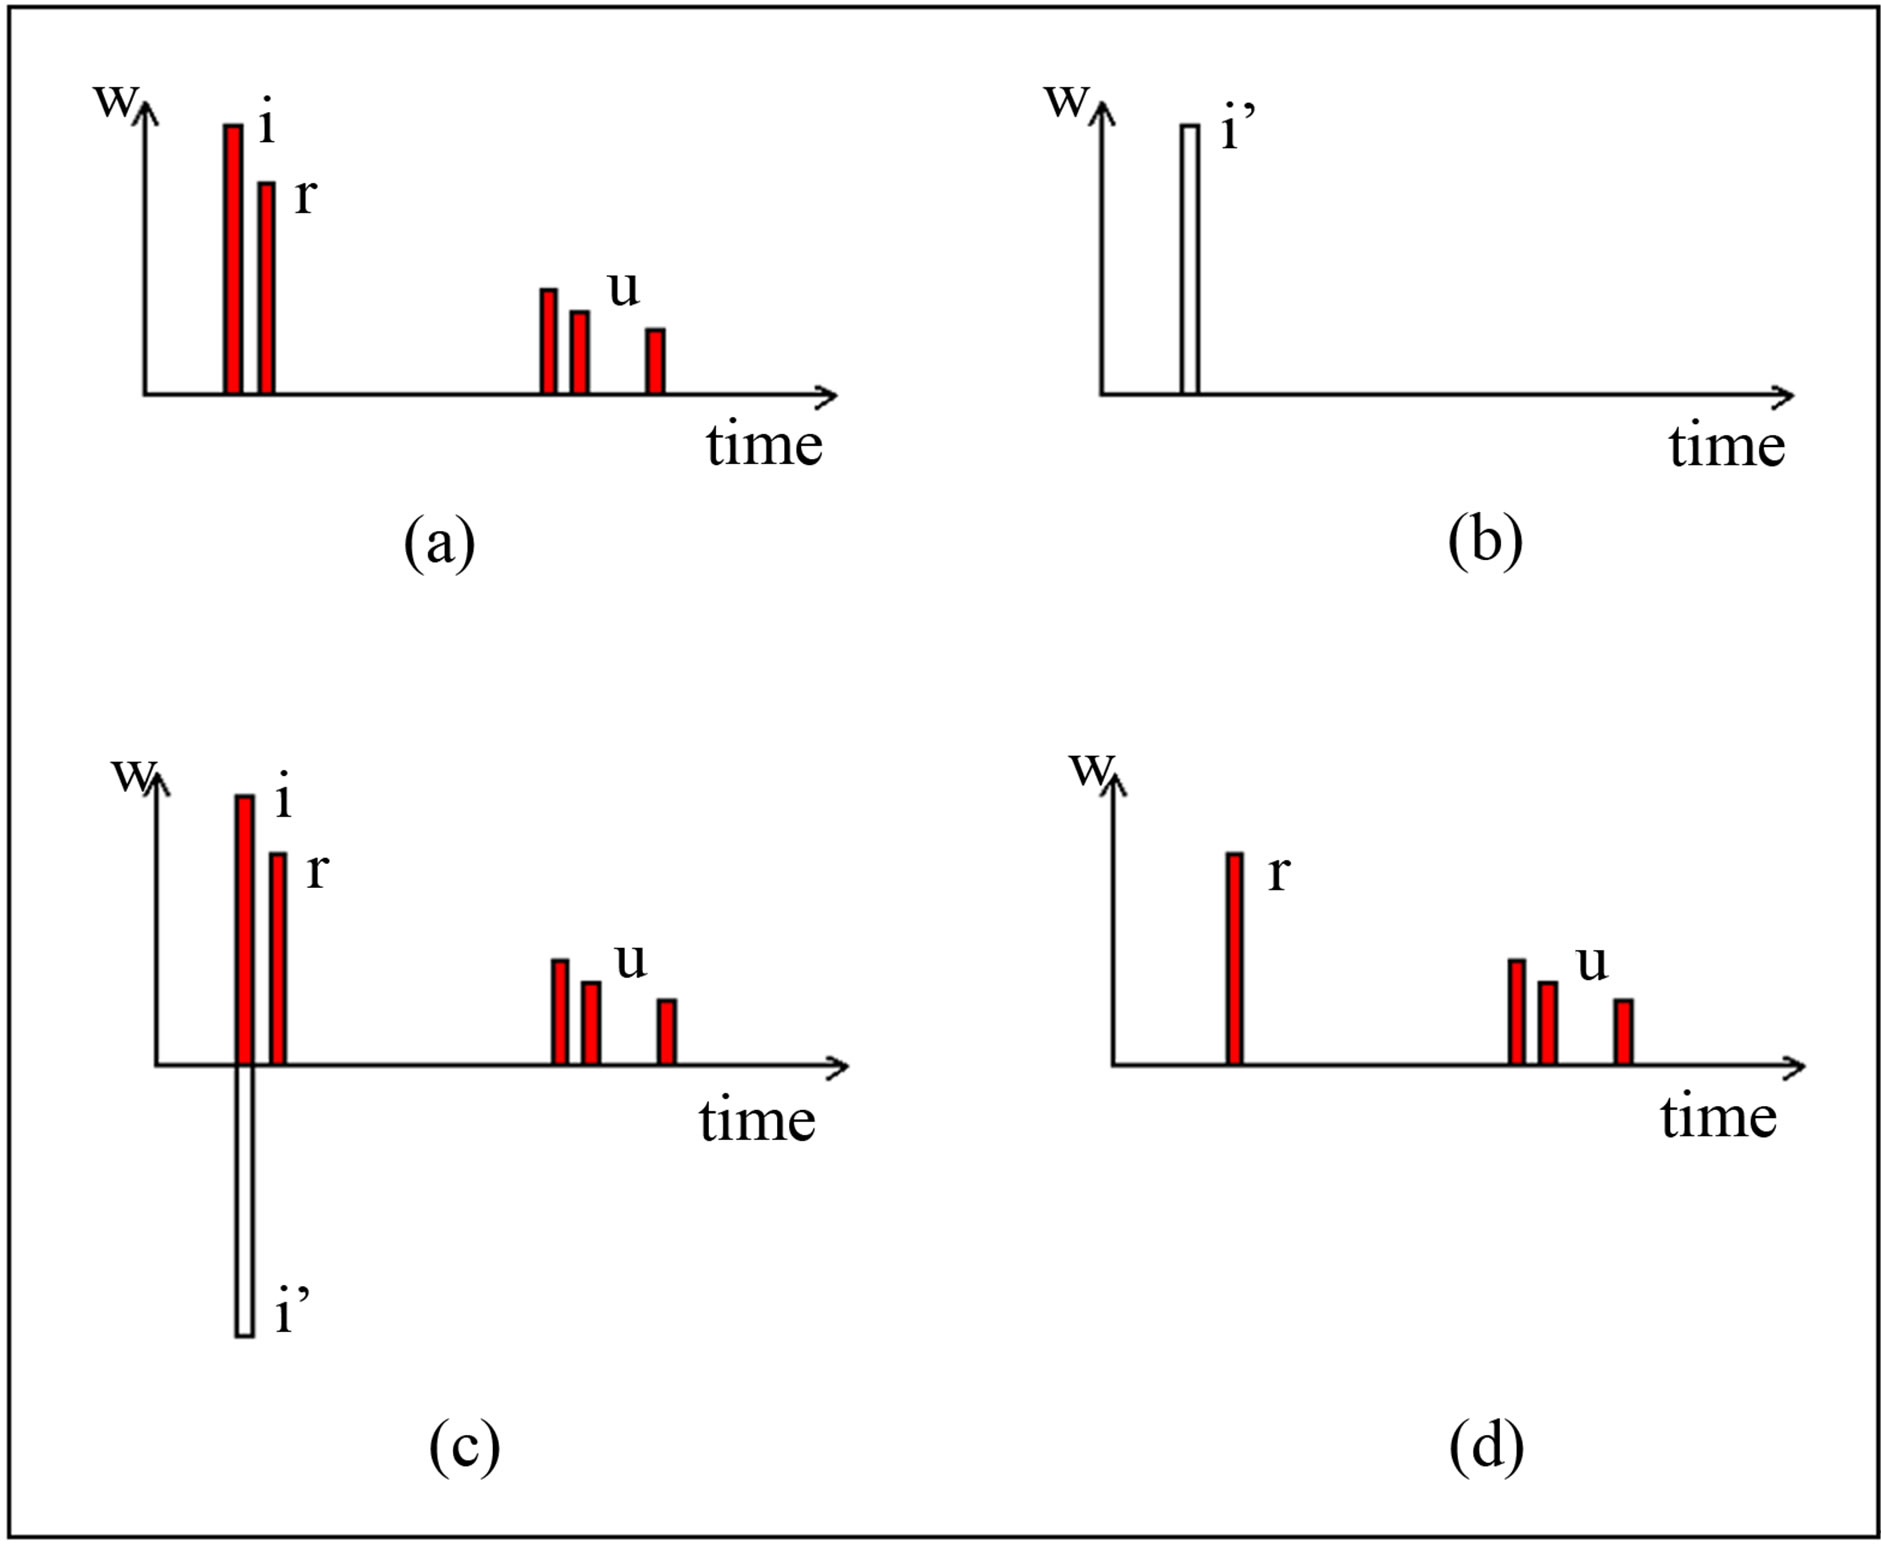
Figure 3. Principle of the signal subtraction technique. (a) Overall impulse response including: direct incident component (i), reflected component (r), unwanted parasitic components (u); (b) Free-field direct component (i’); (c) Direct component cancellation from the overall impulse response using the free-field direct component (i’); (d) Result.
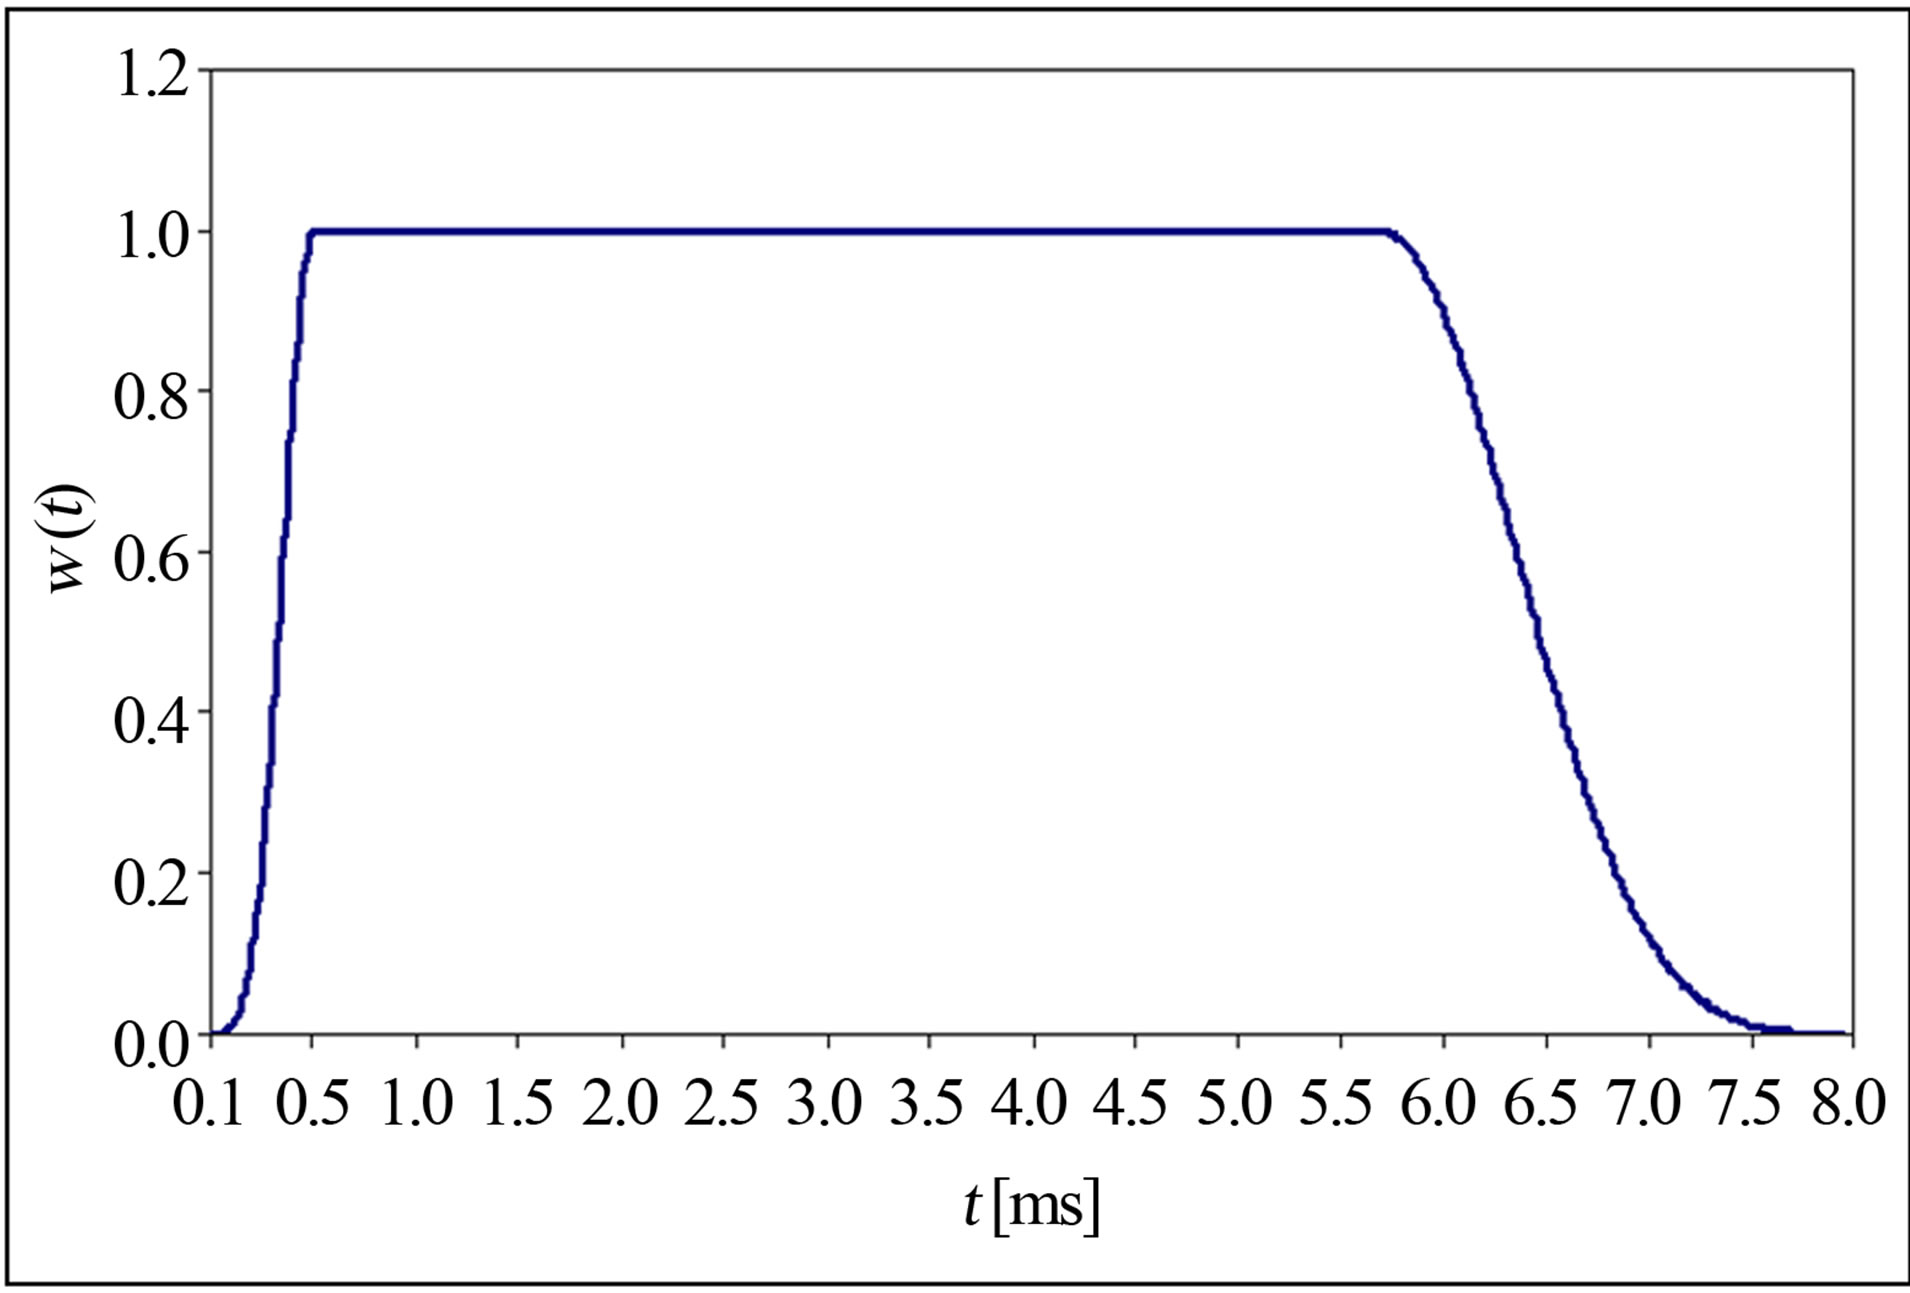
Figure 4. The Adrienne temporal window.
with the microphone in the lower position are not reliable below the 200 Hz one-third octave band for a 4 m high barrier, due to the shortening of data analysis window needed to cut out the ground reflection.
Also, the geometrical divergence correction applied with the “t” factor has the side effect of amplifying late reflections. The sound source directivity is not taken in account.
Finally, in the ADRIENNE measurement procedures no validation criterion is given for the verification in-situ of the measured data just after the measurement. In the frame of the QUIESST project [2], working package 3 (WP3), the test method has been completely revised and all the above mentioned problems found a solution.
 (2)
(2)
3. The QUIESST Measurement Method for Sound Reflection
During the QUIESST project, several improvements have been done to the Reflection Index measurement procedure.
First, the single rotating microphone have been replaced with a square array, having dimensions 0.8 × 0.8 m and including 9 microphones in a 3 × 3 arrangement (Figure 5); it is called microphone grid. The sound source and the microphone grid are positioned in front of the noise barrier at a distance of 1.50 m and 0.25 m respectively from the barrier reference plane (traffic side) (Figures 5 and 6(a)), and a multichannel impulse response measurement is taken.
Second, when the sound source and the microphone grid are moved away from any reflective object—keeping the same relative distance—and the “free-field” measurement is taken, they are no more rigidly connected (Figure 6(b)). This allows an easier management of the measurement on site, but demands a more sophisticated signal processing to overcome possible misalignment problems.
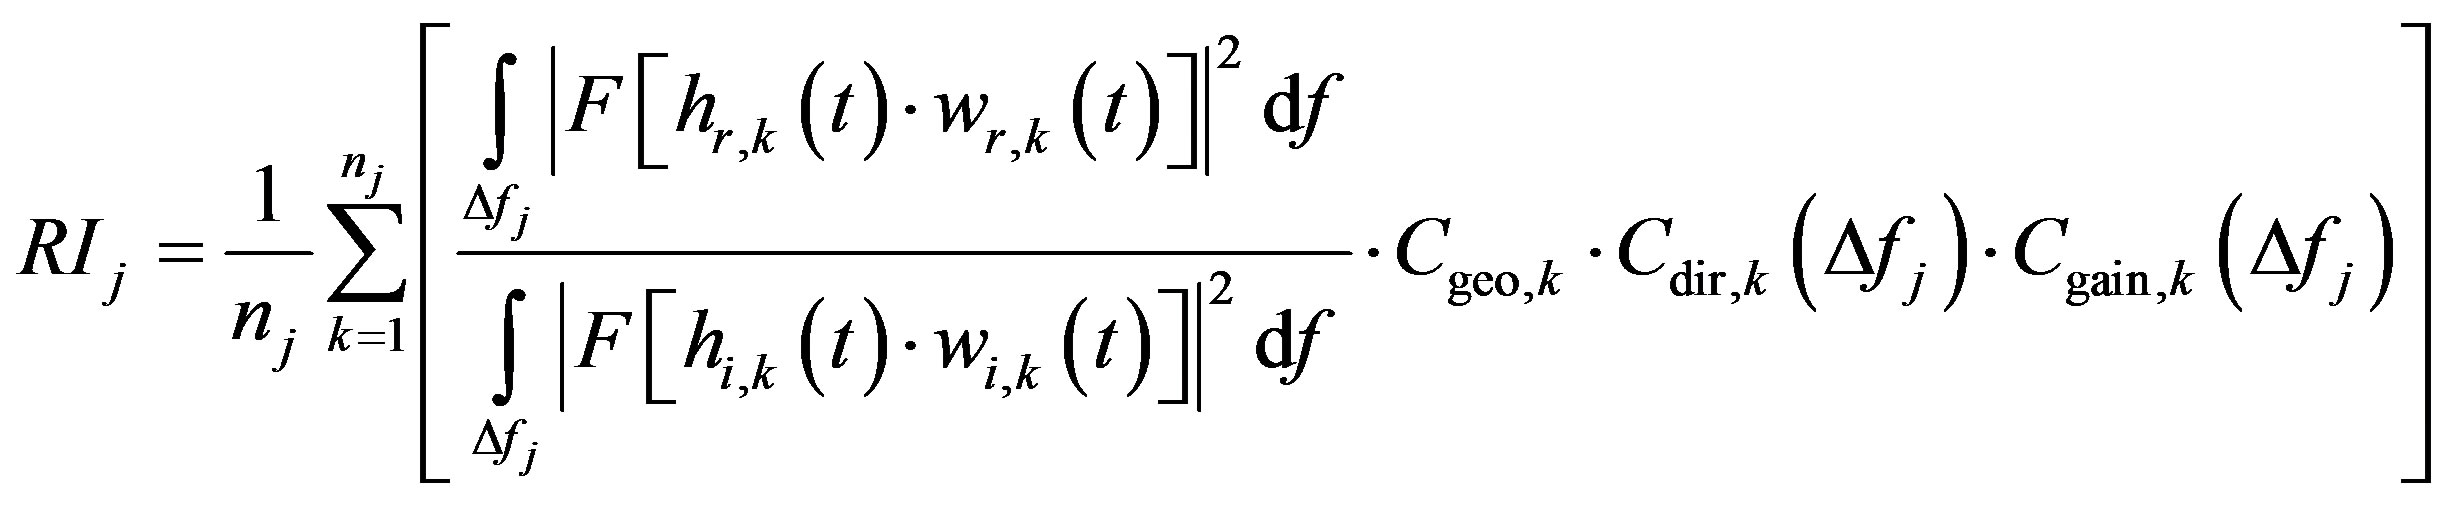
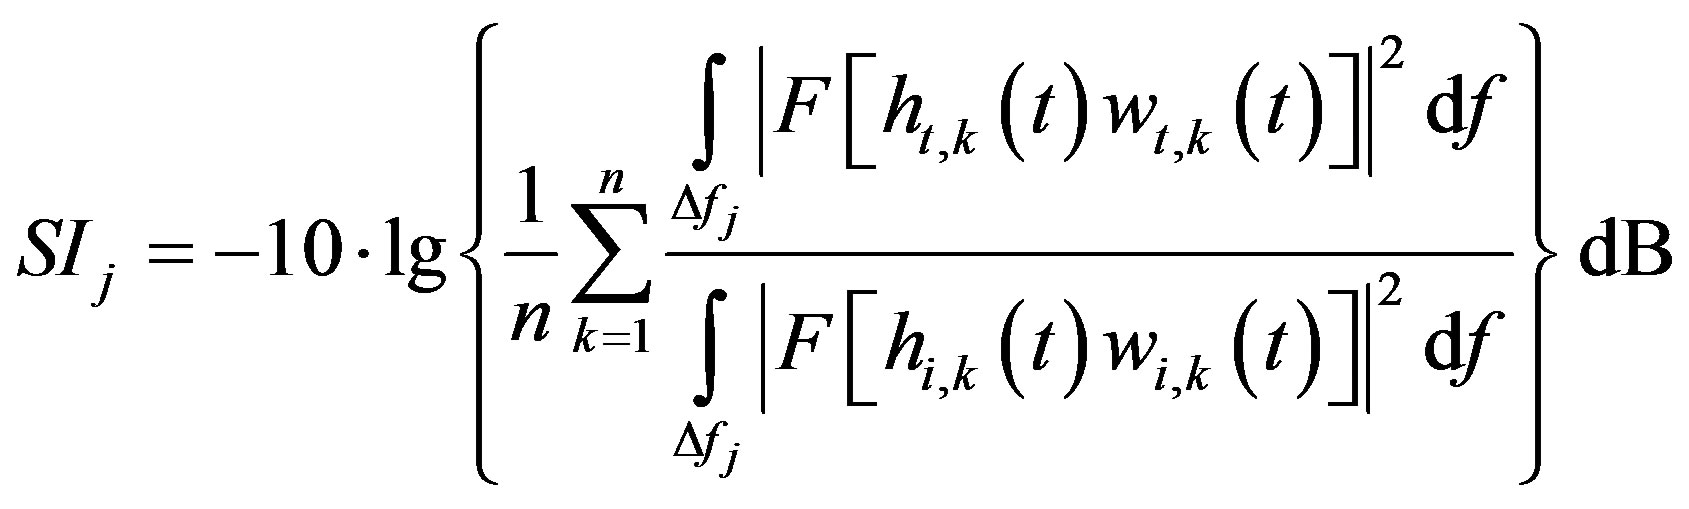
Third, an enhanced calculation method of the Reflection Index, as specified in the Equation (2), has been implemented (see Equation (2) below):
where:
 is the incident reference component of the free-field impulse response at the k-th measurement point (microphone);
 is the reflected component of the impulse response taken in front of the sample under test at the k-th measurement point (microphone);
 is the time window (Adrienne shape) for the incident reference component of the free-field impulse response at the k-th measurement point (microphone);
 is the time window (Adrienne shape) for the reflected component at the k-th measurement point (microphone);
 is the symbol of the Fourier transform;
 is the index of the one-third octave frequency bands (between 100 Hz and 5 kHz);
 is the width of the j-th one-third octave frequency band;
k is the microphone number according to Figure 5 ;
;
nj is the number of microphone positions on which to average .
.
Cgeo,k is a correction factor used to compensate the geometrical divergence at the k-th measurement point and takes into account the path difference from the direct and reflected waves; (as previously mentioned, in the ADRIENNE Equation (1) this physical aspect was tackled using the “t” factor):
The correction factors for geometrical divergence, Cgeo,k, are given by:
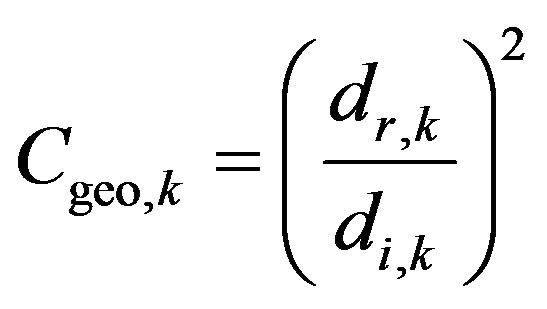 (3)
(3)
where:
 is the distance from the front panel of the loudspeaker to the k-th measurement point;
 is the distance from the front panel of the loudspeaker to the source and microphone reference plane and back to the k-th measurement point following specular reflection;
k is the microphone number according to Figure 5 .
.
 is a correction factor used to compensate the difference of sound source directivity, at the k-th measurement point, due to different incidence angles of direct and reflected waves on the microphones; it should be noted that this correction is not directly related to the directivity of any particular sound source, like that investigated in [11]. This correction factor is defined in Equation (4).
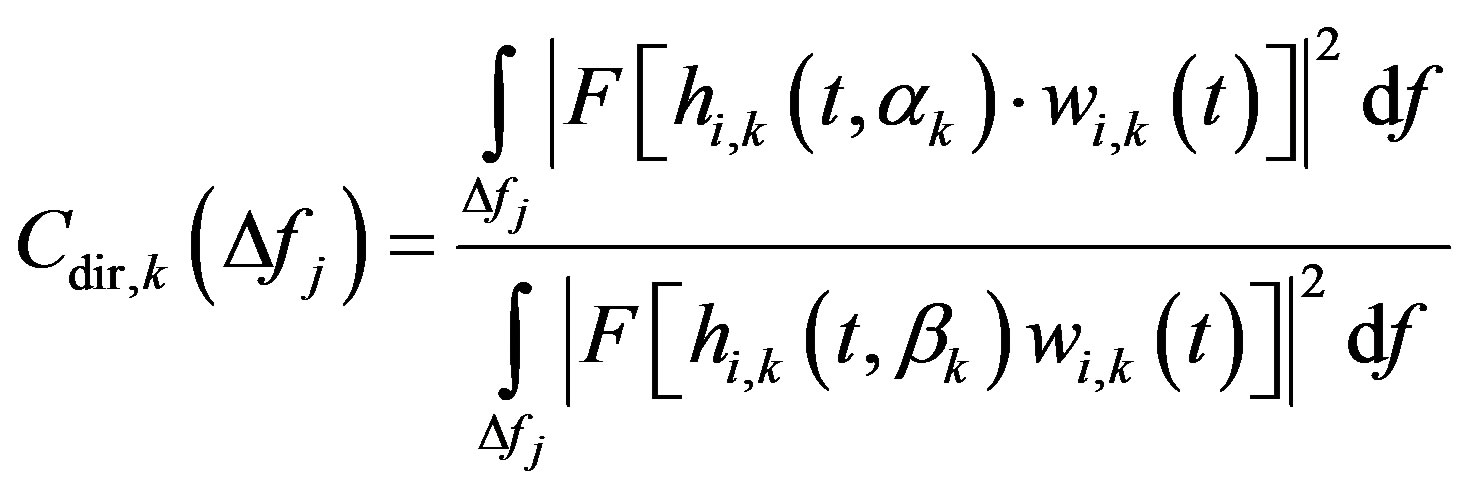 (4)
(4)
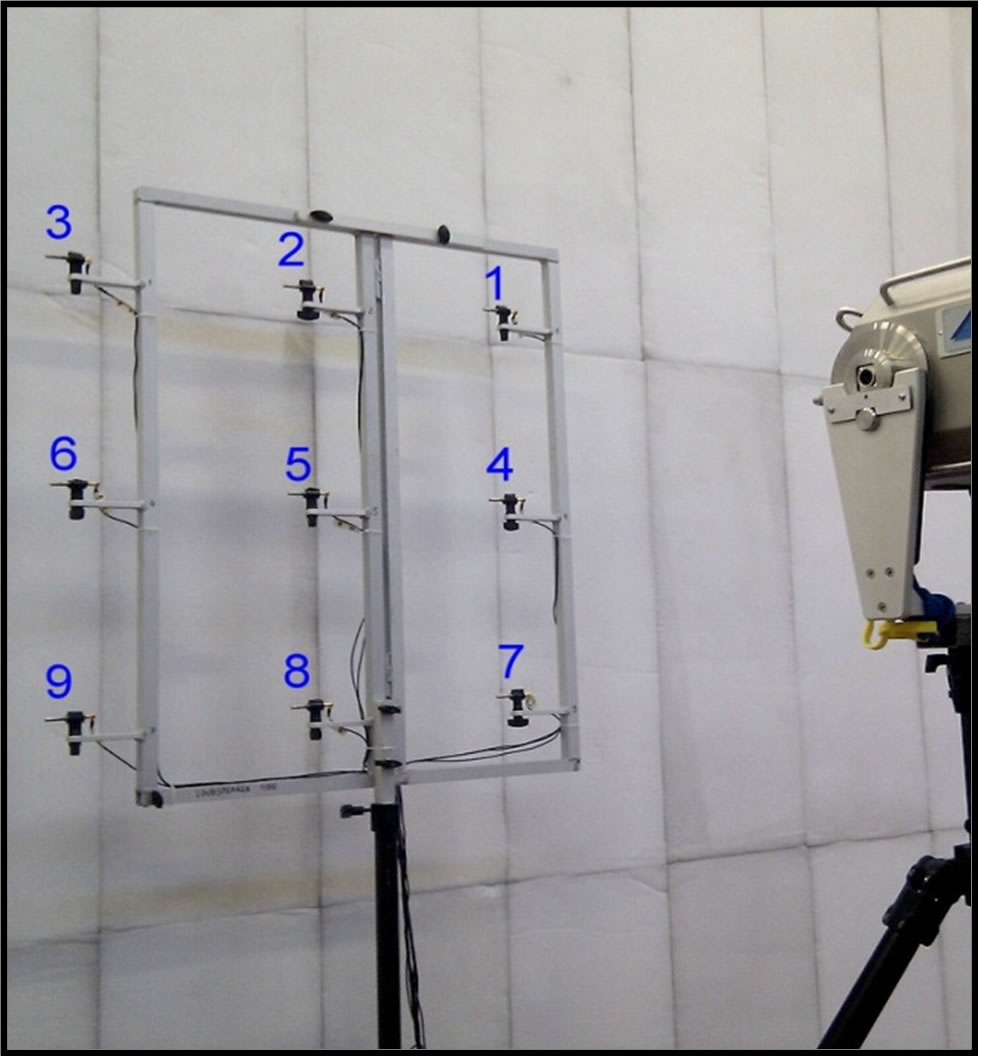
Figure 5. Microphone grid and sound source ready for a measurement in front of an absorptive surface.
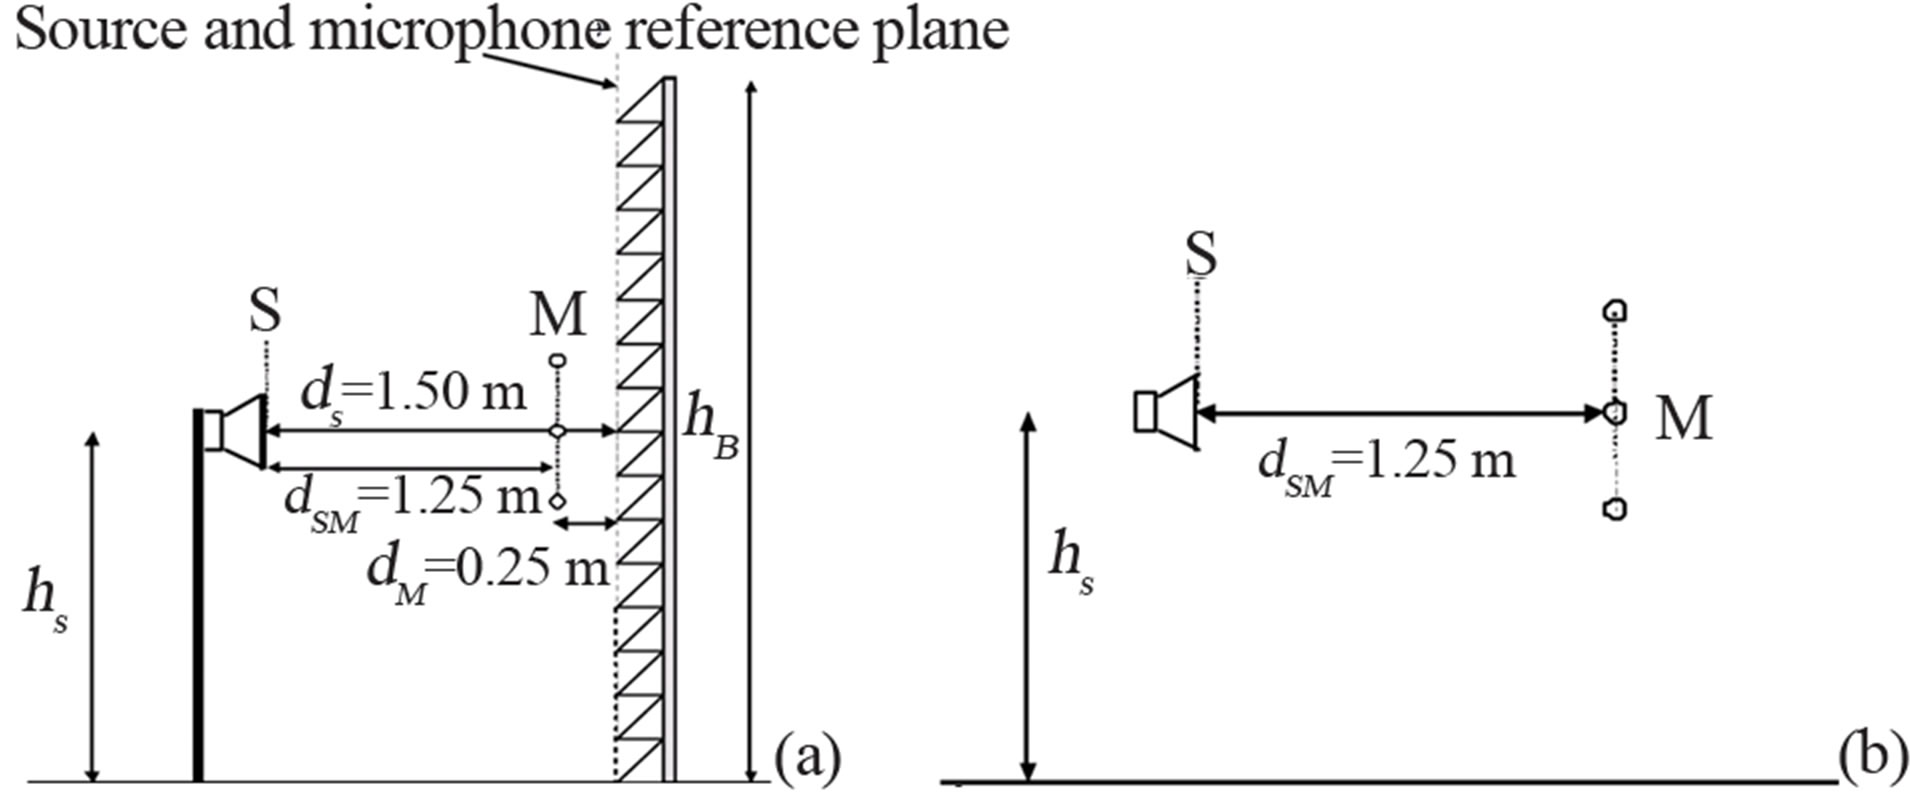
Figure 6. Sketch of the equipment setup for the Reflection Index measurement according to the QUIESST procedure. (a) Measurement in front of the noise barrier; (b) Free-field measurement.
where:
 is the angle between the line connecting the centre of the front panel of the loudspeaker to microphone 5 and the line connecting the centre of the front panel of the loudspeaker to microphone k (see Figure 7(b));
 is the angle between the line connecting the centre of the front panel of the loudspeaker to microphone 5 and the line connecting the centre of the front panel of the loudspeaker to the specular reflection path to microphone k (see Figure 7(b));
 is the incident reference component of the free-field impulse response at the k-th measurement point;
 is the incident reference component of the free-field impulse response at a point on the specular reflection path for microphone k and at distance
  from the centre of the front panel of the loudspeaker;
 is the time window (Adrienne temporal window) for the incident reference component of the free-field impulse response at the k-th measurement point;
F is the symbol of the Fourier transform;
j is the index of the one-third octave frequency bands (between 100 Hz and 5 kHz);
 is the width of the j-th one-third octave frequency band;
k is the microphone number according to Figure 5 .
.
It is worth noting that the sound source directivity correction factors must be measured only once for each sound source, assuming that the source directivity patterns don’t change. For the sake of accuracy they may be measured again from time to time (e.g. once a year).
An example of directivity correction factors is shown in Figure 7(a).
A detailed study on the impact of the sound source directivity on the measured data (without the application of the correction factor) can be found in [11]. Figure 7(a) shows the correction factor, for each microphone of the grid, computed by the authors for the sound source used in the measurements shown hereinafter.
 is a correction factor used to compensate a gain mismatch (if any) of the amplification settings between the “free-field” and “in front of barrier” measurement configurations or vice versa.
This coefficient can also be used as a validation criterion to reveal a displacement of the relative distance between the sound source and the microphone grid. It is computed as amplitude ratio of the spectra of reflected and free-field impulse responses anechoic parts.
The low frequency resolution of the measurement has been improved with the following choices of the Adrienne analysis window:
• a total length of 7.9 ms is used to process the impulse responses coming from microphones 1 to 6 (first and second row from top, excluding the third and lowest row); the RI values obtained over the six microphones must be averaged to get the final RI values in the one-third frequency bands having centre frequency 100 Hz, 125 Hz and 160 Hz;
• a total length of 6.0 ms is used to process the impulse responses coming from microphones 1 to 9; the RI values obtained over the nine microphones must be averaged to get the final RI values in the one-third frequency bands having centre frequency from 200 Hz to 5 kHz.
These specifications, applied to a measurement when the noise barrier has a height of at least 4 m, are sufficient to exclude the ground reflections from the analysis window used to select the impulse response component reflected on the device under test. When the device under test has an height less than 4 m, the results will not be valid on the full frequency range and the Adrienne temporal window must have a reduced length in order to exclude ground reflections from the reflected component of the impulse responses; different window lengths for microphones 1 to 3, microphones 4 to 6 and microphones 1 to 9 may be used.
The QUIESST procedure needs an improved signal subtraction technique to obtain optimal results. In fact, the signal subtraction technique requires the loudspeaker
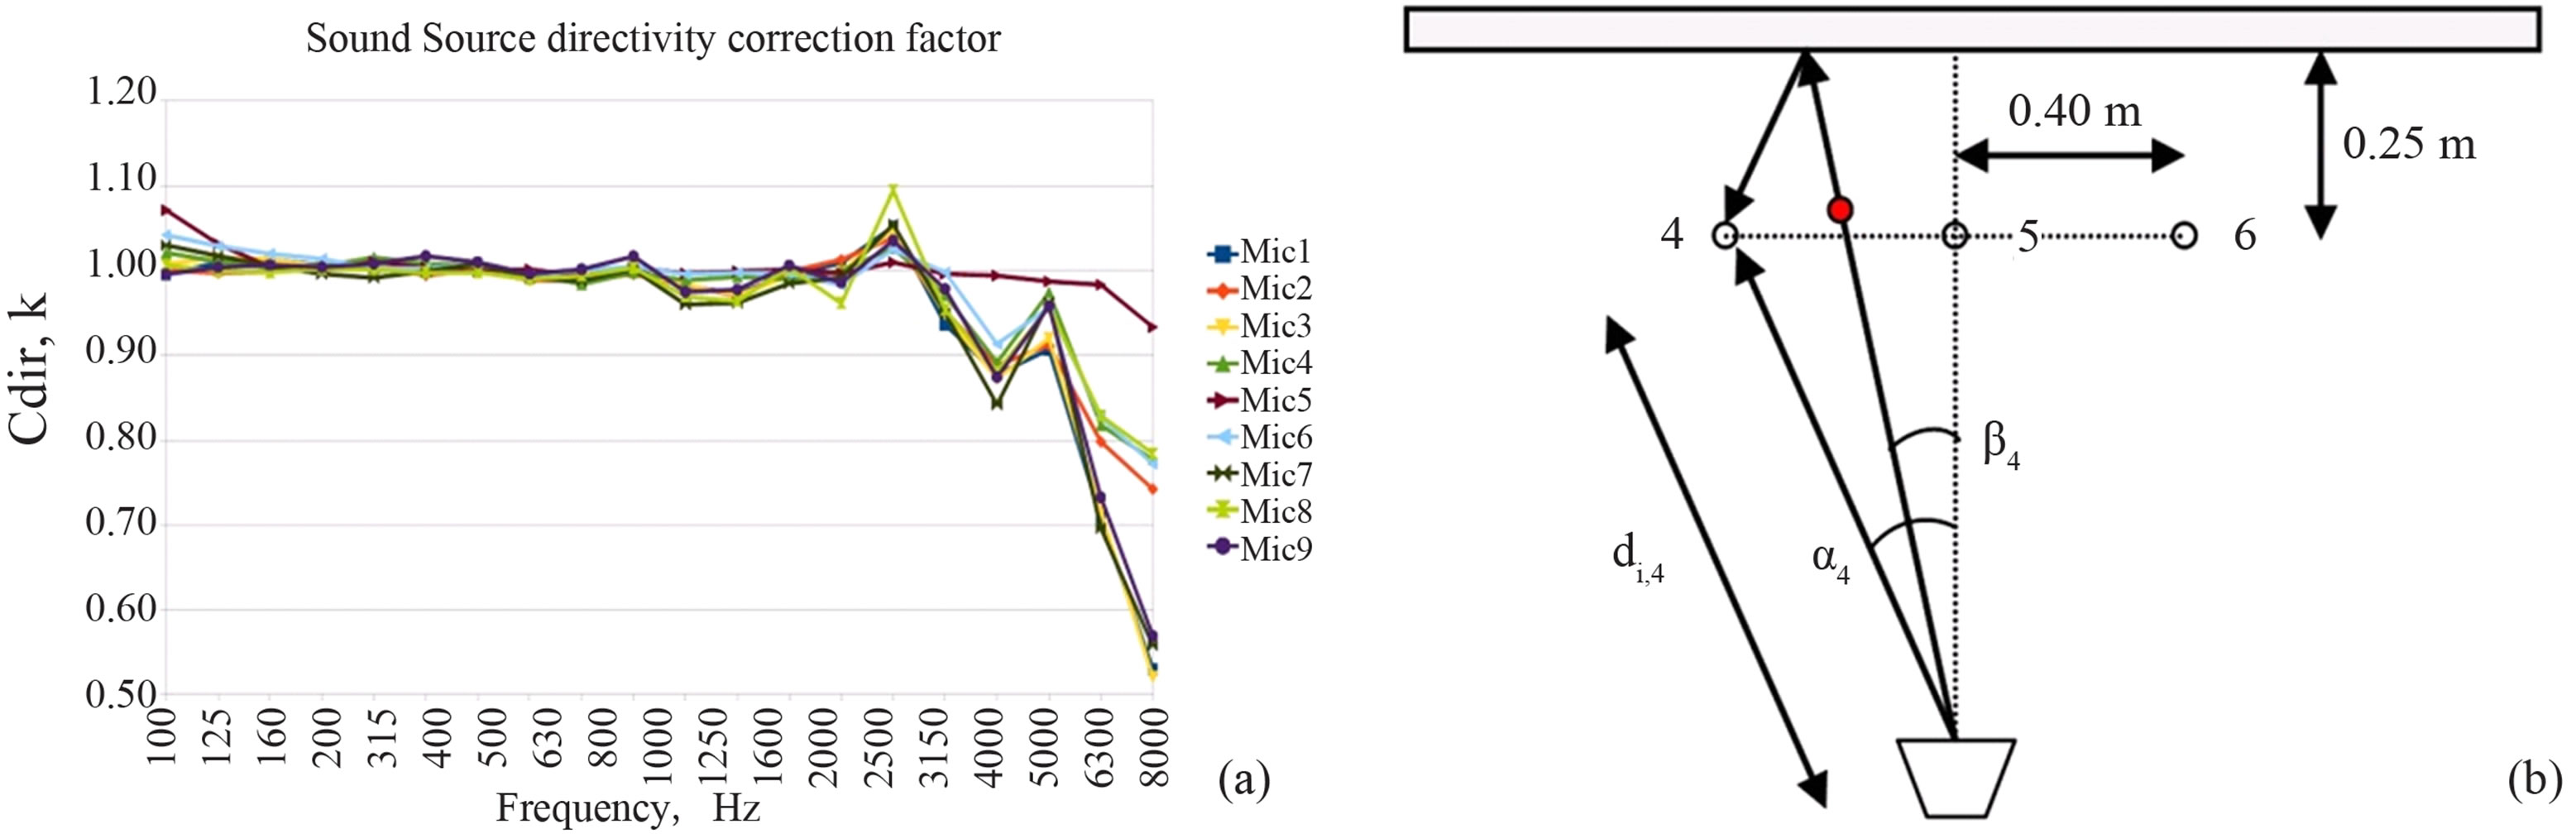
Figure 7. Correction factors for the sound source directivity. (a) Example of correction factors for a Zircon© loudspeaker and the 9 microphones on the QUIESST measurement array; (b) Sketch showing microphone positions 4, 5, and 6 (white circles), the angles α4 and β4 for microphone 4 and the point, at a distance di,4 from the loudspeaker centre plate, where measurements to get the correction factor Cdir,4 are done (red circle).
and microphones relative position be kept constant in order to get a perfect alignment between the impulse responses measured in front of the device under test and in the free field for each microphone. This may be very difficult when on site, as now the microphone grid is not physically connected to the sound source, due to placement of the equipment on an irregular terrain, small movements of the loudspeaker cone or the microphones when displacing the equipment, variations in the response of the measuring equipment due to temperature or electrical deviations occurring between the free field and the reflected measurements, etc. Therefore it is necessary that, before performing the signal subtraction, the freefield signal is corrected for a small shift relative to the impulse response in front of the device under test, at each microphone. Since in general the actual time shift is not equal to a multiple of the sampling interval , fixed by the measurement sample rate, step wise shifting of one or more data points is inadequate.
An accurate alignment can be done as follows [10,12]; it allows the placement of the microphone array without a rigid connection to the loudspeaker; the unavoidable misalignments between the impulse responses measured in front of the device under test and in the free field for the same microphone may be compensated until then they are ≤5 cm.
1) For each microphone position, an impulse response measured in front of the device under test and one measured in the free field with nominally the same geometry are compared.
2) The free field impulse response is repeatedly shifted with a small “moving step”  (which is a fraction of the sampling interval
 , see below).
3) The sum of the squared differences between the free field impulse response and the impulse response measured in front of the device under test is calculated in a limited interval around the first and main peak of the impulse response measured in front of the device under test.
4) The operations in 2 and 3 are repeated until the minimum of the sum in 3 is found (least squares); the number n of moving steps  needed to get this least square minimum is recorded.
5) The free field impulse response is finally shifted using the temporal step  found in 4 and its amplitude is adjusted so that the amplitude of its first (and main) peak is exactly the same of the first (and main) peak of the impulse response measured in front of the device under test.
6) The shifted and amplitude adjusted free field impulse response is subtracted from the impulse response measured in front of the device under test.
The shifted and amplitude adjusted free field impulse response used in step 6 above is discarded after the subtraction; the free field impulse response used to calculate the reflection index according to Equation (2) is the original, unchanged one.
In order to shift the free field impulse response in n moving steps,  , with
  considerably smaller than the sampling interval
  between the discrete points of the acquired data, the following procedure is applied.
a) The free field impulse response is Fourier transformed in the frequency domain and its phase is changed by multiplying it with a frequency dependent factor .
.
b) The resulting phase corrected Fourier transform is inverse transformed to generate the shifted free field impulse response in the time domain which then can be used for signal subtraction.
Figure 8 gives an example of this improved signal subtraction method.
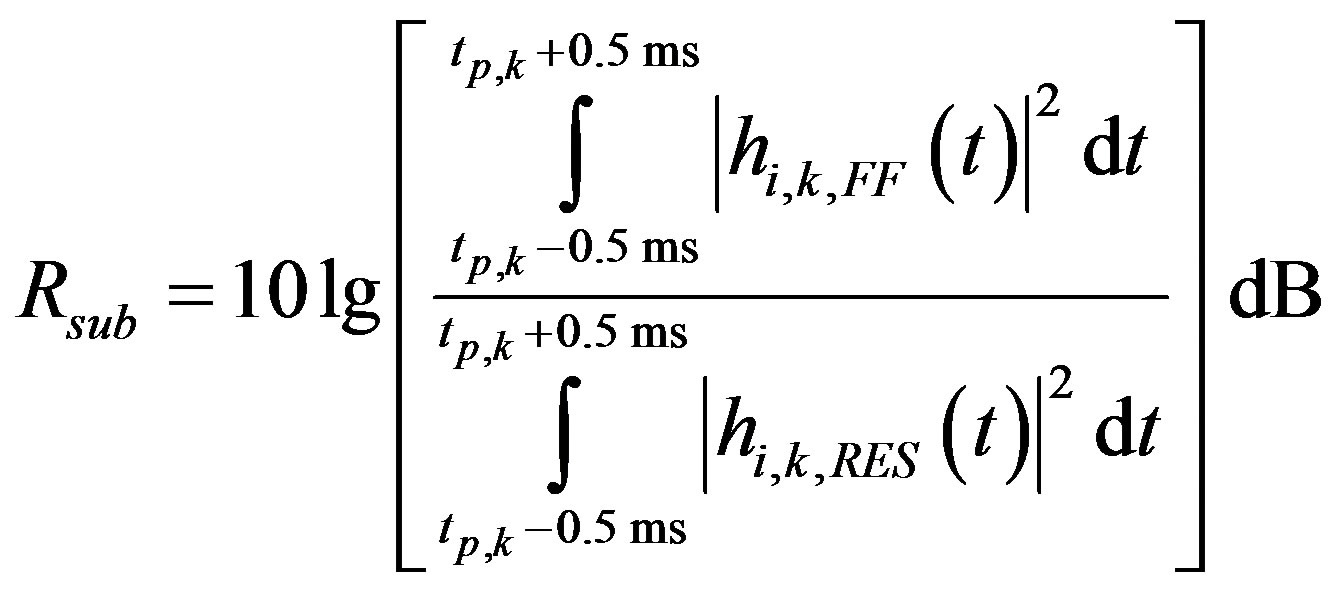
In the QUIESST procedure a validation criterion on the results has been introduced. As the goal of the operation is to remove the incident component of the impulse response (the “direct sound”), leaving only the reflected one, the signal subtraction effectiveness can be measured by the decibel level reduction in the direct sound from the measurement to the result. Specifically, following Robinson and Xiang [14], the sum of the energy within 0.5 ms of either side of the first and main peak of direct sound can be compared before and after subtraction to find the effective reduction. This defines the reduction factor Rsub:
 (5)
(5)
where:
 is the incident reference component of the free-field impulse response at the k-th measurement point before the signal subtraction;
 is the residual incident reference component of the impulse response taken in front of the sample under test at the k-th measurement point after the signal subtraction;
 is the time instant where the first peak of the incident component of the impulse response at the k-th measurement point is located, before the signal subtraction (Figures 8(b) and (d)).
A reduction factor Rsub equal to the peak to noise ratio of the measurement can be considered a complete subtraction, since this would leave nothing in the area of the direct sound except the background noise.
Two case studies of Reflection Index measurements and corresponding Reduction Factors are shown in Figures 9 and 10. The case study 1 is a strongly non flat, absorptive, metallic, noise barrier. The peculiar shape of the barrier surface required 12 different microphone grid positions according to the QUIESST procedure, but in this example only one is used. Figure 9(a) shows the Reflection Index measured at one of the 12 measurement positions. Figure 9(b) shows the Reduction Factor values for each microphone of the grid. The range of values of Rsub spans from a maximum of about 20 dB (microphone 3) to a minimum of about 6 dB (microphone 8). In Figure 9 also the impulse response taken in front of the barrier and including the reflected wave, before (c) and after (d) the signal subtraction operation, is shown (from microphone 8 data, worst case in this measurement). It can be noted that the signal subtraction is not optimal since some “garbage” is clearly visible around the time instant tp,k; this is confirmed by the low value of Reduction Factor (around 6 dB). The case study 2 is a non flat, absorptive, concrete noise barrier. The shape of this barrier surface required 3 microphone grid positions according to the QUIESST procedure, but in this example only one is used. Figure 10(a) shows the Reflection Index measured in one of the 3 measurement positions. Figure 10(b) shows the Reduction Factors values for each microphone of the grid. The range of values spans from a maximum of about 27 dB (microphone 1) to a minimum of about 16 dB (microphone 8). Figure 10 also shows the impulse response taken in front of the barrier and including the reflected wave, before (c) and after (d) the signal subtraction operation, (from microphone 1 data, best case in this measurement).
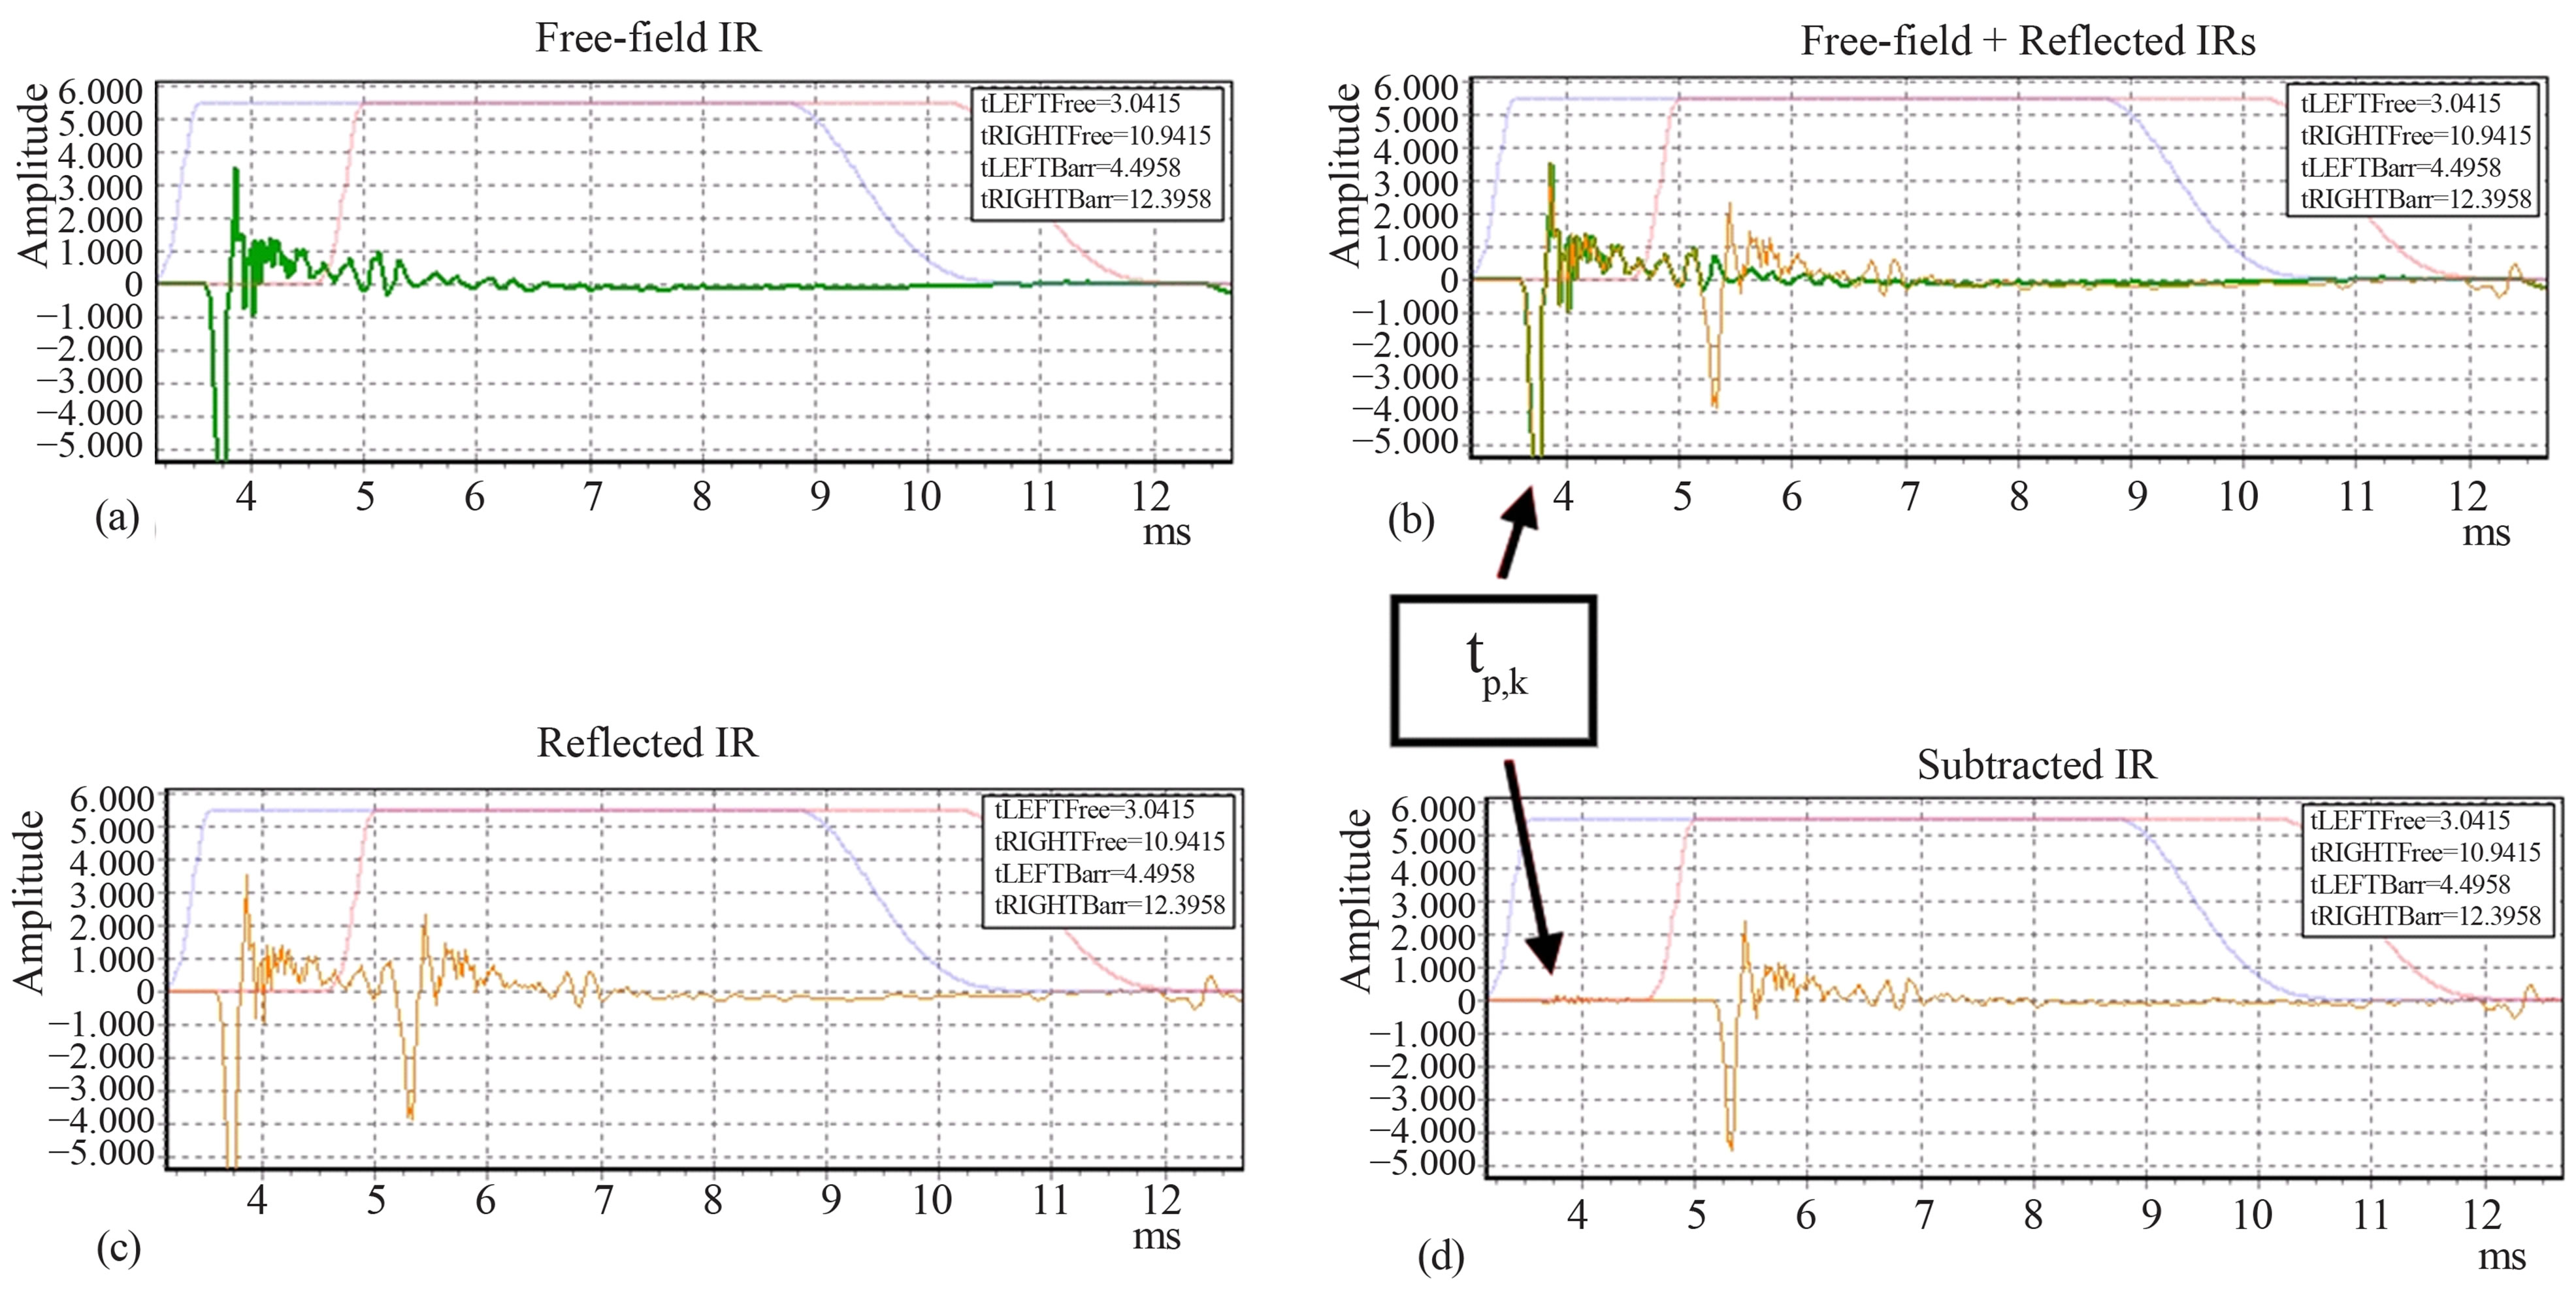
Figure 8. Example improved signal subtraction method. (a) Free-field impulse response; (b) Free-field I.R. overlapped to reflected I.R. a misalignment can be seen; (c) Reflected I.R. alone; (d) Reflected I.R. after signal subtraction.
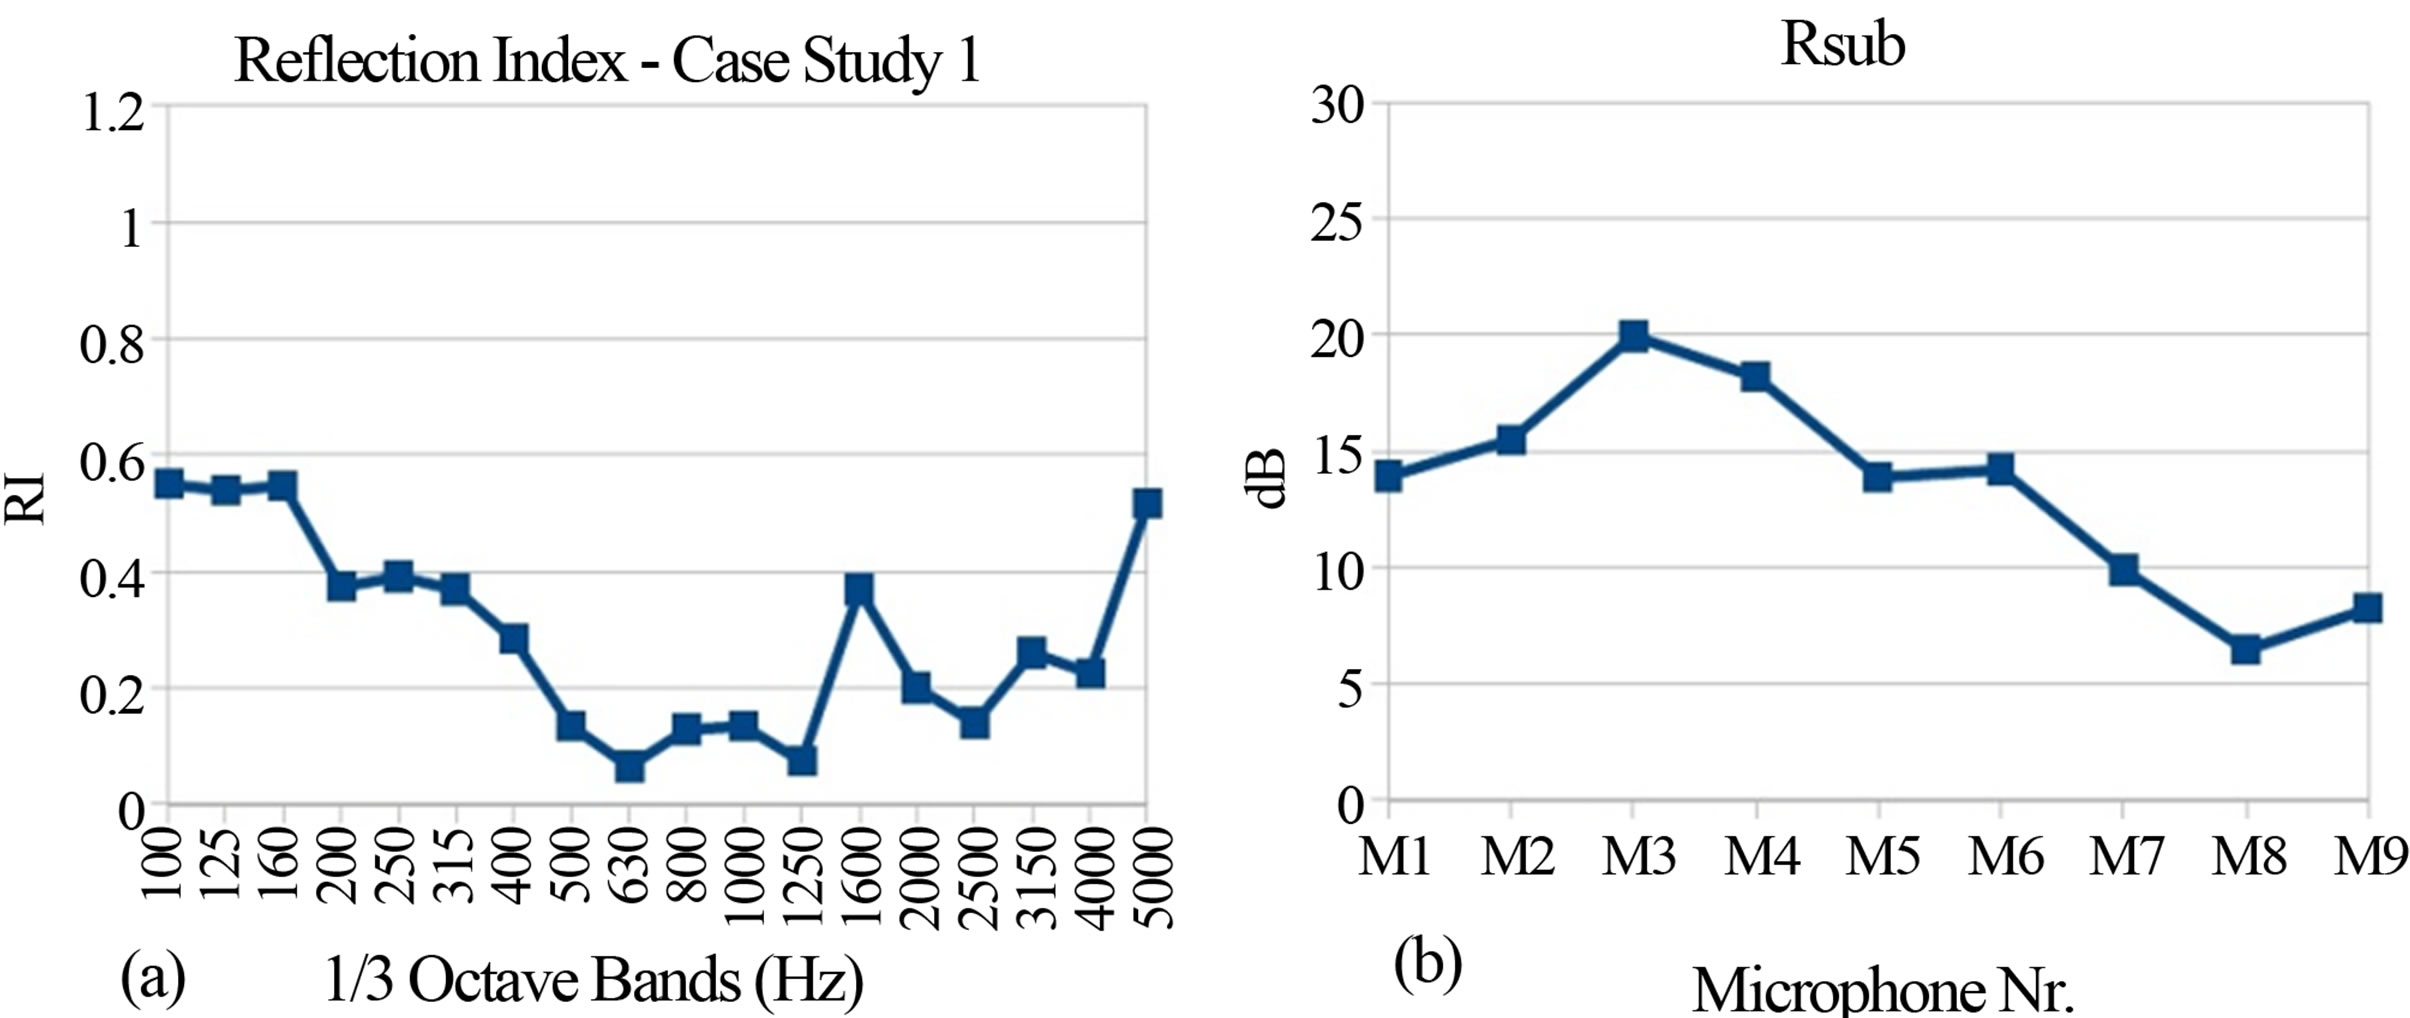
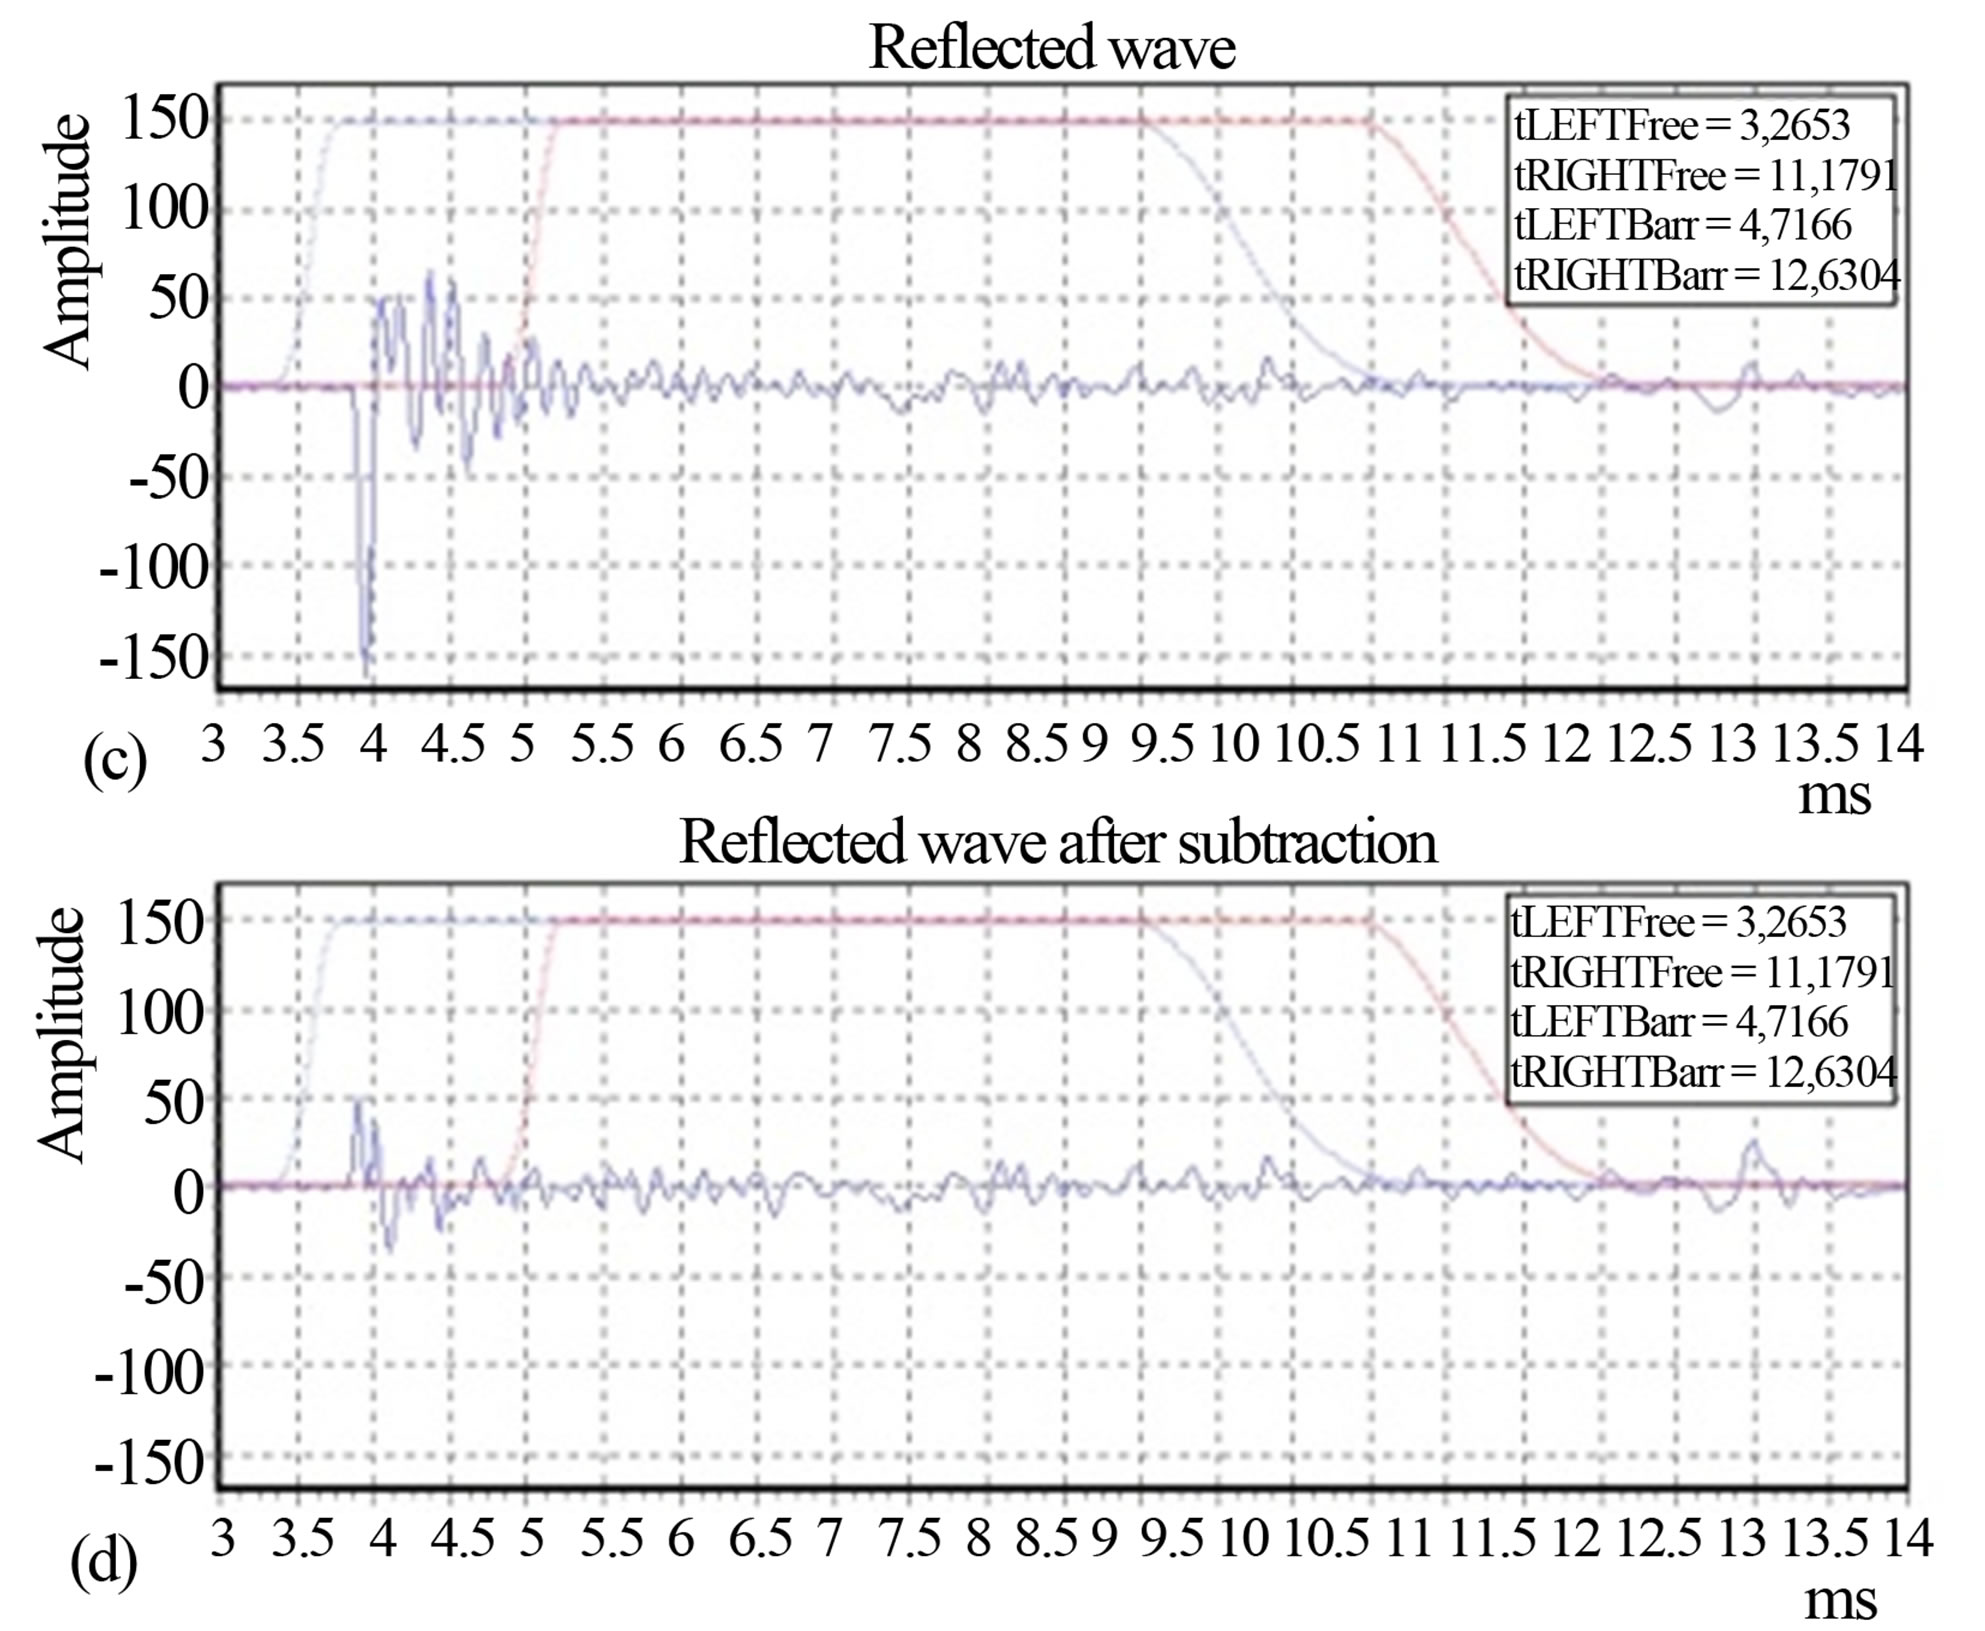
Figure 9. Case study 1: a strongly non flat, absorptive, metallic noise barrier. (a) Reflection Index RI; (b) Rsub; (c) Reflected wave before subtraction (microphone 8); (d) Reflected wave after subtraction (microphone 8).
Here the signal subtraction operation was very good and this result is confirmed by the high value of the corresponding Reduction Factor (around 27 dB).
The described QUIESST measurement method has been verified in a Round Robin Test (RRT) among 8 independent European laboratories on 13 different samples installed on 2 test sites in Grenoble (France) and Valladolid (Spain) [2]. The RRT has been conducted following the procedure for an inter-laboratory test in order to be able to get the repeatability and reproducibility of the method.
It is worth recalling that the repeatability r is the random variation of the measurement result under constant measurement conditions. It can be assessed by compare ing the measurements within each of the 16 measurement sets (8 labs × 2 sites) from a single laboratory on one location. The reproducibility R is the random variation of the measurement result under changed conditions of measurement. It can be assessed by comparing the means of the 16 measurement sets (8 labs × 2 sites) after accounting for differences between the 2 test sites. Indeed, the differences between these means reveal differences between laboratories, and random variation due to setting up the measurements.
A first investigation on the repeatability of Reflection Index measurements gave excellent results [15].
Figure 11(a) shows a complex, strongly non flat and sound absorbing, sample on the Valladolid test site; Figure 11(b) shows the values of the Reflection Index obtained by the eight laboratories.
Figure 12(a) shows a moderately non flat and sound absorbing sample (wood chips and concrete) on the Grenoble test site; Figure 12(b) shows the values of the Reflection Index obtained by the eight laboratories. In both cases the agreement among the different laboratories may be judged fairly good, considering also that some laboratories did this kind of measurement for the first time, using different equipments, under different weather conditions.
4. The QUIESST Measurement Method for Airborne Sound Insulation
The procedure resulting from the ADRIENNE project and adopted in CEN/TS 1793-5 for measuring the Sound Insulation Index is robust and easily applicable. The QUIESST procedure does not change it noticeably, but adds some improvements. Measurements become multichannel: the same 9-microphone grid and loudspeaker used for the Reflection Index measurement are employed
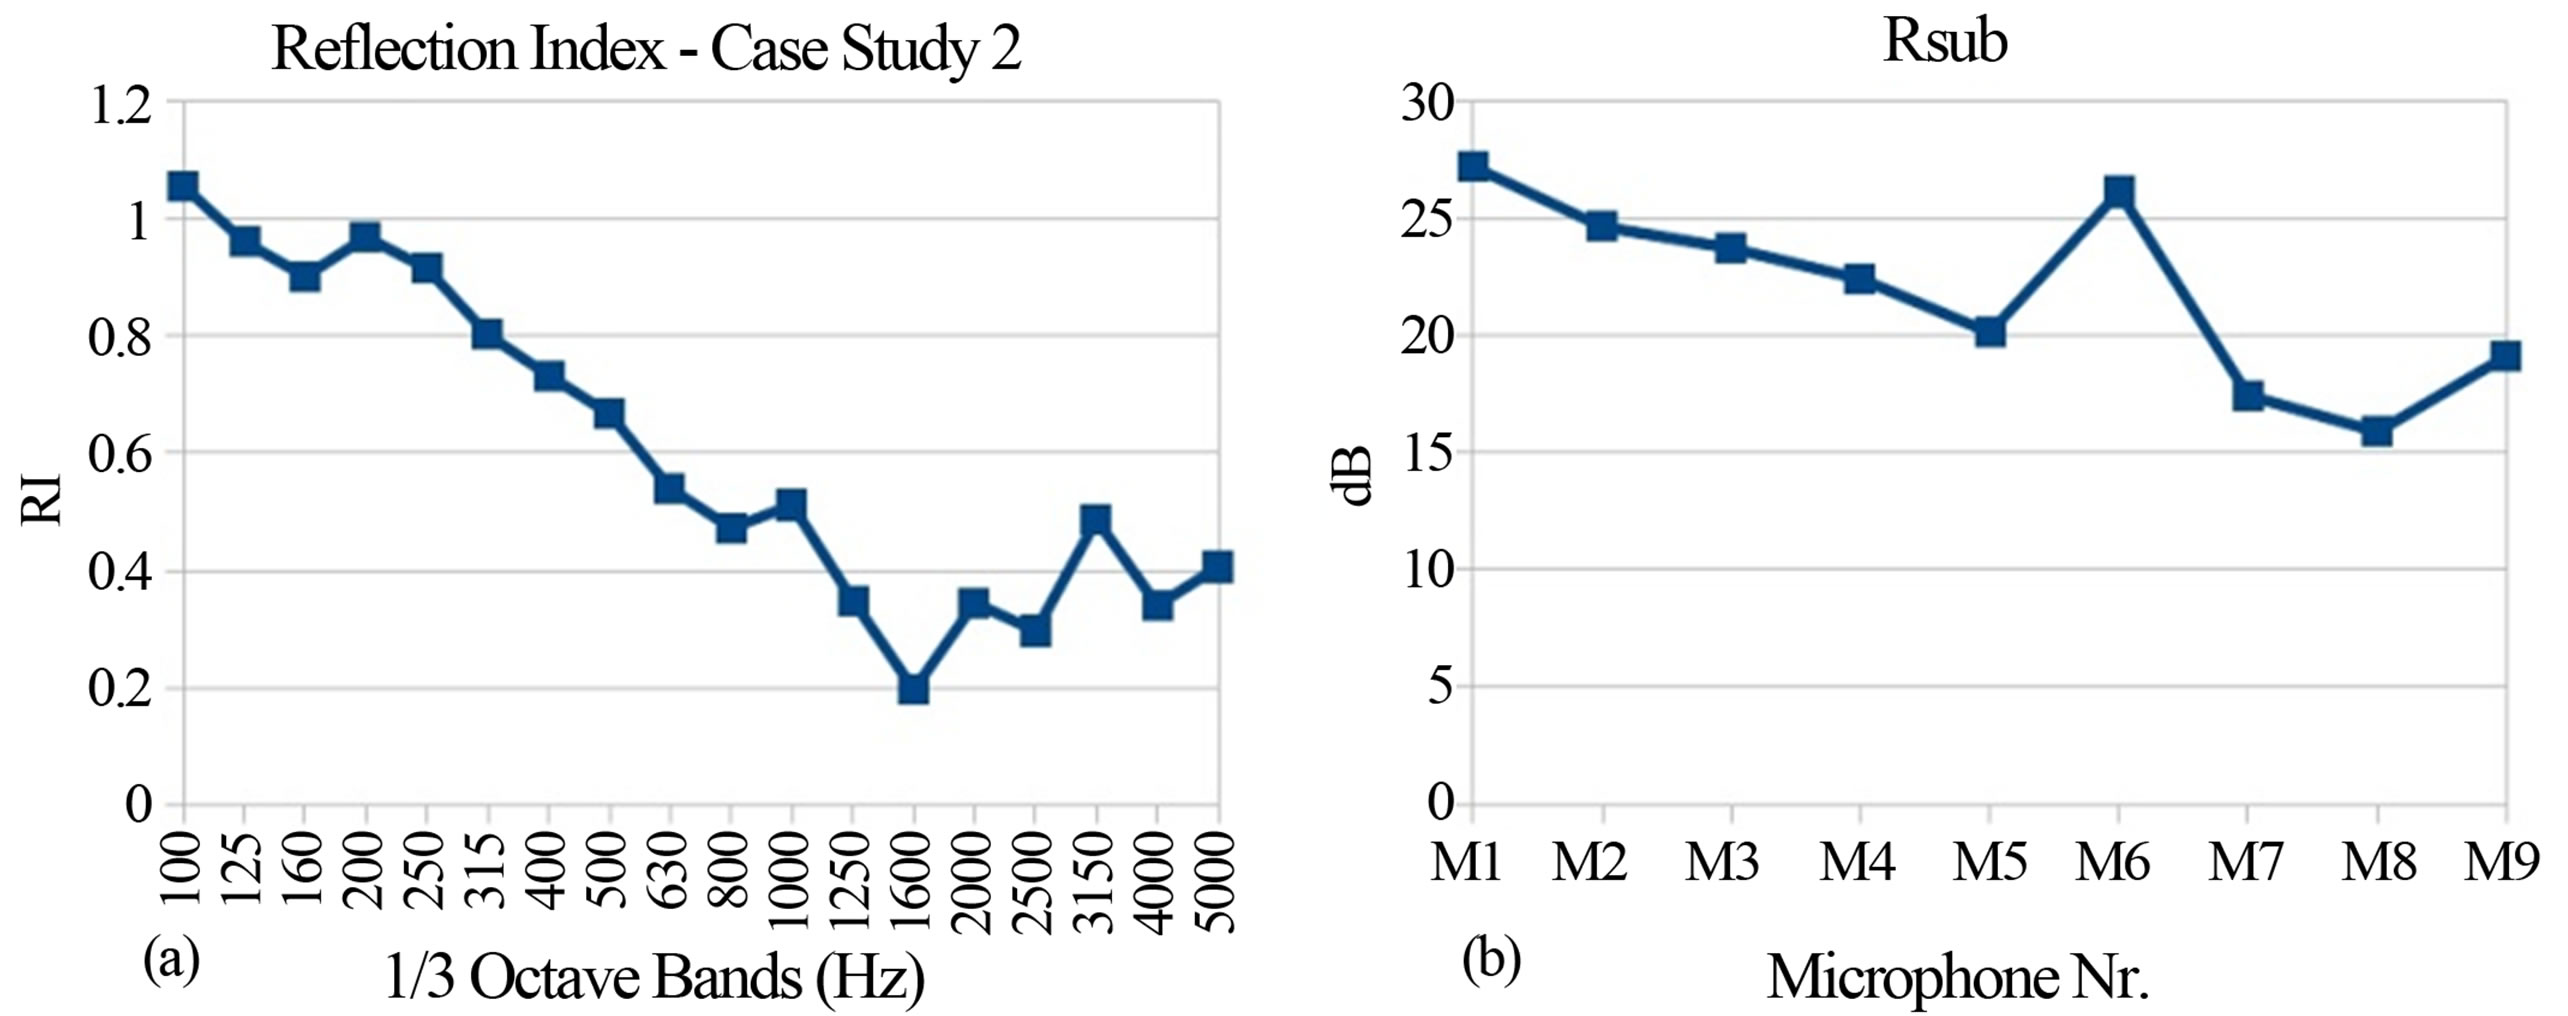
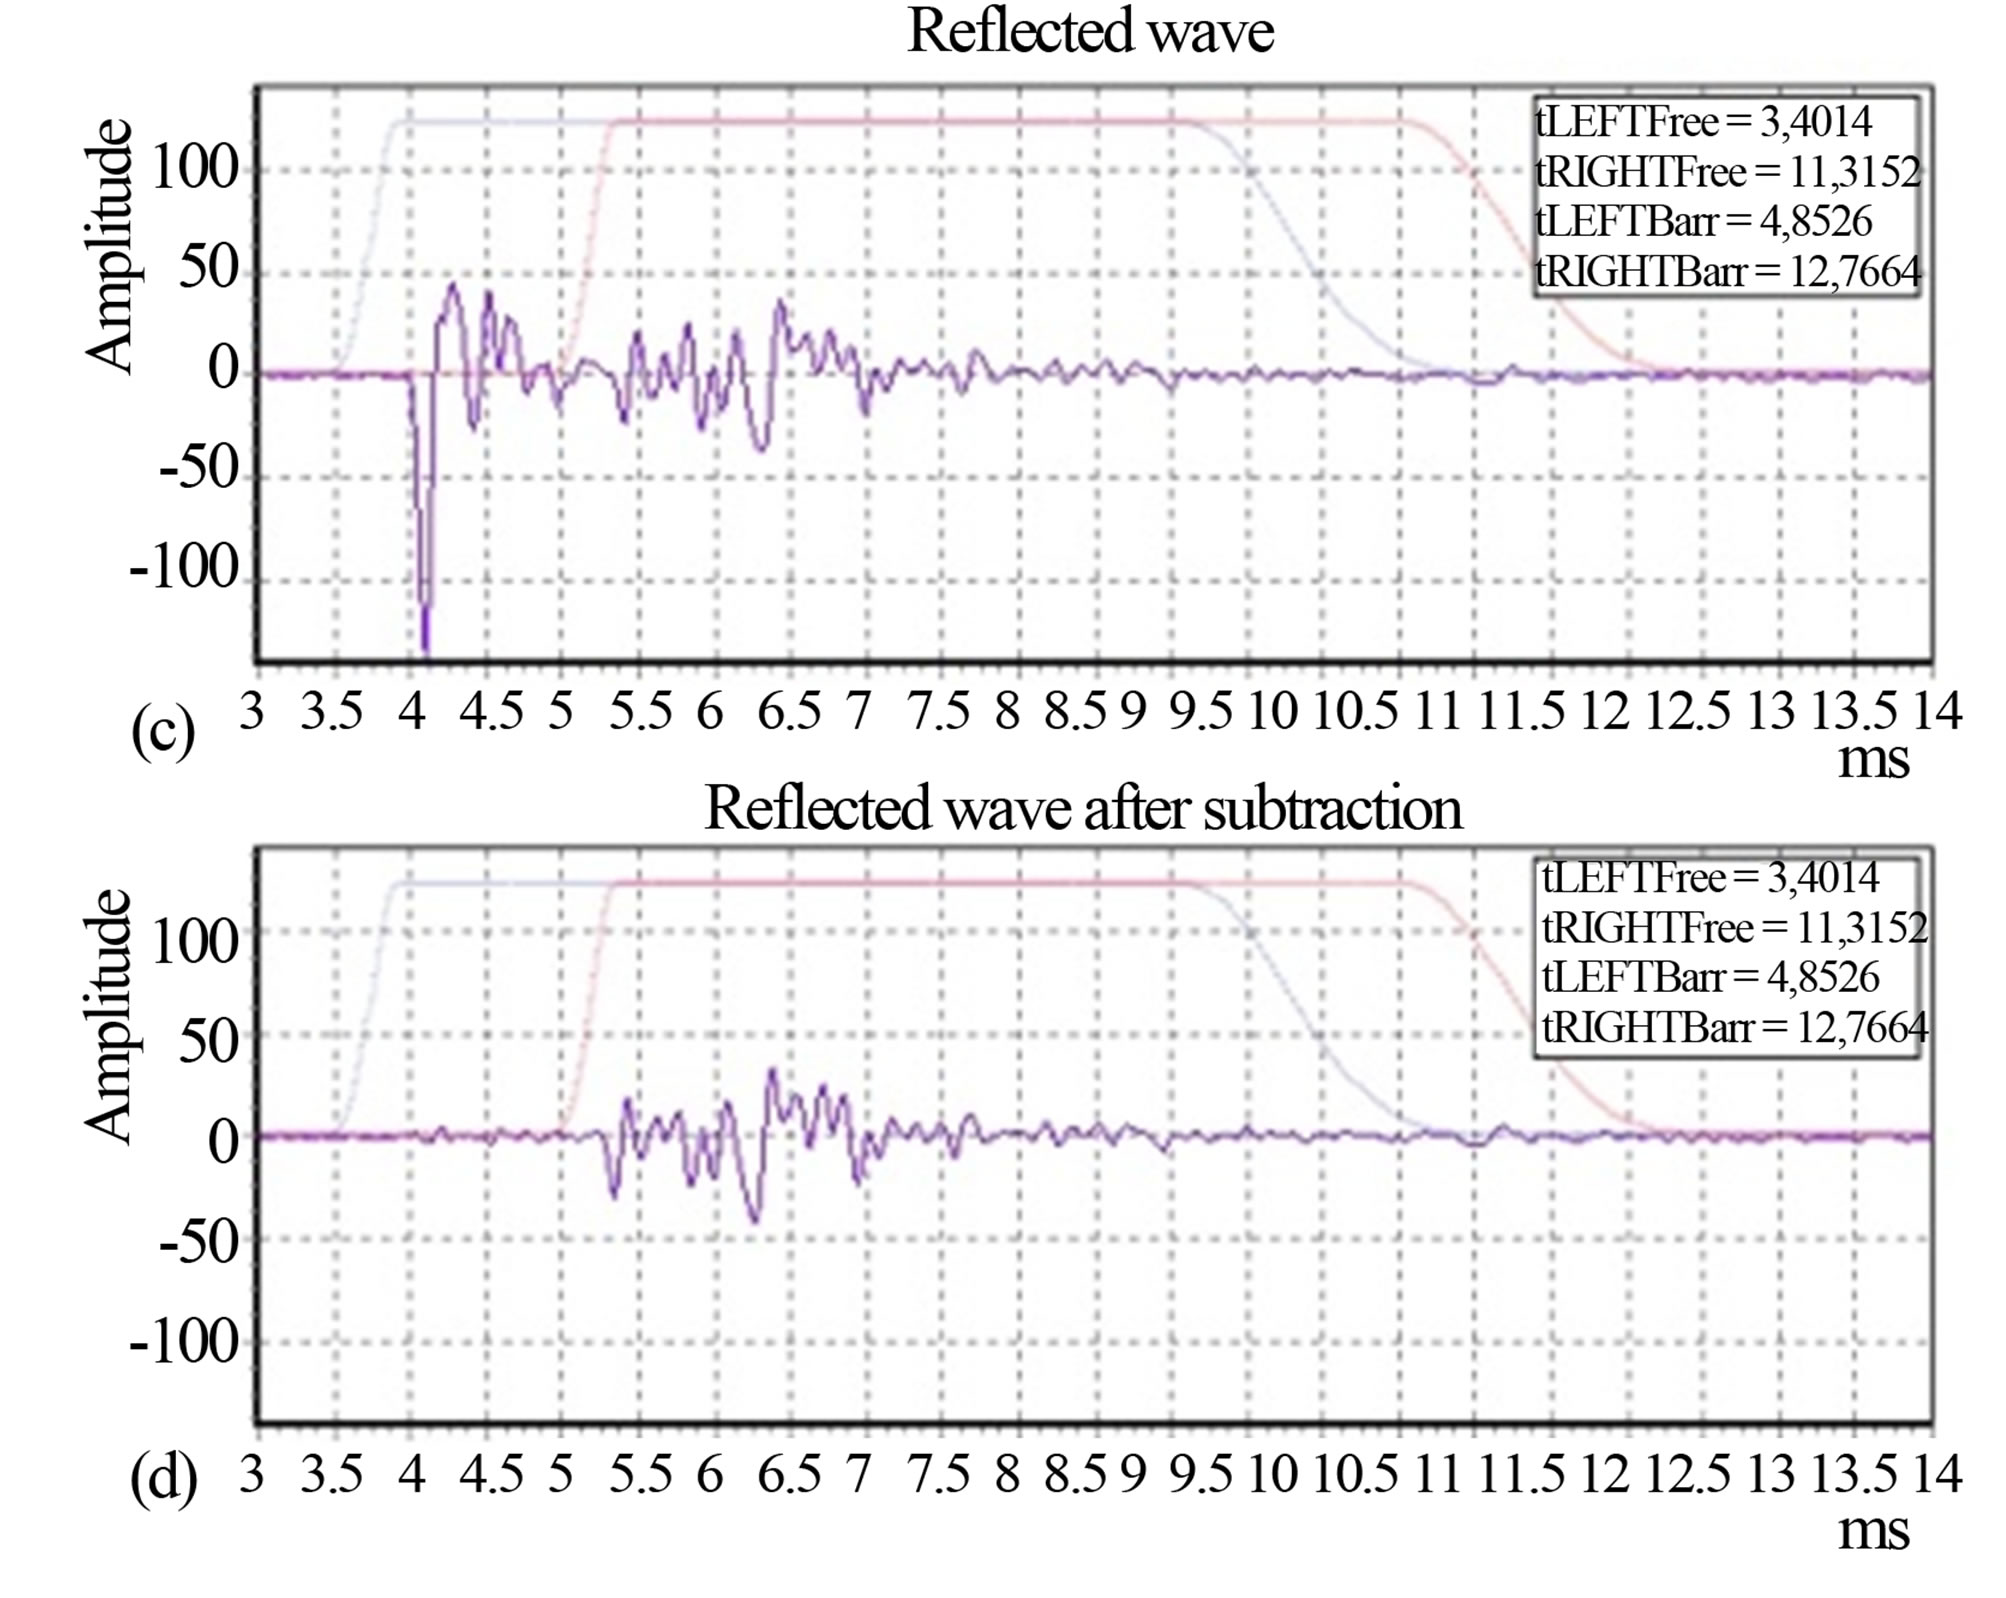
Figure 10. Case study 2: non flat, absorptive, concrete noise barrier. (a) Reflection Index RI; (b) Rsub; (c) Reflected wave before subtraction (microphone 1); (d) Reflected wave after subtraction (microphone 1).
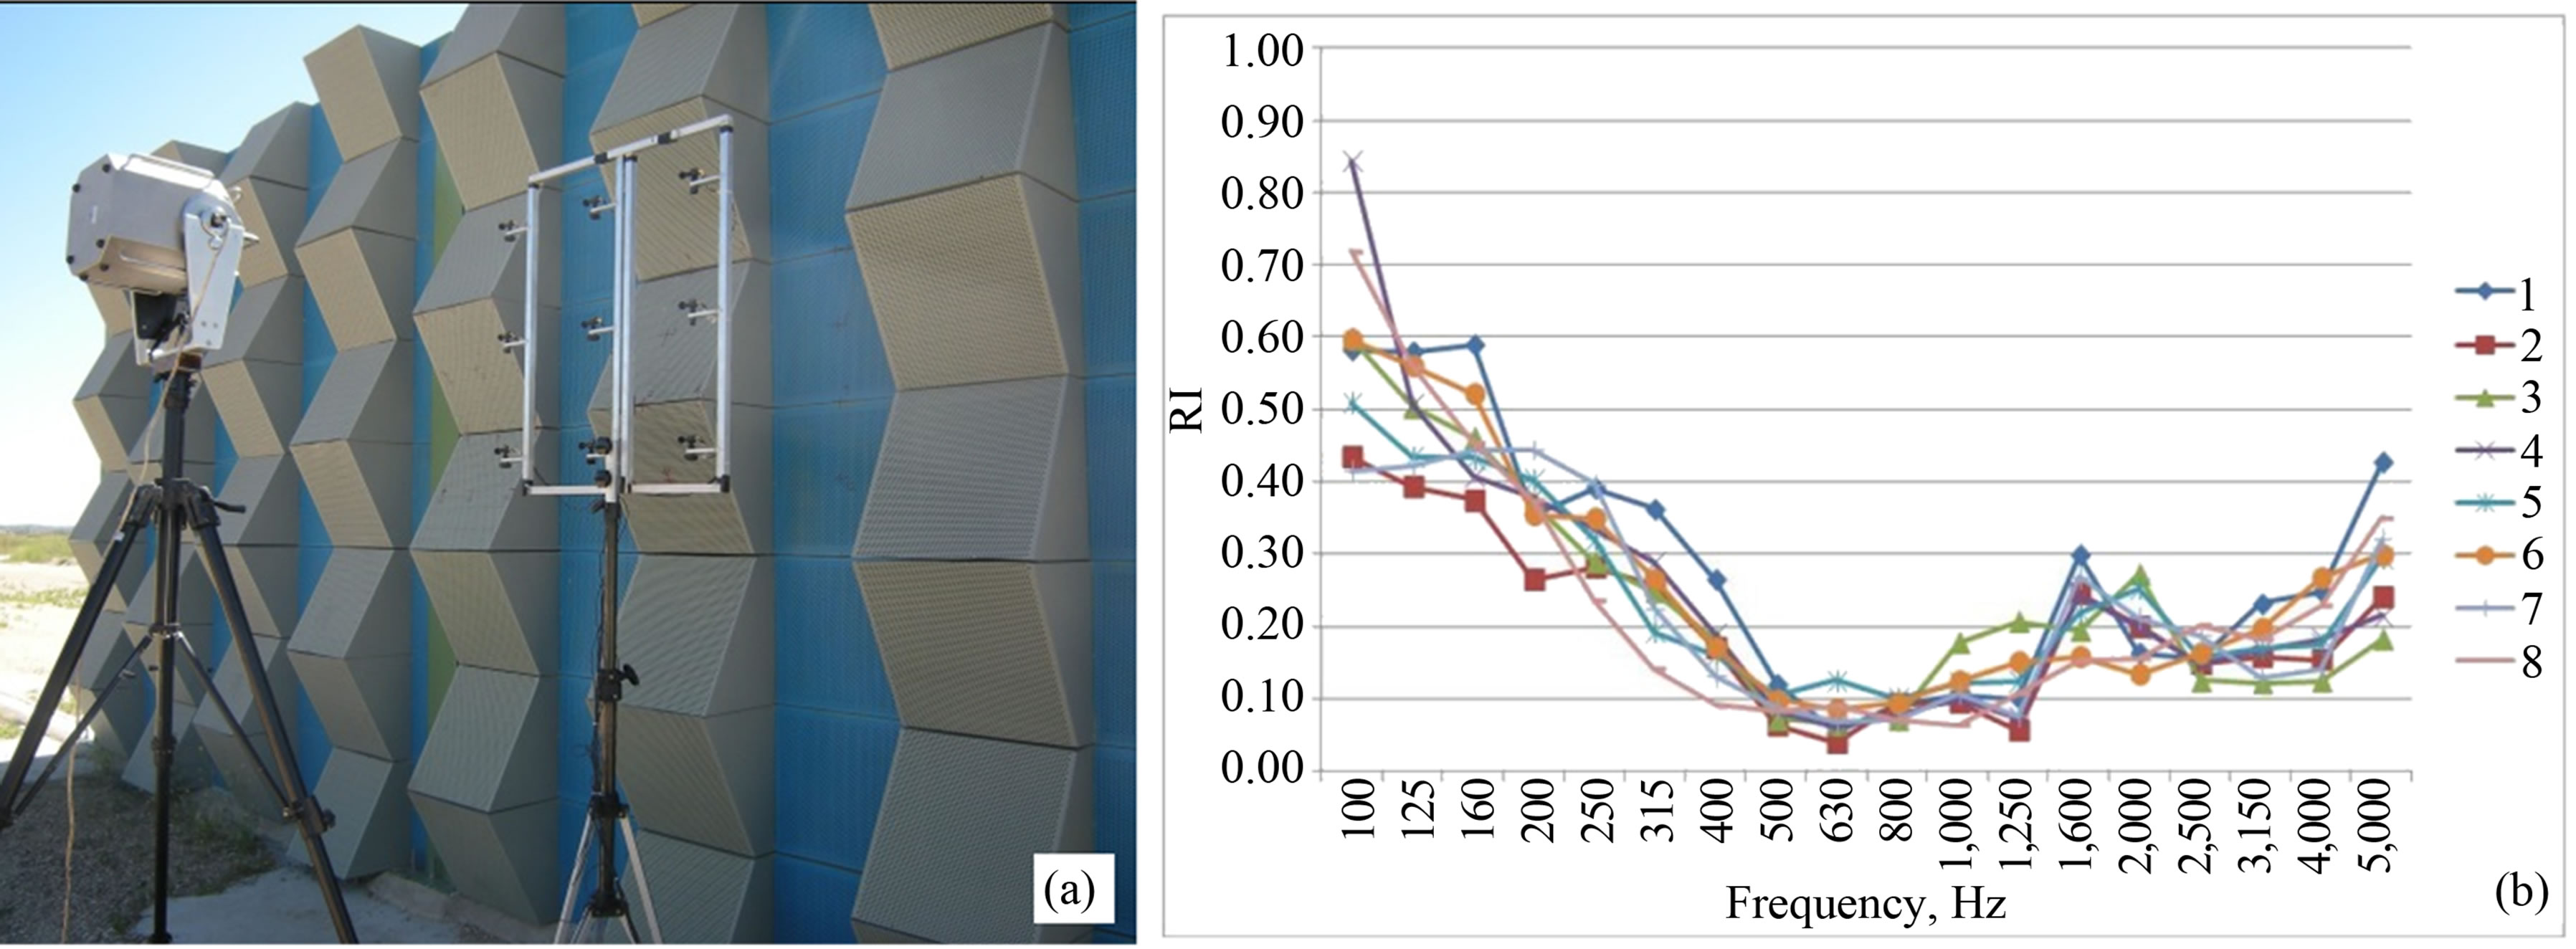
Figure 11. Sample 1 (strongly non flat, sound absorbing) on the Valladolid test site. (a) Measurement setup; (b) Reflection Index values, according to Equation (2), measured by eight independent laboratories.
also for this measurement. For each case, two measurements are done: in the first the microphone grid is placed at a distance of 0.25 m from the noise barrier on the receiver side while the sound source is placed on the opposite side (traffic side) of the noise barrier at a distance of 1 m from the noise barrier; the second measurement is taken placing the microphones grid and the loudspeaker in free-field conditions (away from any obstacles), with same relative distance between them (see Figure 13).
The Sound Insulation Index SI is then computed as:
 (6)
(6)
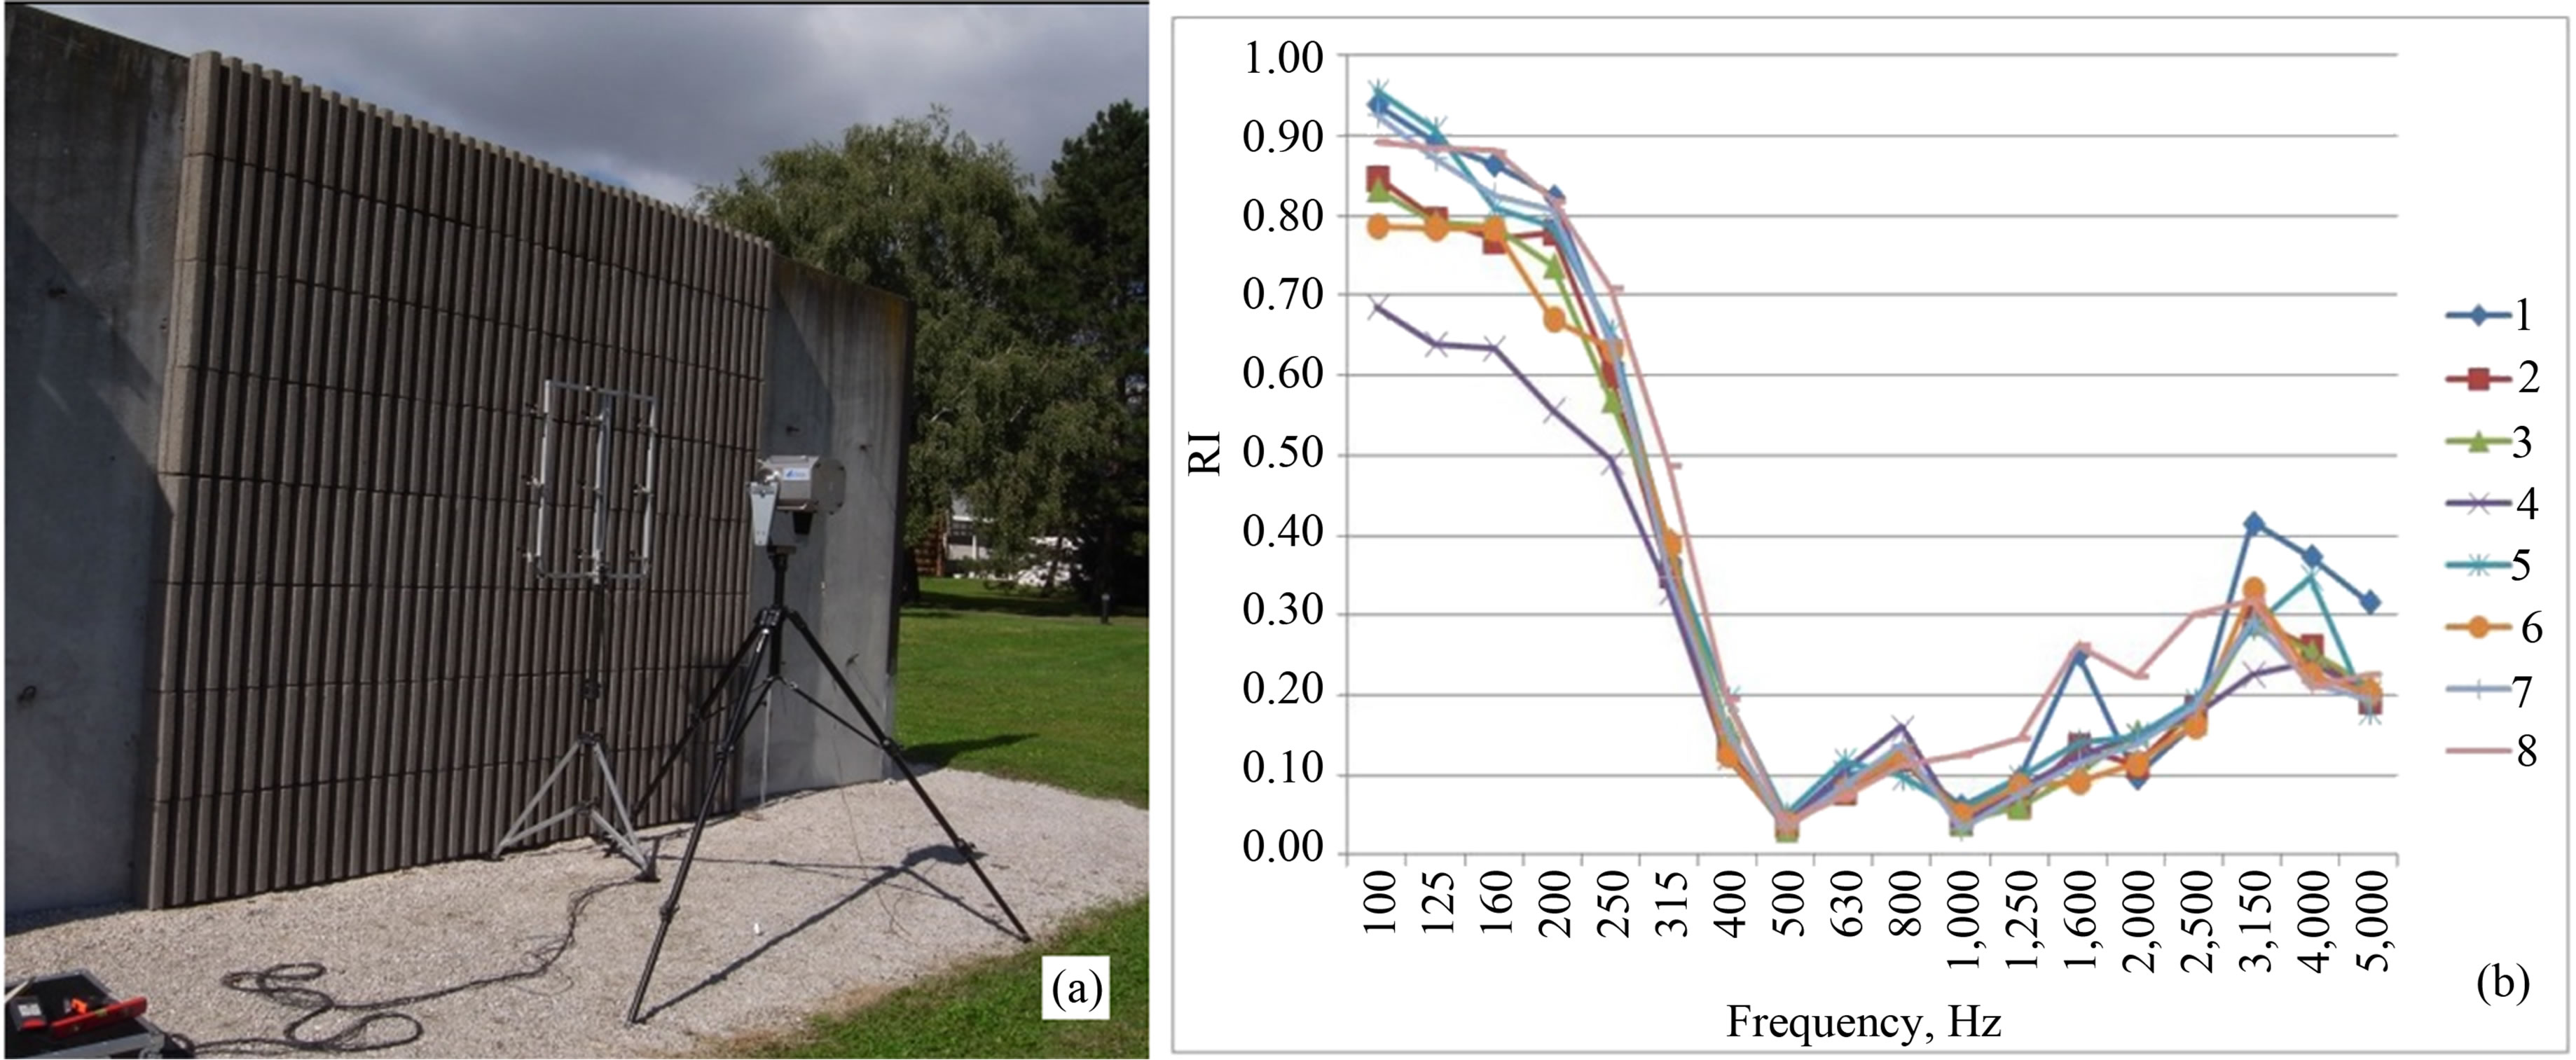
Figure 12. Sample 3 (moderately non flat, sound absorbing) on the Grenoble test site. (a) Measurement setup; (b) Reflection Index values, according to Equation (2), measured by eight independent laboratories.
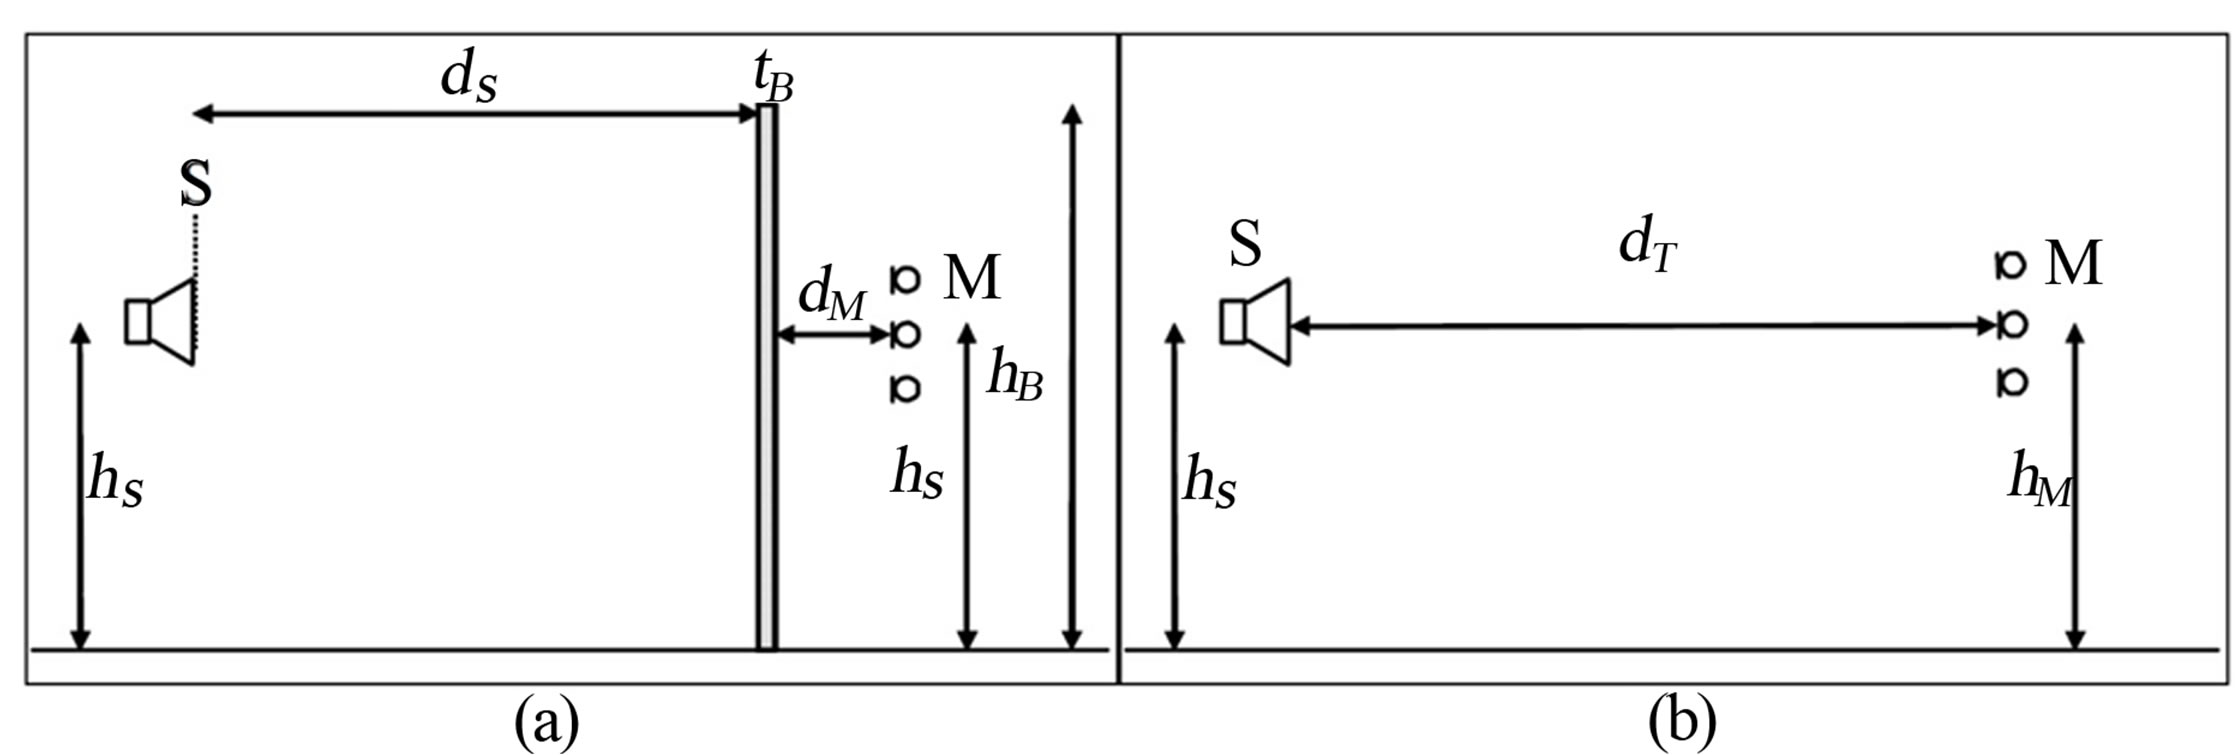
Figure 13. Sketch of the Sound Insulation Index measurement geometry. (a) Measurement across the barrier; (b) Free-field measurement.
where:
 is the incident reference component of the free-field impulse response, measured at the k-th microphone of the grid;
 is the transmitted component of the impulse response, measured at the k-th microphone of the grid;
 is the reference free-field component time window (Adrienne shape) at the k-th microphone of the grid;
 is the time window (Adrienne shape) for the transmitted component at the k-th microphone of the grid;
F is the symbol of the Fourier transform;
j is the index of the j-the one-third octave frequency bands (between 100 Hz and 5 kHz);
 is the width of the j-the one-third octave frequency band;
 is the number of scanning points (microphones in the grid).
The European technical specification [1] also allows to compute a single number rating, called  and expressed in dB, from the Sound Insulation Index values in one-third octave bands, in order to categorize and compare the noise barriers, but here only the SI values as a function of frequency will be presented and discussed.
Practical experience has shown that some errors may anyway occur when the amplitude of the transmitted component of the impulse response is very low; this problem is not always easy to recognize and will almost certainly cause wrong results. The European technical specification [1] explains the measurement procedure in details, but a criterion for validating the measurement and prevent the acquisition of possible invalid data due to this problem is missing; the authors analyzed many measurements on different noise barriers performed in-situ during the mentioned round robin test organized in the frame of the European project QUIESST and the analysis of this large amount of data confirmed that a source of possible measurement problem may be a very high airborne sound insulation, giving rise to poor SNR values on the receiver side.
Figures 14(b) and (c) show an example of impulse responses obtained when measuring the Sound Insulation Index on two different noise barriers. The width of the Adrienne time window is fixed due to geometrical reasons: for 4 m height barriers, the maximum possible width is 7.9 ms, in order to exclude the sound reflected on the ground (for the free-field measurement) and the sound diffracted at the top edge of the barrier (for the barrier measurement). In Figure 14 the window is placed from around t = 4 ms to around t = 11 ms. In the free-field case (a), the ground reflection is visible just after t = 12 ms as a smaller peak; in the barrier measurement 1 (b), taken across a lightweight barrier, the diffracted sound (just outside the window) can hardly be discriminated, having a low amplitude compared to the tail of the transmitted component; in the barrier measurement 2 (c), taken across a heavyweight barrier, the diffracted sound is clearly visible as it is much stronger than the transmitted component framed by the Adrienne window. It should be noted that plots (a), (b) and (c) have different amplitude scales. The width of the used Adrienne window allows to obtain valid data starting from the 200 Hz one-third octave band; its positioning is based on geometric calculations for barrier measurements and on peak positioning for free-field measurements; small adjustments are done for each microphone due to their different positions on the measurement grid.
The example in Figure 14(c) shows a measurement that will give for sure wrong results because the noise barrier airborne sound insulation is so high that the amplitude of the transmitted impulse response component (inside the Adrienne window) is of the same order of magnitude or below that of the background noise. A possible way to check if a measurement on an highly insulating noise barrier is valid consists in the evaluation of the ratio between the transmitted signal energy and the background noise energy.
In order to evaluate this signal-to-noise ratio (SNR) for each impulse response, a time interval including only the background noise and a time interval including the transmitted signal must be identified. Considering the measurement geometry, the time interval for the evaluation of the background noise has been chosen from t = 0 ms to t = 3.5 ms and the time interval for the evaluation of the signal has been chosen from t = 3.5 ms to t = 7.0 ms. These time intervals are shown in Figure 14 marked as “A” for the background noise and “B” for the transmitted signal, respectively. The 3.5 ms time marker may be shifted in case of different geometrical configurations. These 3.5 ms wide data windows are allowed to obtain meaningful frequency data starting from the one-third octave band centred on 400 Hz, so that the SNR is evaluated in the one-third octave bands from 400 Hz to 5 kHz:
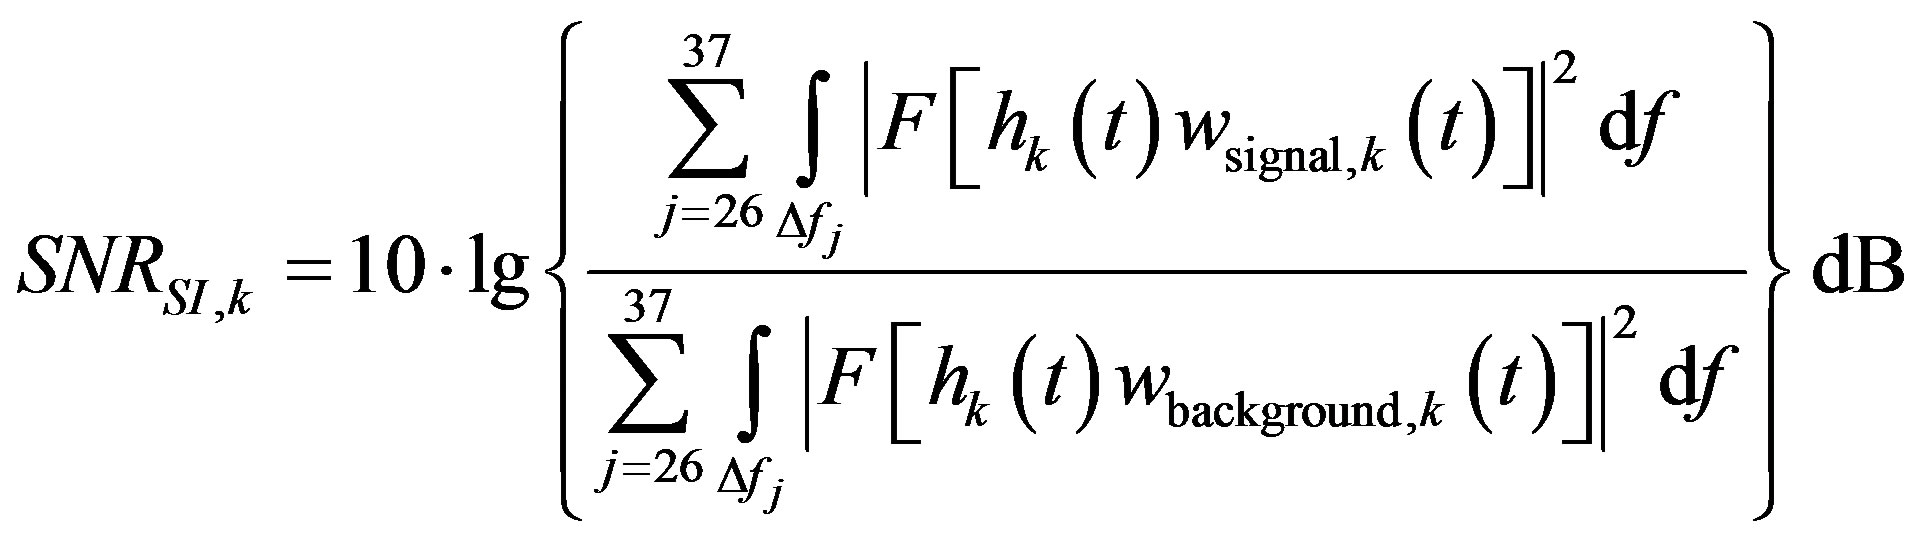 (7)
(7)
where:
 is either the free-field or the barrier impulse response, measured at the k-th microphone position;
F is the symbol of Fourier transform;
k is microphone identifier in the grid (k = 1 to 9);
j is the index of the one-third octave frequency bands between band nr. 26 (400 Hz) and band nr. 37 (5 kHz);
 is the width of the j-th one-third octave frequency band;
 is the time window for the signal evaluation of the impulse response, conventionally chosen = 1 from 3.5 ms to 7.0 ms, = 0 elsewhere;
 is the time window for the background noise evaluation of the impulse response, conventionally chosen = 1 from 0.0 ms to 3.5 ms, = 0 elsewhere.
The proposed  is denoted as
  in order to recall that it is tailored for SI measurements and specific for each microphone
 . It is essentially the dB ratio of the energy contained in the time interval from 3.5 ms to 7.0 ms divided by the energy contained in the time interval from 0 ms to 3.5 ms, in the one-third octave frequency bands from 400 Hz to 5 kHz.
Figure 15(a) shows three measurements taken across the same heavy concrete noise barrier using different measuring equipments (case study 1). Measurements nr. 2 and 3 give quite similar results (which can be considered as “correct” values), while measurement 1 doesn’t, especially at low frequencies. Figure 15(b) shows the corresponding , computed according to Equation (7) for each of the nine microphone positions. The
  values of measurement 1 are very low and for some microphones even lower than 0 dB (meaning that the background noise is higher than the transmitted signal). The
  values of measurements 2 and 3 are higher than 10 dB for all microphones.
Figure 16(a) shows three measurements taken across the same lightweight noise barrier, again obtained using different measuring equipments (case study 2). In this case the three SI curves are in a very good agreement. The corresponding  plotted in Figure 16(b) are all higher than 15 dB. It is worth noting that in this case the
  values obtained with different measuring equipments show a similar behaviour, with higher values for microphones 4 and 7: this is probably due to a sound insulation leakage nearby the mentioned microphones positions.
Following a well known rule for signal-to-noise ratios and after the inspection of some hundreds of measurements, a minimum value of 10 dB for the average  can be taken as a minimum requirement to assess the validity of a measurement; a safer value of 15 dB is anyway recommended. When a too low
  is found just after an in-situ measurement, actions must be taken in order to increase the transmitted signal power before repeating the measurement. The output gain of the loudspeaker amplifier can be increased, paying attention to not reach distortion levels and not overload the input
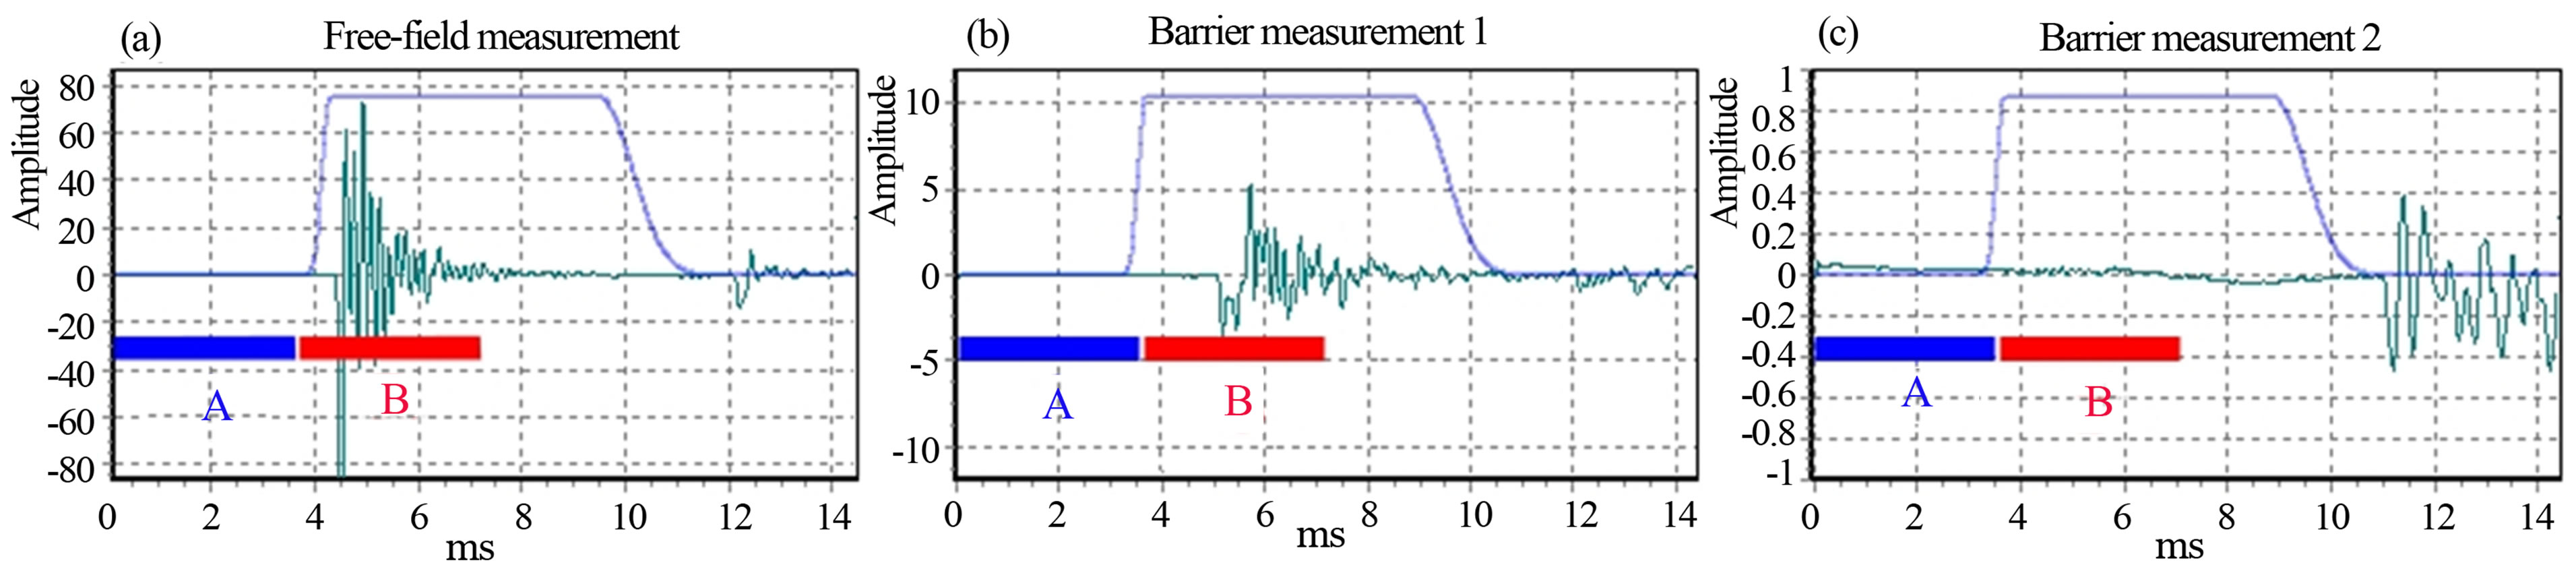
Figure 14. Time interval selections for background noise (A) and signal (B). (a) Free-field measurement, the direct component is visible; (b) Transmitted component across a lightweight barrier, the transmitted component inside the window is stronger than the diffracted component outside the window; (c) Transmitted component across a heavyweight barrier, the transmitted component inside the window is stronger than the diffracted component outside the window. Each plot (a), (b) and (c) has a different amplitude scale.
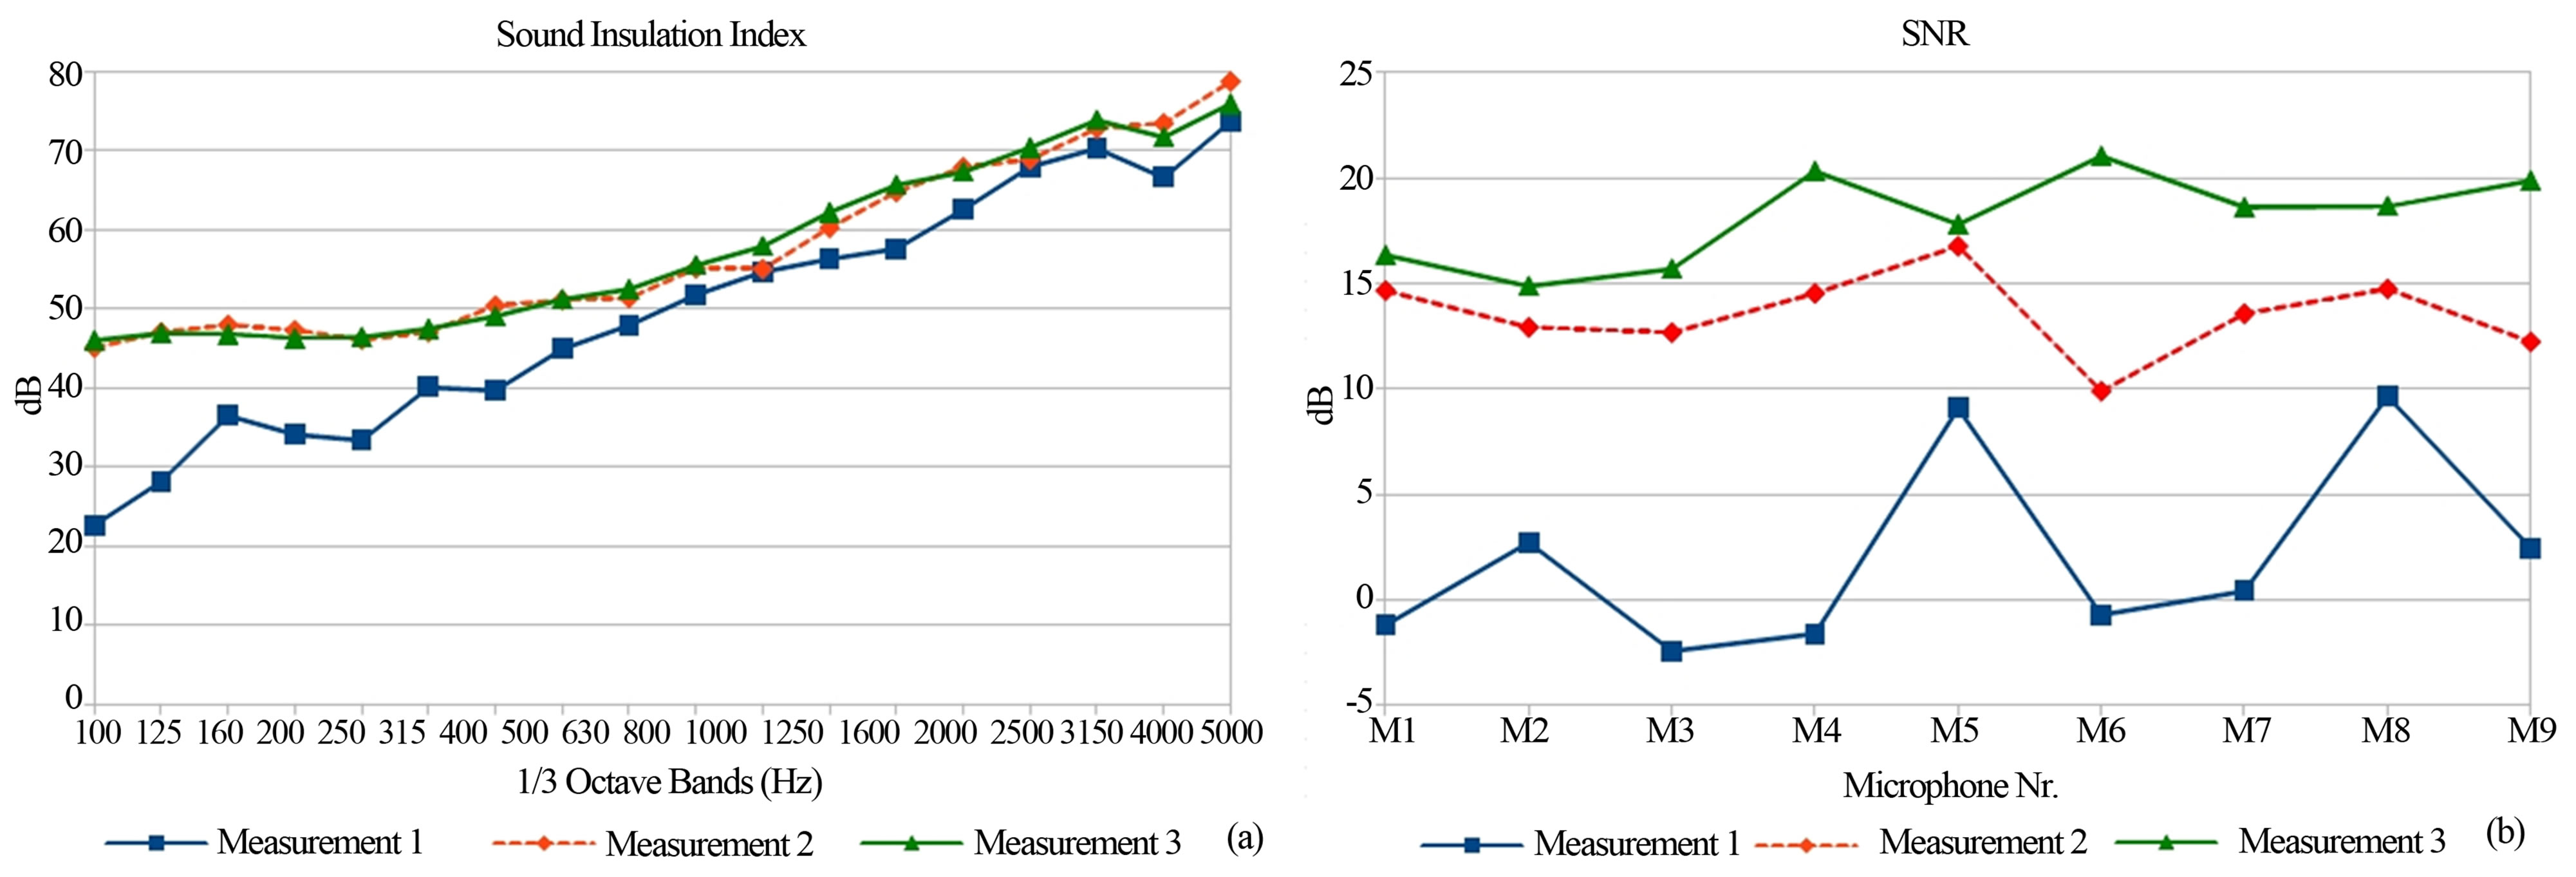
Figure 15. Case study 1, heavy noise barrier having a high airborne sound insulation. (a) SI values measured with different measuring equipments; (b) Associated SNRSI,k according to Equation (7).
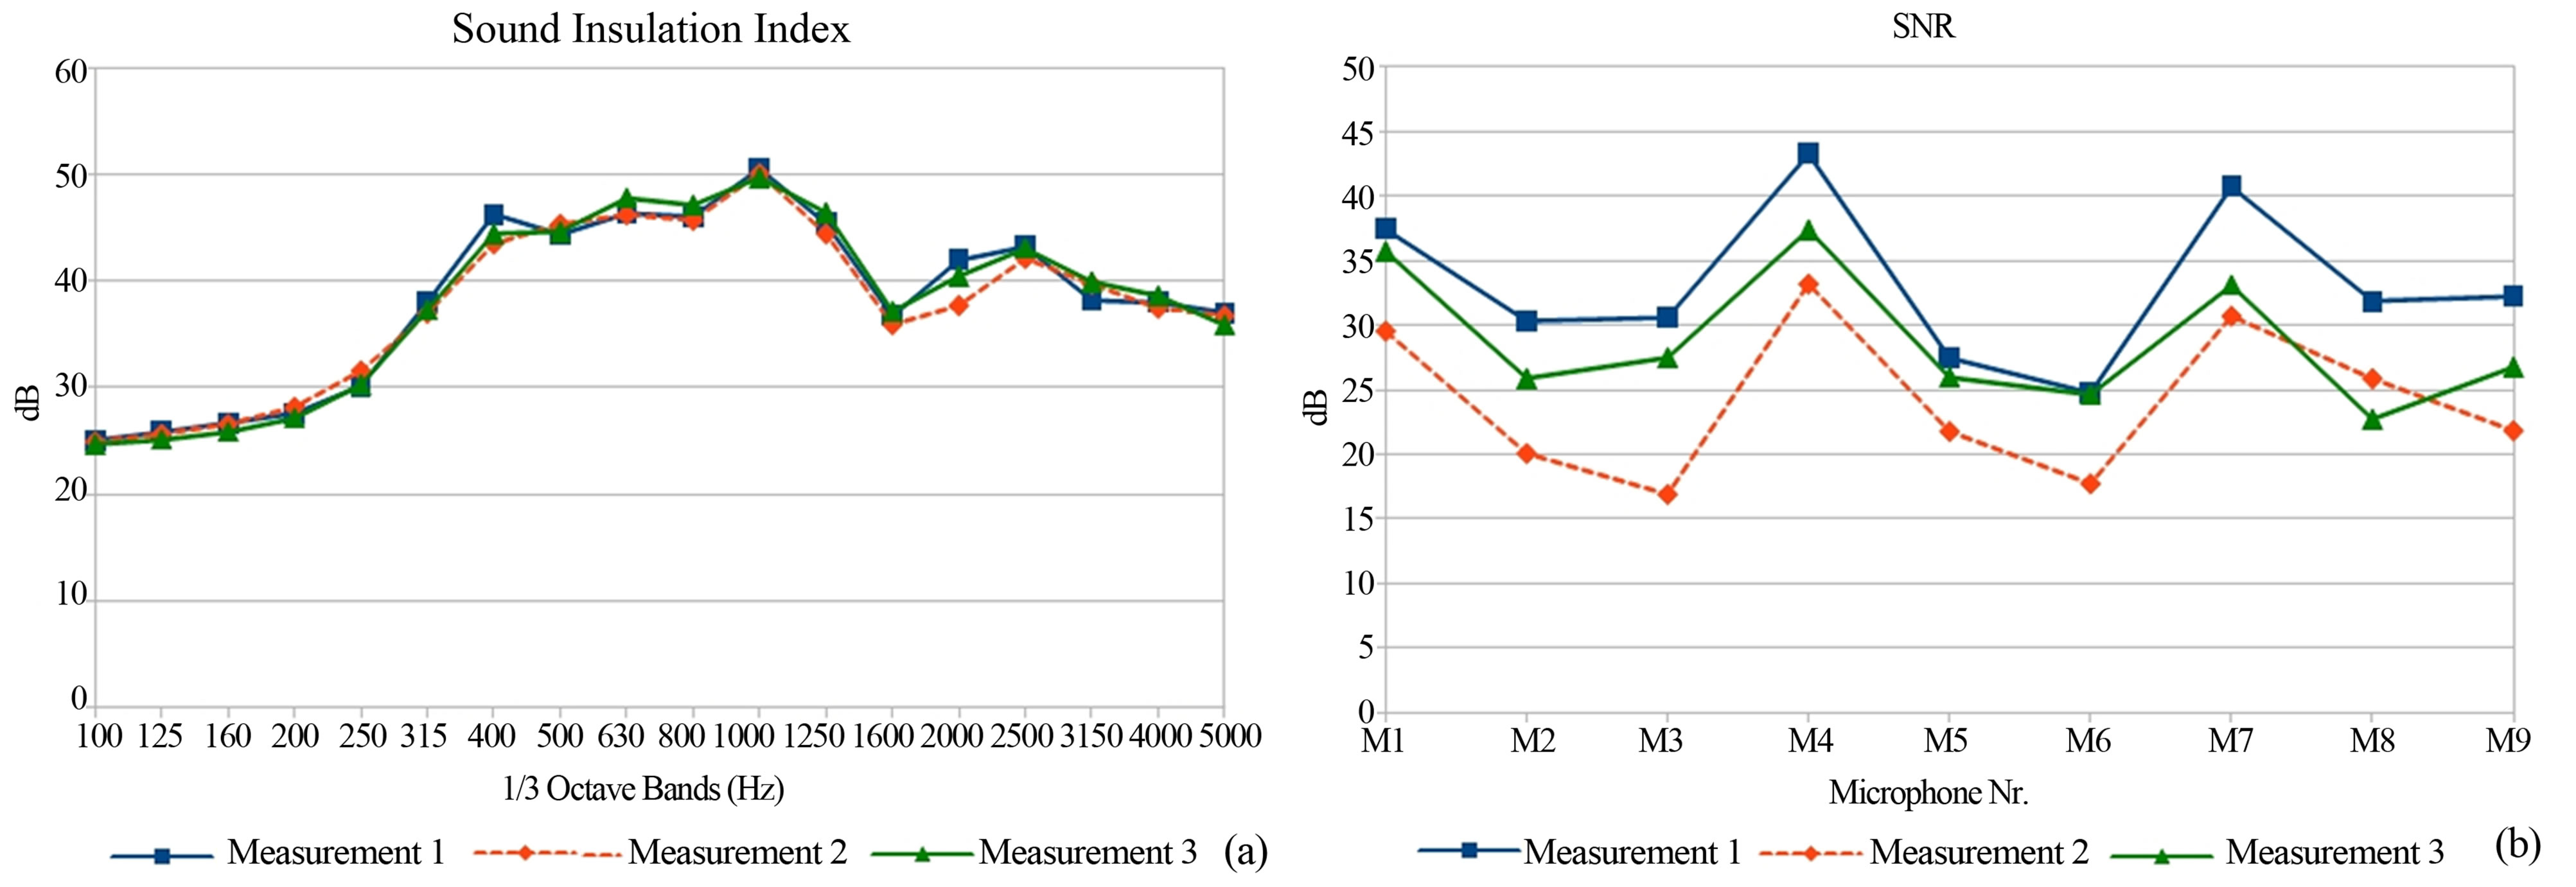
Figure 16. Case study 2, lightweight noise barrier having a moderate airborne sound insulation. (a) SI values measured with different measuring equipments—measurements;(b) Associated SNRSI,k according to Equation (7).
stages of the microphones when the free-field measurement is taken. If the impulse responses are measured using an MLS signal, the sequence length and number of averages can be increased in order to maximize the effective signal-to-noise ratio [8,10,12], remembering that this technique requires stationary conditions of the measured acoustic system, so that a very long measurement time can have adverse effects when measuring in nonideal weather conditions (presence of wind and quick changes of temperature or humidity).
In Figures 17 and 18 two examples of Sound Insulation Index measurements, obtained by 8 independent
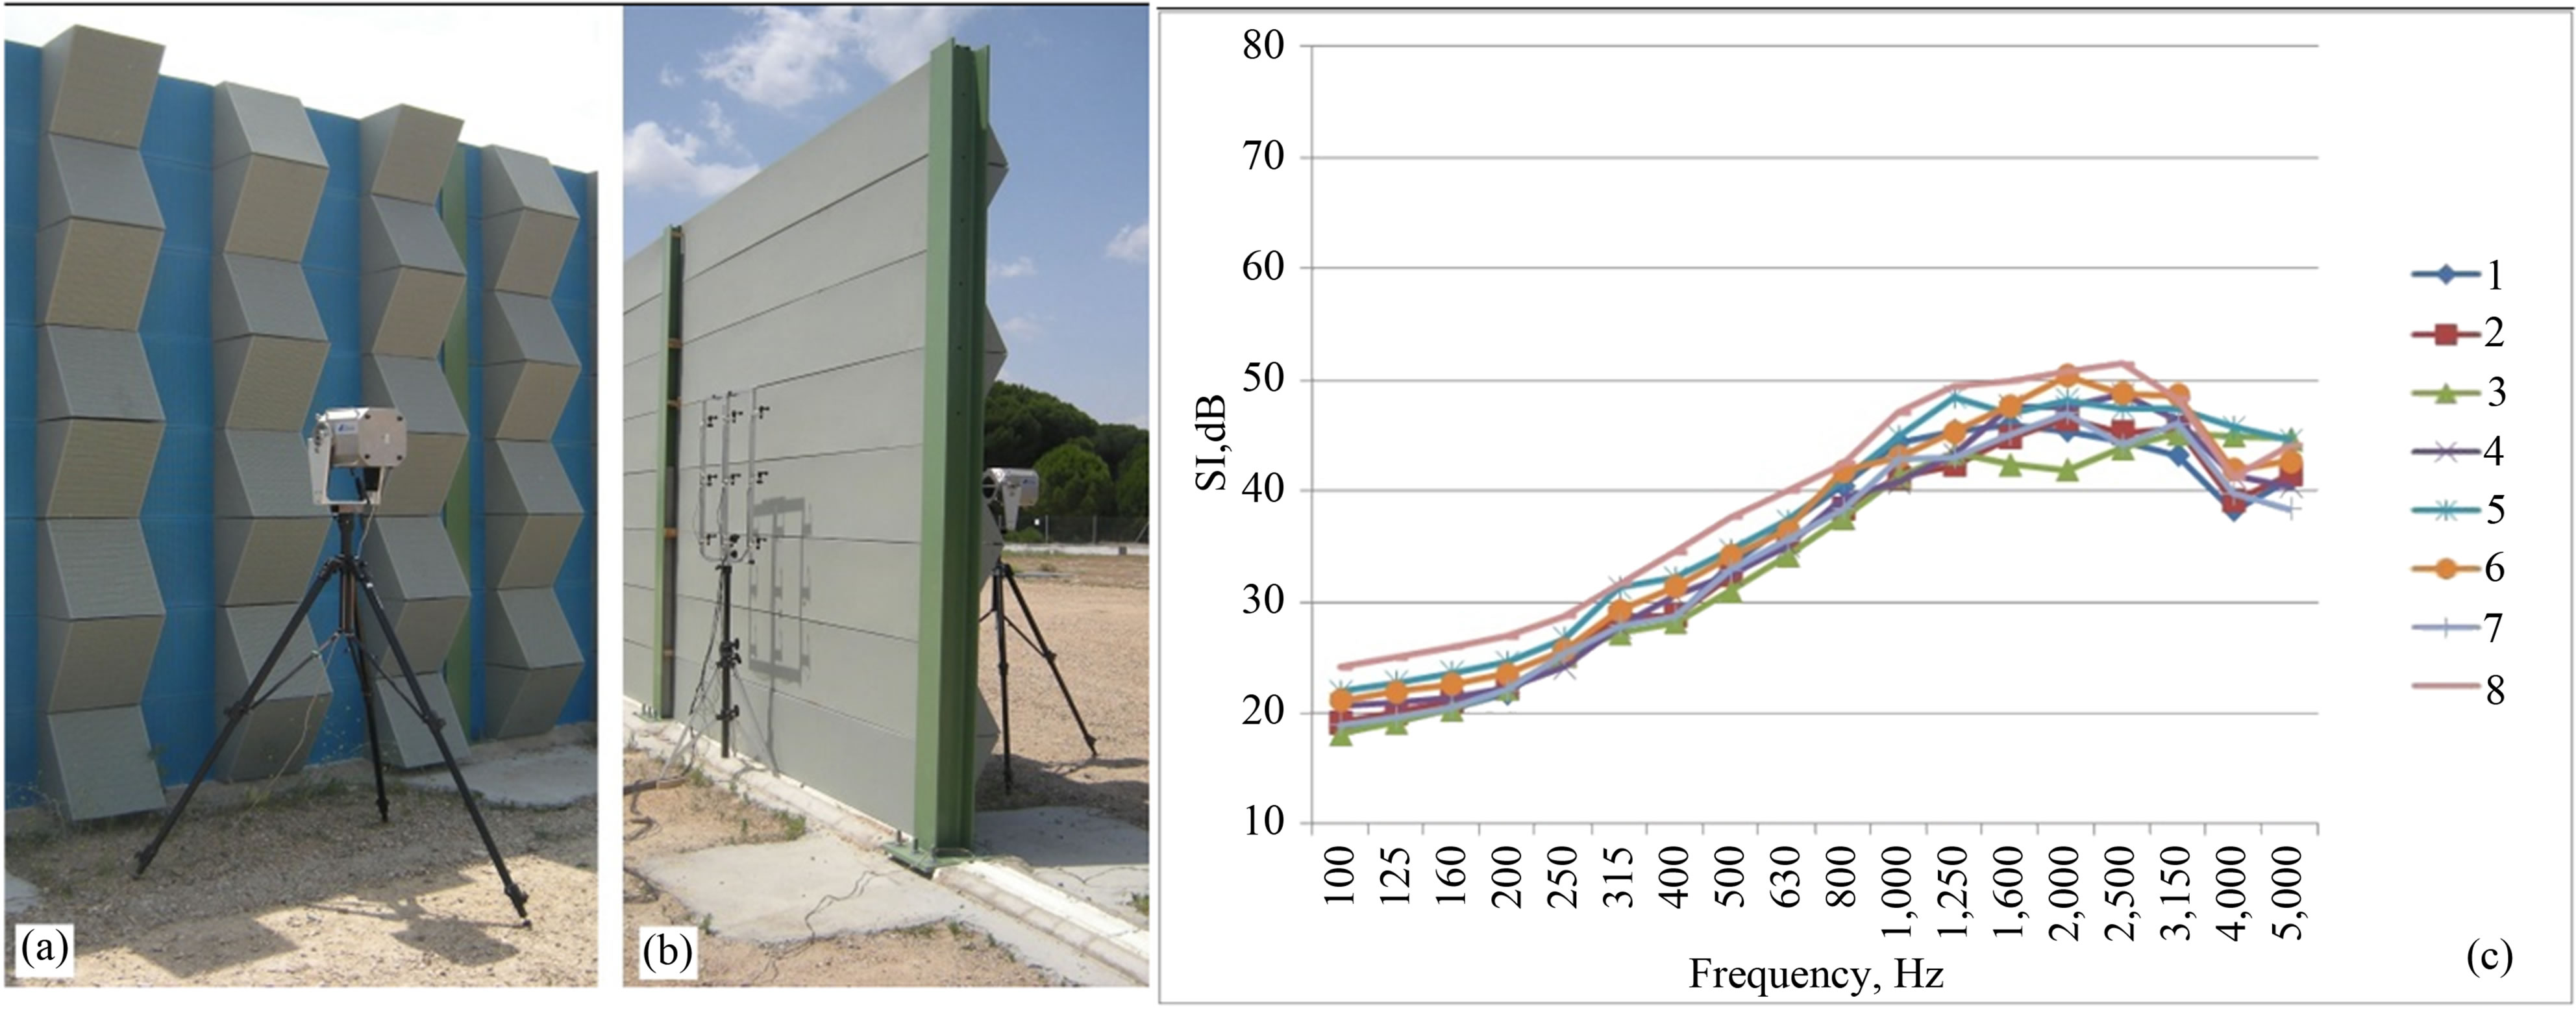
Figure 17. Sample 1 (strongly non flat, sound absorbing) on the Valladolid test site. (a) Front view; (b) Rear view; (c) Sound Insulation index values, according to Equation (6), measured by eight independent laboratories.
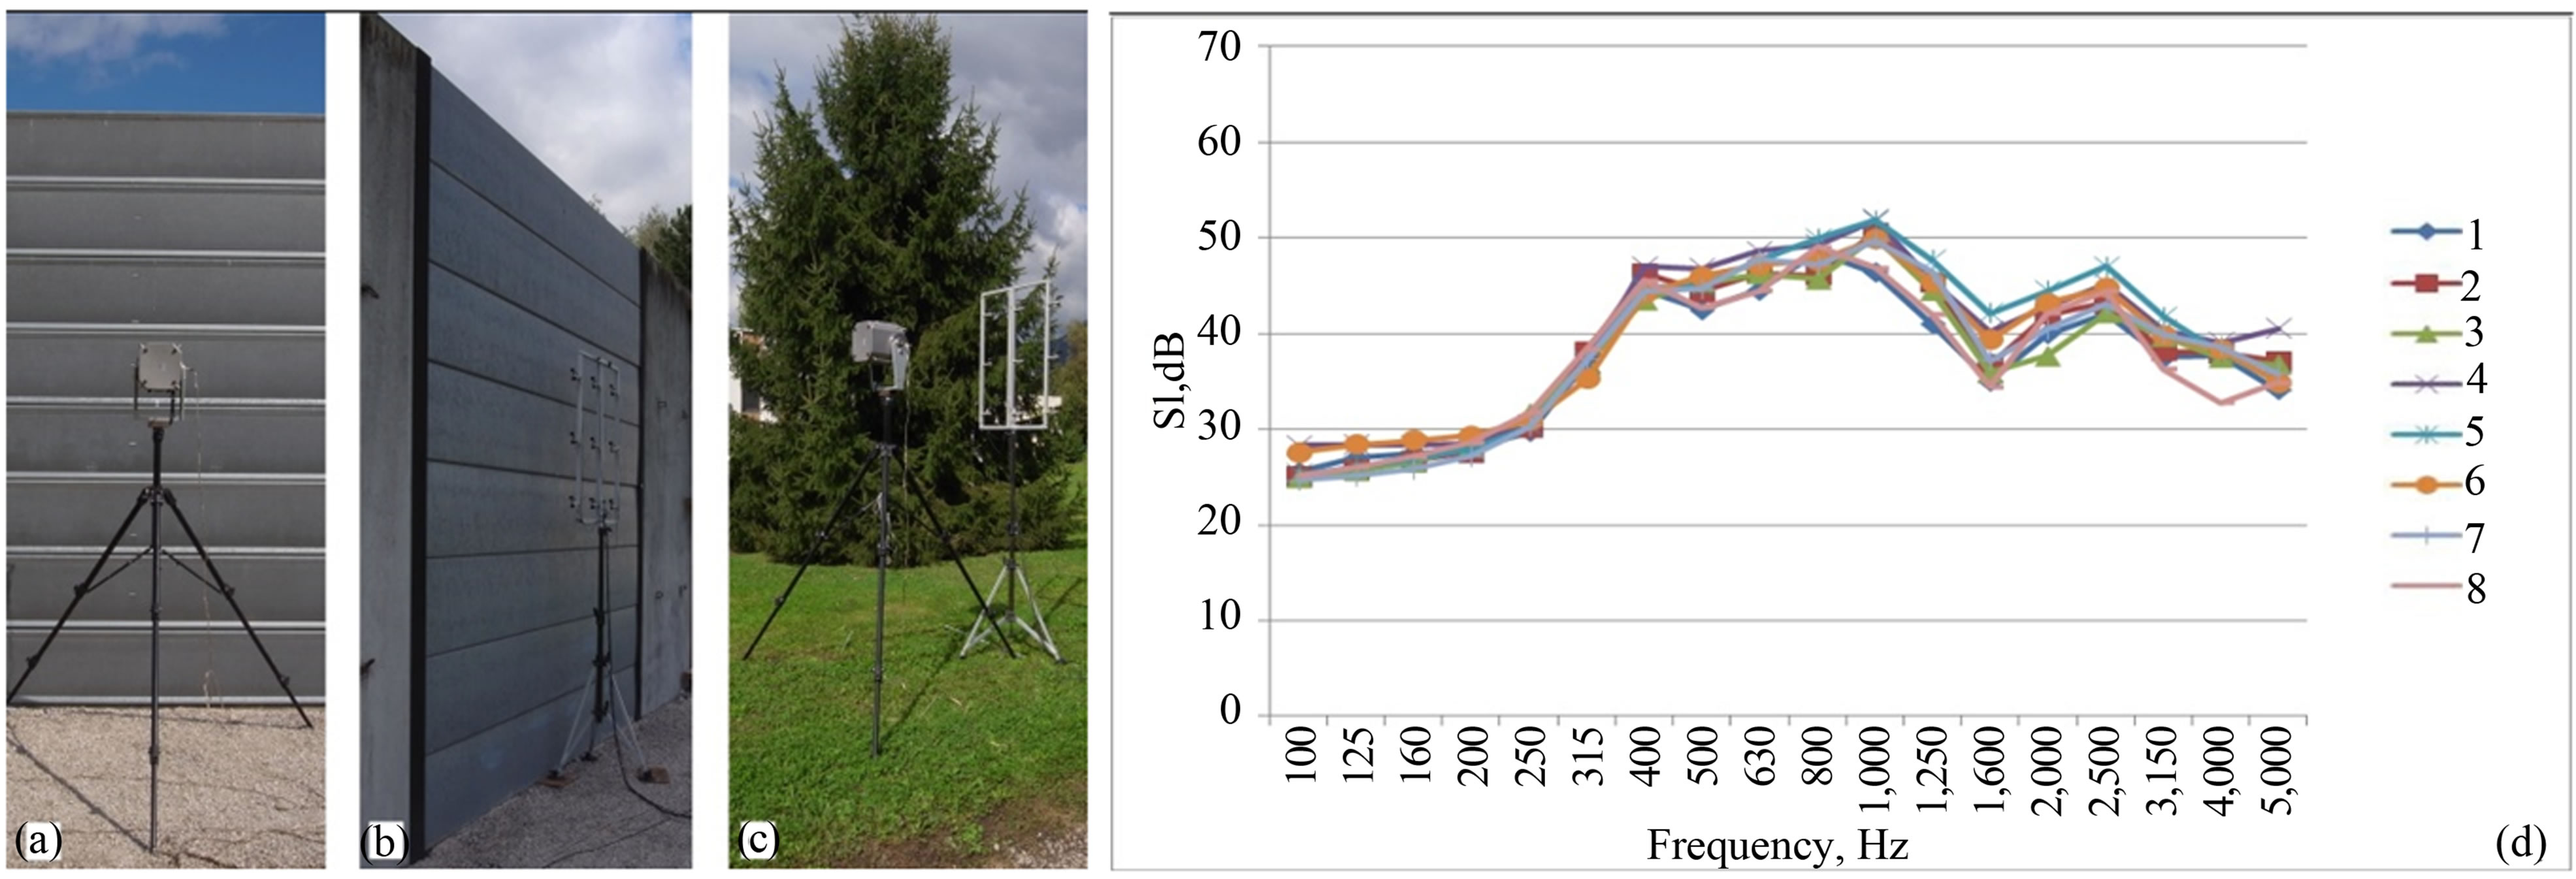
Figure 18. Sample 2 (flat, sound absorbing) on the Grenoble test site. (a) Front view; (b) Rear view; (c) Free field measurement; (d) Sound Insulation index values, according to Equation (6), measured by eight independent laboratories.
laboratories on the same samples used for Reflection Index measurements, installed on Grenoble and Valladolid test sites, are shown. Figure 17 shows the complex, strongly non flat and sound absorbing, sample on the Valladolid test site already shown in Figure 11 for the Reflection Index measurement. Figure 18 shows a flat and sound absorbing sample (metallic cassettes, perforated and filled with mineral wool) on the Grenoble test site.
Also in these cases the agreement among the different laboratories may be judged quite good, i.e. the associated repeatability is as expected for a robust in situ method.
The detailed repeatability and reproducibility values of the QUIESST method can be found in [13].
5. Conclusion
Relying on the outcomes of the former ADRIENNE project, the recent QUIESST project introduced several new improvements in the measurement and validation of the Reflection Index and Sound Insulation Index, leading to a new, more reliable measurement method. The use of a square 9-microphone array, not rigidly connected to the loudspeaker, and multichannel acquisition make easier on site measurements, but demanded some advancements in signal processing. The optimized signal subtraction technique now can give nearly zero residuals, which can be quantitatively estimated by the reduction factor . The correction factors for the sound source directivity makes the Reflection Index values independent from the particular sound source used. Similarly, the computation of the
  introduces a strong validation criterion for Sound Insulation Index measurements. The final inter-laboratory test conducted by eight laboratories on thirteen samples in two test sites validated the method and the statistical analysis of the RRT results has given the repeatability and reproducibility values of the new method.
6. Acknowledgements
The QUIESST research is an EU funded project under the Seventh Framework Program (FP7-SST-2008-RTD-1-N. 233730).
REFERENCES
- CEN/TS 1793-5, “Road Traffic Noise Reducing Devices— Test Method for Determining the Acoustic Performance— Part 5: Intrinsic Characteristics—In Situ Values of Airborne Sound Reflection and Airborne Sound Insulation,” 2003.
- http://www.quiesst.eu
- EN 1793-1, “Road Traffic Noise Reducing Devices— Test Method for Determining the Acoustic Performance— Part 1: Intrinsic Characteristics of Sound Absorption,” 1997.
- EN 1793-2, “Road Traffic Noise Reducing Devices— Test Method for Determining the Acoustic Performance— Part 2: Intrinsic Characteristics of Airborne Sound Insulation,” 1997.
- ADRIENNE Project Team, SMT Project MAT1-CT94049 Final Report, 1998.
- M. Garai and P. Guidorzi, “European Methodology for Testing the Airborne Sound Insulation Characteristics of Noise Barriers in Situ: Experimental Verification and Comparison with Laboratory Data,” Journal of the Acoustical Society of America, Vol. 108, No. 3, 2000, pp. 1054-1067. doi:10.1121/1.1286811
- G. Watts and P. Morgan, “Measurement of Airborne Sound Insulation of Timber Noise Barriers: Comparison of in Situ Method CEN/TS 1793-5 with Laboratory Method EN 1793-2,” Applied Acoustics, Vol. 68, No. 4, 2007, pp. 421-436. doi:10.1016/j.apacoust.2006.03.001
- M. Garai and P. Guidorzi, “In Situ Measurements of the Intrinsic Characteristics of the Acoustic Barriers Installed along a New High Speed Railway Line,” Noise Control Engineering Journal, Vol. 56, No. 5, 2008, pp. 342-355. doi:10.3397/1.2969244
- M. Conter, M. Haider and R. Wehr, “Aluminium Noise Barriers and Added Devices: A Case Study Using the European Standard for in-situ Measurements,” Proceedings of Inter-Noise 2009, Ottawa, 23-26 August 2009, pp. 1260-1271.
- M. Garai P. Guidorzi and L. Barbaresi, “Progress in Sound Reflection Measurements on Noise Barriers in Situ,” Proceedings of Inter-Noise 2012, New York, 19-22 August 2012, pp. 1-10.
- P. Guidorzi and M. Garai, “Reflection Index Measurement on Noise Barriers with the Adrienne Method: Source Directivity Investigation and Microphone Grid Implementation,” Proceedings of Inter-Noise 2011, Osaka, 4-7 September 2011, pp. 1-6.
- P. Guidorzi and M. Garai, “Signal Analysis in the Sound Absorption Measurement Procedure: The Importance of Time Subtraction and Reference Surface Corrections,” Proceedings of Acoustics-08, Paris, 29 June-4 July 2008, pp. 1755-1760.
- M. Garai, P. Guidorzi and E. Schoen, “Assessing the Repeatability and Reproducibility of in Situ Measurements of Sound Reflection and Airborne Sound Insulation Index of Noise Barriers,” Proceedings of AIA-DAGA 2013, Meran, 19-21 March 2013, pp. 1-4.
- P. Robinson and N. Xiang, “On the Subtraction Method for in-situ Reflection and Diffusion Coefficient Measurements,” Journal of the Acoustical Society of America, Vol. 127, No. 3, 2010, pp. EL99-EL104. doi:10.1121/1.3299064
- P. Guidorzi, J. Klepacek and M. Garai, “On the Repeatability of Reflection Index Measurements on Noise Barriers,” Proceedings of EuroNoise 2012, Prague, 10-13 June 2012, pp. 1314-1319.