Open Journal of Acoustics
Vol.2 No.3(2012), Article ID:22596,10 pages DOI:10.4236/oja.2012.23014
Design and Benchmark Tests of a Multi-Channel Hydrophone Array System for Dolphin Echolocation Recordings
Department of Measurement Technology and Industrial Electrical Engineering, Lund University, Lund, Sweden
Email: josefin.starkhammar@elmat.lth.se
Received May 4, 2012; revised June 2, 2012; accepted July 26, 2012
Keywords: Dolphin Echolocation Measurement System; Hydrophone Array; Burst Mode Sampling
ABSTRACT
This paper describes in depth the design and application considerations of a computer based measurement system enabling 1 MS/s simultaneous sampling of 47 hydrophones for cross sectional recordings of echolocation beams of toothed whales (Odontocetes). An earlier prototype version of the system has previously only been presented as a brief proof of principle that did not offer a complete description of the software and hardware solution. Crucial hardware and software design considerations of the further developed system include the re-arm times of the burst mode sampling and the dual-core distributed execution of the software components. The rearm time was measured to 283 µs, using a 550 µs long sample window around each click. This enables burst mode sampling of clicks with an inter-click interval as short as 833 µs. It is shown through both synthetic benchmark tests of the system and through field measurements of bottlenose dolphins (Tursiops truncatus) and a beluga whale (Delphinapterus leucas) that it is capable of acquiring, analyzing and visualizing data in run-time. It operates effectively also in highly reverberant surroundings like concrete pools and shallow waters. Burst mode sampling allows the system to block reflections with 0.3 - 0.5 m longer propagation paths than the direct path. It is suggested that the system’s compliance to reverberant recording sites makes it valuable in future dolphin echolocation studies.
1. Introduction
Research on the echolocation beam and echolocation skills of toothed whales (Odontocetes) requires technically advanced acoustic measurement systems, often with innovative designs. Computer-based data acquisition technology has developed rapidly during recent years. Standards such as PCI (Peripheral Component Interconnect) and PXI (PCI extensions for instrumentation) have been developed. These advances enable the user to acquire data and stream it to a hard drive while at the same time analyze some of the data in run-time. These are features that are useful for most if not all biosonar research.
Using this technology, the manual processing steps like transferring the acquired data from a logger to a PC, post-processing to analyze and visualize it etc., can be eliminated. The most important benefits of this are the reduction of post-processing time and the possibility of run-time analysis and visualization of data, which facilitate the understanding of the dynamics of the sonar system under study. In addition, the possibility to make online adjustments of the measurement configuration to optimize data acquisition while a dolphin behavior actually is taking place provides valuable recording and measurement advantages.
Since multiple parallel hydrophone channels are needed in order to record the entire cross section of the dolphin echolocation beam, the higher spatial resolution offered by multi-channel setups is another important benefit that holds considerable promise for animal bioacoustic research.
Multi-channel computer-based dolphin research equipments have previously been reported by several research groups [1-5]. The system presented in [4] housed 24 hydrophones. It proved very useful in its application but its rapid file size growth did not allow for more than a few seconds of continuous sampling at a time. Additionally it was not reported of any capability of run-time analysis and visualization. The system presented in [3] consisted of a quadratic 4 by 4 array of hydrophones, each of which coupled with filters, pre-amplifiers and peak detectors and connected to a computer via a multichannel PCI card. That system measured only the peak sound pressure level for each click at the 16 hydrophone positions across the echolocation beam of dolphins that aimed their echolocation at the hydrophone array. The system was not able to record the entire waveforms of the echolocation clicks because of the sampling frequency being too low (70 kS/s).
Further, in most biosonar study applications, peak amplitudes and inter-click intervals (ICIs) of echolocation clicks are far from enough. Additional click property information is desired, such as frequency spectral distribution within the echolocation beam, and also an increased spatial resolution of the hydrophone array than what was available in the system presented in [3]. Furthermore, additional implementation of advanced runtime analysis and visualization of data would considerably facilitate a direct and intuitive understanding of the acoustic situation that is studied.
Therefore, the system reported of in [6] was developed. However, that paper only showed a proof of principle, and did not offer a complete description of the software and hardware solution.
In the present study, the system has been further developed with low noise amplifiers and filters and it has been optimized for data acquisition speed and run-time data analysis and visualizations. The features of the present system are crucial for its functionality in, e.g. highly reverberant surrounding. It is here fully described and benchmark tested in laboratory, and through measurements of two different species of the delphinid family in low reverberant as well as highly reverberant environments. The system’s compliance to highly reverberant surroundings is specifically highlighted and discussed.
2. Materials and Methods
2.1. Dolphin Echolocation
A typical bottlenose dolphin (Tursiops truncatus) echolocation “click” has a duration of approximately 50 - 80 μs, see Figure 1 (b) [7]. The click peak frequency is often centered at 40 - 50 kHz and/or 110 - 120 kHz but the frequency spectrum contain components that measure as high as 180 kHz and as low as 1 kHz.
Peak-to-peak source levels as high as 228 dB re 1 μPa at 1 m have been reported [8], measured in animals required to detect objects far away. However, source levels reported in most studies have been in the range of 160 - 200 dB re 1 μPa at 1 m.
The inter-click interval varies depending on the echolocation task but is usually longer than 20 ms [7,9-11]. In social contexts, it can be as short as 0.5 ms (i.e. up to 2000 clicks per second) for some species [12,13].
The cone shaped echolocation beam has a –3 dB beamwidth angle of approximately 10˚ and is directed forward from the dolphins head, see Figure 1 (a). The total beam is wider, and the –20 dB width being in the order of 40˚ [7]. Recent findings indicate that this angle can be broadened and that the beam axis can be steered both to the right and left of the animal’s body axis, without moving its head [4,14].
The echolocation clicks from beluga whales (Delphinapterus leucas) have peak frequencies usually around 100 - 115 kHz [15] and with source levels similar to those of bottlenose dolphins. The –3 dB beamwidth angle of beluga whales has been measured to be approximately 6.5˚ and is thus narrower than the bottlenose dolphin beam. The total beam width of the beluga is also narrower, with the –20 dB width being in the order of 25˚ [15].
2.2. General Data Acquisition Strategy
The diameter of a 10˚ bottlenose dolphin beam at 1 m distance, regarded as in the far-field [16], is approximately 18 cm (–3 dB beamwidth). Including the –20 dB beamwidth of 40˚, the beam cross section diameter at 1 m will be 73 cm. Based on these considerations the size of a quadratic hydrophone array was chosen to 75 cm by 75 cm. A spatially larger array would allow dolphins to swim farther away whilst still measuring the whole beam width, but would give a lower absolute resolution within the beam if the number of available hydrophones remains fixed. Therefore, a tradeoff between coverage and resolution has to be considered for each individual measurement situation. The measurement system was designed with these presented measurement scenarios in mind.
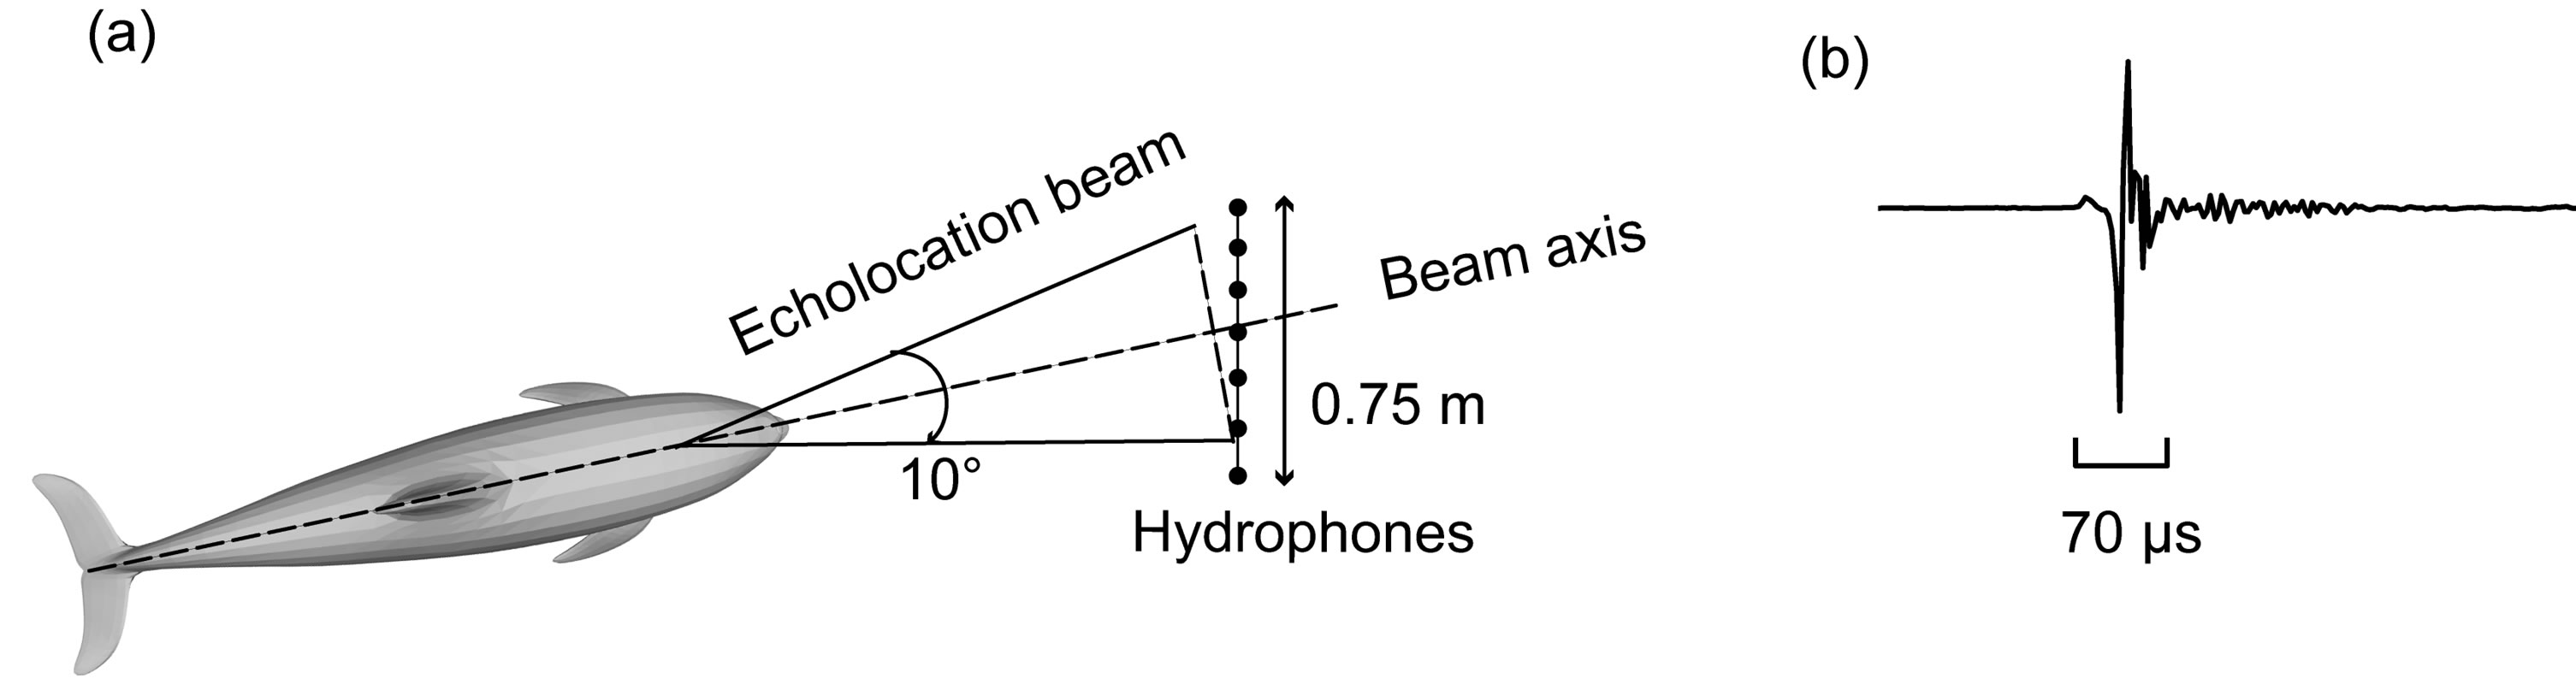
Figure 1. (a) The basic measurement scenario with a dolphin echolocation at the hydrophone array; (b) A typical waveform of a bottlenose dolphin (Tursiops truncatus) echolocation click.
Multi-channel data collection, with high spatial resolution and sampling rate, results in large amounts of data per unit time that the system must be able to handle. If the amount of data is too large, parts of data will be lost in the process. Therefore, it was important to keep the number of samples per unit time as low as possible, but yet not under-sample the event.
The chosen method to minimize the amount of data per unit time in this study was to avoid storing data during the rather short (~20 ms) but in relation to the clicks (70 µs), significantly long, silent periods between echolocation clicks. Hence, the presented system only acquires a pre-set number of samples each time a hydrophone output reaches over a chosen trigger level. This is here referred to as burst mode sampling of each individual click as opposed to continuous sampling, the method used in previously presented bio-sonar research projects.
Burst mode sampling requires storing of the time stamps of each record if the timing of the clicks in a sequence is to be reconstructed in post processing. However, since the inter-click interval is so much longer than the individual clicks, burst mode sampling still cuts the size of stored data to at least half compared to continuous sampling. In fact, under normal echolocation scenarios it cuts the data size with up to 97 percent.
Considering that a free-swimming dolphin can approach the array from any angle, the recording time window around each echolocation click has to be at least 550 μs, including a pre-trigger of approximately 40 µs, in order for all spatially distributed channels to record the entire waveforms, see Figure 1.
The total time required to complete one previous data recording, re-trig and start a new one is here referred to as the system’s rearm time. Even though burst mode sampling minimizes the data volume, fast streaming to the data storage device is still required. Hence, also a data storage device with sufficiently fast data writing speed and a fast data bus is needed.
2.3. Hardware Solution
Custom made hydrophones of the type UD1 (Ceram ABLund, Sweden) was used. The hydrophone sensitivity at 120 kHz was measured to –220 dB re 1 V/µPa. The frequency sensitivity response curve used for correction of signals during post-processing is shown in Figure 2.
A PXI-platform was chosen for the current version of the system, mainly based on its expandability to more channels and data streaming capacity. The rack-based PXIstandard has a 133 MB/s PCI bus (32 bits at 33MHz) with the ability of hardware triggering and synchronization of peripheral components, such as digitizer cards. Six high-speed, high-density digitizer cards (NI PXI-5105) and an embedded controller (NI PXI-8106), mounted in an eight-slot PXI-rack (NI PXI-1042, National Instruments Corporation, Austin, Texas, US) were used.
Each digitizer card has eight 12-bit simultaneously sampling channels with a theoretical minimum re-arm time of 2.4 µs and a 19 MB on-board memory. The cards have data streaming functions that enable data acquisition in burst mode. It is possible to pre-trig the PXI-cards so that also the very beginnings of the click waveforms are recorded. Hardware triggering of the cards was used since it does not occupy any CPU capacity as opposed to software-based triggering.
The six digitizer cards were synchronized through the PXI star trigger, to acquire signals from 6 × 8 parallel channels simultaneously. Since one of these channels was occupied by a trigger signal, the remaining 47, arranged in a symmetrical 7 by 7 hydrophone array, minus the two upper corners were available for recording, see Figure 3(a).
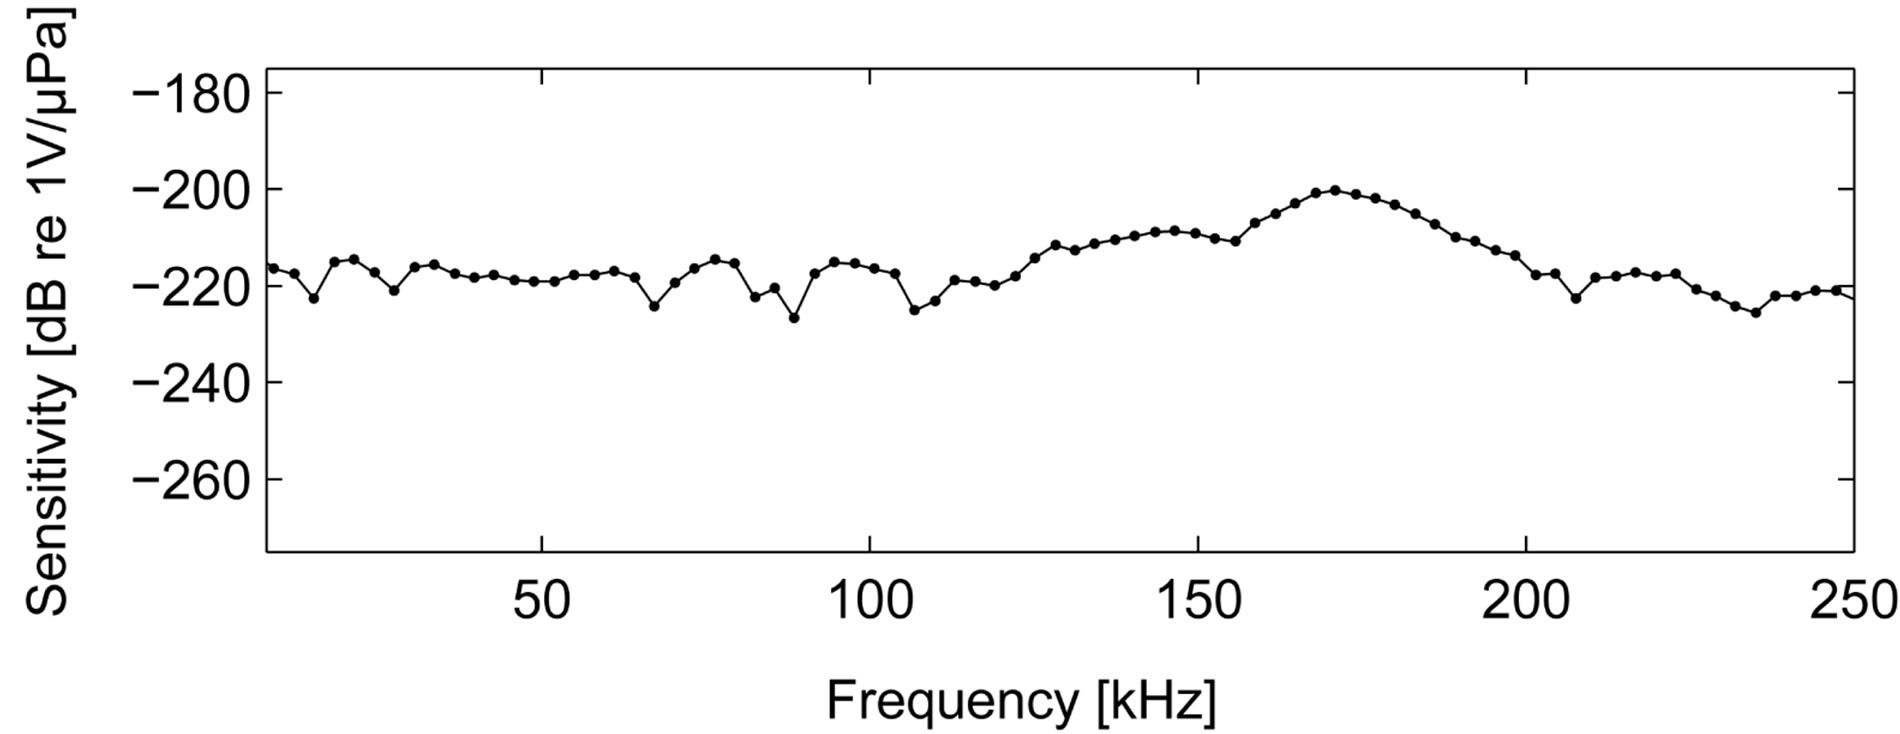
Figure 2. Hydrophone sensitivity response.
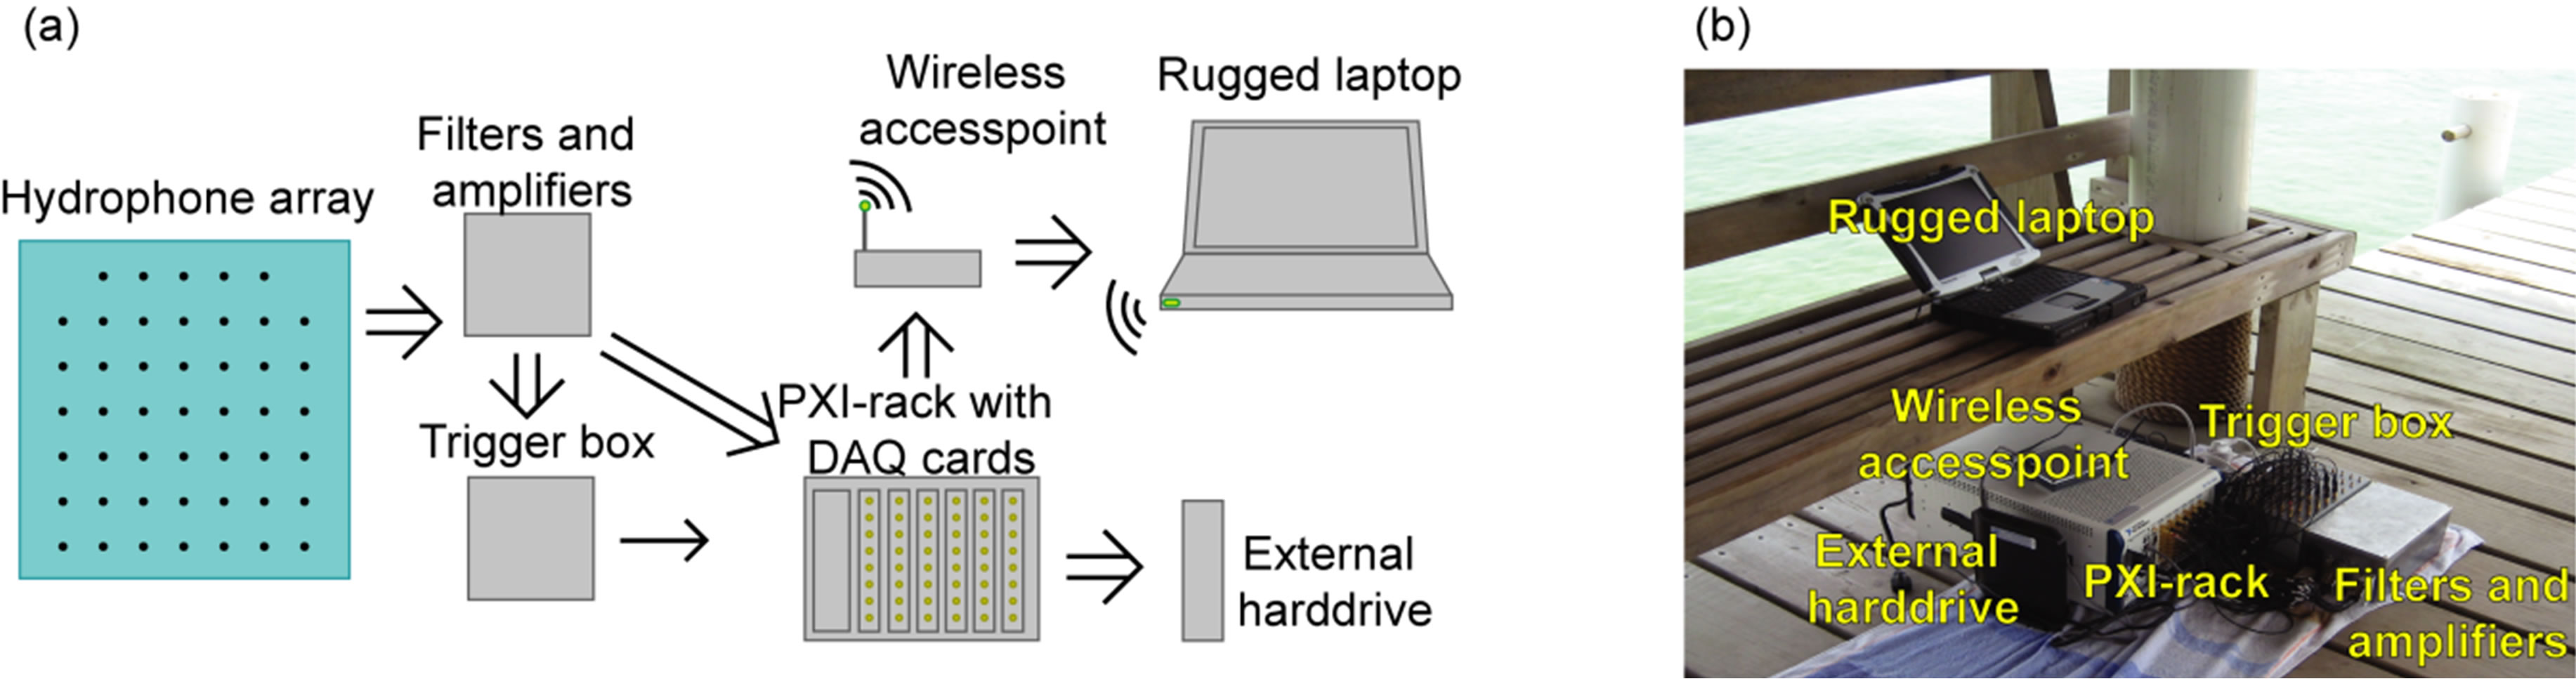
Figure 3. (a) Basic block diagram of the multi-channel data acquisition system; (b) Photo of the basic parts of the system (hydrophones omitted).
The in-house made surface mounted pre-amplification circuitry was constructed of 47 individual low noise, high gain amplifiers (LMH6622), with additional band-pass filters (theoretically estimated –3 dB bandwidth of 23 kHz to 816 kHz). The upper band-pass limit could have been chosen to 500 kHz if it were to be used as an anti-aliasing filter for a sampling rate of 1 MHz. However, it was set higher to reduce suppression of frequency components up to 500 kHz. This allows the system to be used in future studies of potential harmonics from species like the White-beaked dolphin which can produce clicks with frequency components well over 200 kHz [11]. However, such measurements were not in the scope of this particular paper. In fact, an anti-aliasing filter were not needed for the test situations used in this report since no frequency components over 200 kHz were expected or even likely to occur in the planned experiments.
Each LMH6622 chip houses two operational amplifiers (OPs) which allowed the amplification to be made in either one (35 dB) or two steps (35 dB + 15 dB). The amplifiers were connected in negative feedback loops according to the component scheme in Figure 4.
The hydrophones were wired to the positive sides of the OPs and connected to ground via 8.2 kΩ resistors. This was done in order to secure an input impedance matching the high input impedance of the OPs and at the same time allow eventual offset charges in the hydrophone to pass down to ground.
In the high gain case, the two amplification steps were connected in series to each other through a 1.5 nF capacitor. In combination with the 8.2 kΩ resistor, this constitutes a first order high pass filter, further attenuating noise below 13 kHz.
In this application it was necessary that a dolphin echolocation click, reaching over a pre-set trigger value at any of the hydrophones in the array, started a simultaneous acquisition on all channels. This made sure that each click was recorded across the entire array. However, it was only possible to have one trig channel at a time in the PXI-chassis. This obstacle was overcome by designing separate circuitry which summarized the output from all hydrophones after pre-amplification and filtering. The circuitry was based on a low-noise LMH6622 amplifier, see Figure 4. The summarizer output was wired directly to the pre-defined trigger channel on the PXI-system, allowing signals on any of the hydrophones to start a recording.
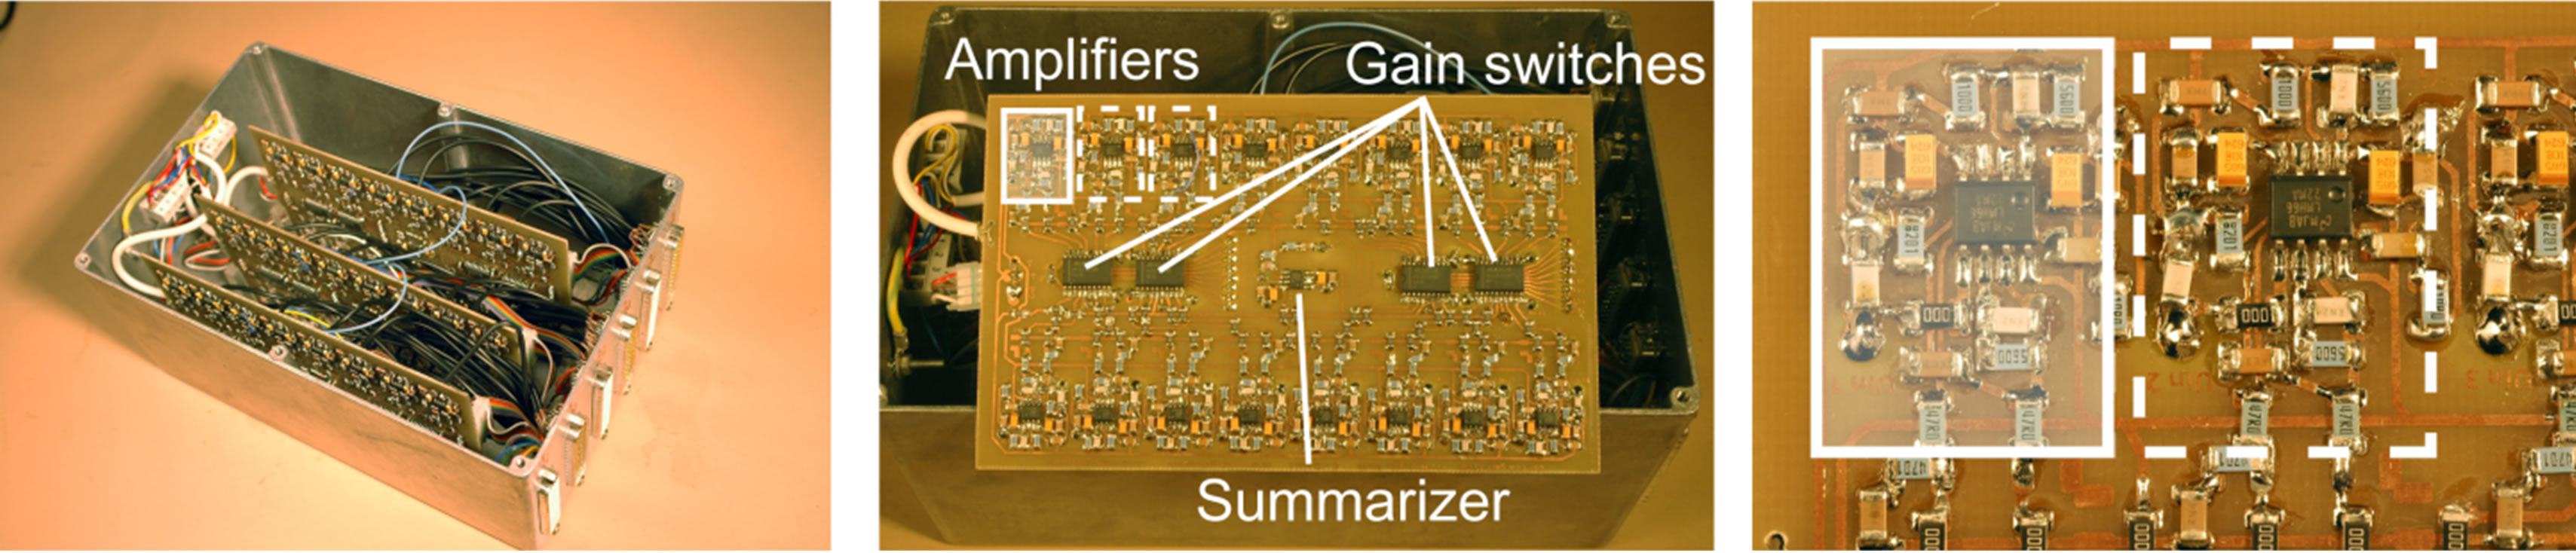
Three individual 10 × 16 cm amplification boards with 16 channels on each were designed as shown in Figure 5. The back of each board is covered with a ground plane. An external hard drive (750 GB FreeAgilent Pro, Seagate Technology LLC) was connected to the PXI-system via the 3 Gbit/s eSATA port (see Figure 3(a)) as storage medium for the data. The hard disk drive allowed a writing speed of 2400 Mbit/s.
2.4. Software Solution
The software design was critical in this application. If it was not optimized for speed and robustness the rearm time would be increased and thus limit the total system performance significantly. Hence, the execution speed was optimized by designing the code so that parallel processing of the dual core processors was possible. The
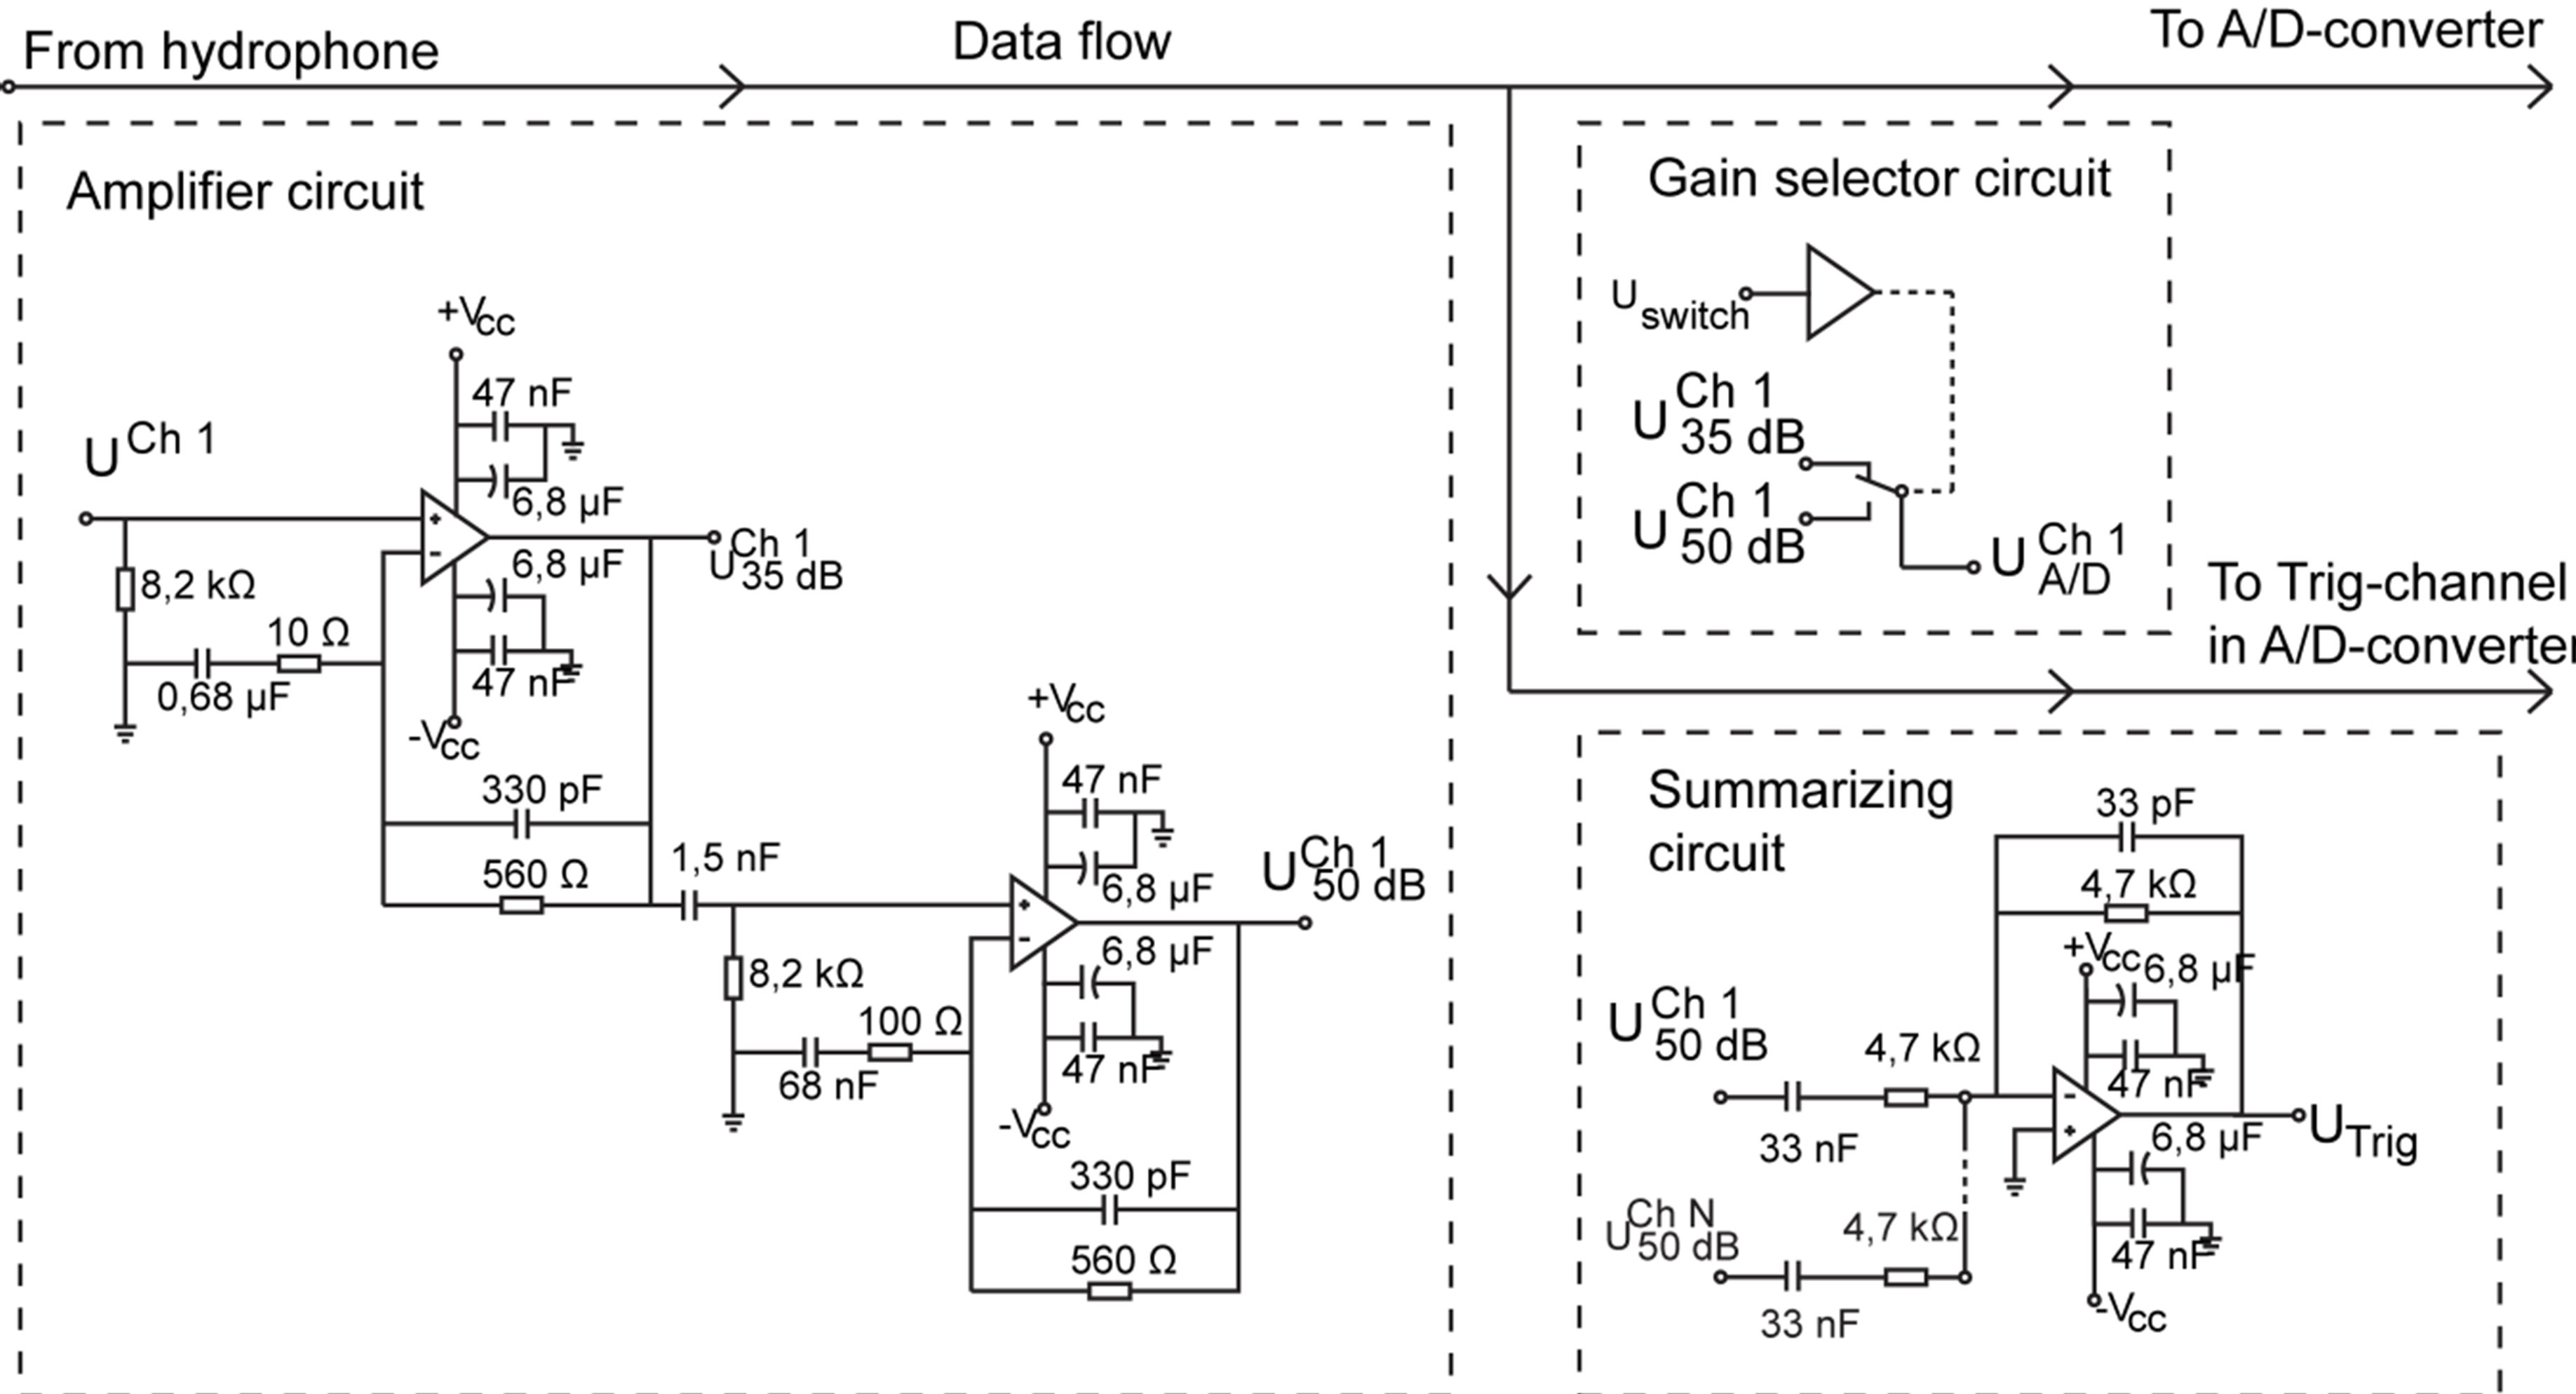
Figure 4. Diagram of the amplifiers, gain selector and summarizer unit.
 (a) (b) (c)
Figure 5. (a) Signal conditioning box containing input and output d-sub connectors, trigger signal output and three amplification boards with 16 channels on each; (b) Circuit board layout with marked components (amplifiers, gain switches and summarizing unit for trig channel); (c) Two magnified units of amplifier circuits (inside the white rectangles) showing the circuit board layout.
data acquisition software was developed in LabVIEW v. 8.6 (National Instruments Corporation, Austin, Texas, US) and allowed streaming of all burst mode triggered samples to files on the external hard drive or on the built in hard drive, and at the same time visualizing data in time and frequency domain in run-time.
The program was built around five individual loops; data acquisition, data streaming to hard drive, data analysis, data visualization and touch screen operation. All loops run autonomously on both processor cores. A large number of measurement software parameters are settable, including trigger level, dynamic voltage range, length of recording time window, pre-trigger length and sampling rate.
The number one priority of the software was to successfully stream data to the hard drive, so that no or as little data as possible was lost in the process. The second priority was to visualize the data. The streaming method used in these experiments is based on LabVIEW’s program package TDMS (specifically designed for fast streaming of multi-channel data).
To further broaden the applications of this system, data acquisition software allowing the system to work also as an acoustically operated “touch screen”, activated by the echolocation beam, was developed. The acoustically operated “touch screen” concept was first reported in [2,3]. The improved software in the present system can be set to respond to both the location, frequency composition and/or the amplitude of the clicks. This feature can be useful for a wide range of cognitive studies of captive animals and serve as a versatile enrichment tool for any facility housing Odontocetes in pools with an underwater window. Despite this, a further evaluation of this function falls outside the focus of this report and has thus not been pursued in this study.
Post-processing software developed in Matlab R2010b (The Math Works, Natick, MA, USA) extracts the recorded TDMS-files and visualizes the results from all channels in the time and frequency domains. It allows the user to zoom in on click train sequences, and re-play the chosen events as videos. The videos can be set to show either each recorded sample, the maximum amplitude of the envelope of the waveforms converted to a 3-dimensional colour coded surface, or the frequency distribution illustrated by power spectra across the array, also coded in colour (see Figure 6). This software made it possible to analyze the recorded data from a biological perspective but also to assess the functionality of the system in the initial tests.
2.5. Tests of the Overall System Performance
The system’s data acquisition performance was evaluated using artificial dolphin clicks with varying ICIs. The click waveforms were generated in LabVIEW, transferred through GPIB (General Purpose Interface Bus) to an Agilent 32250A Arbitrary Waveform Generator and stored in its internal memory. The waveform was transmitted to the PXI system by connecting the waveform generator directly to the inputs of the digitizer cards. The waveform generator was set to down sweep the ICIs from 50 ms to 0.660 ms while the data acquisition program was
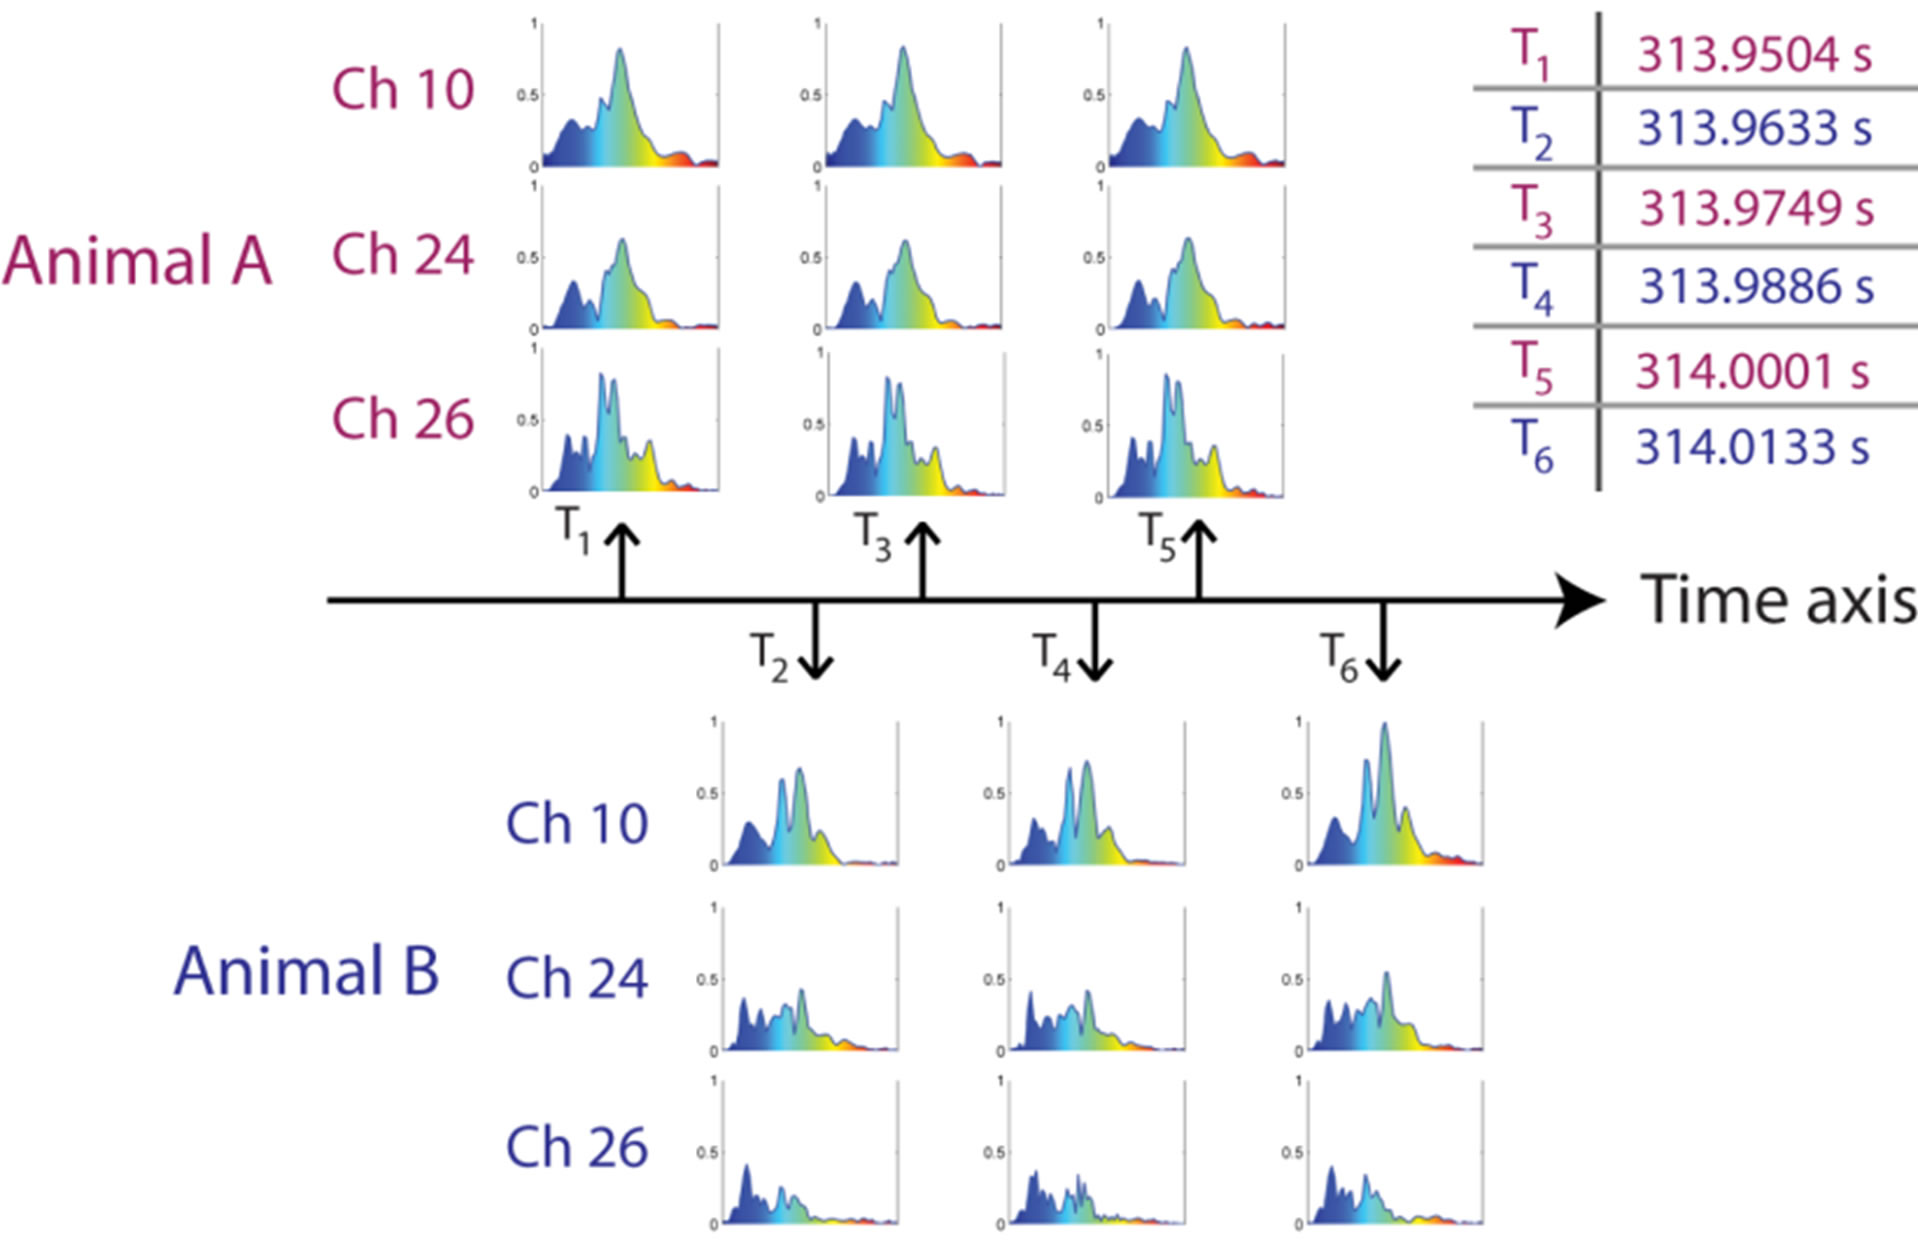
Figure 6. Frequency spectra of six sequential clicks, recorded on three different channels in the hydrophone array. Based on the spectral composition of the clicks, it was concluded that they originate from two dolphins, which click trains overlap in the recordings. The graphs were created during post-processing of the data collected at RIMS, Honduras. (The frequency axes in each subplot range from 1 to 250 kHz.)
acquiring and streaming the data to the hard drive. The shortest ICI possible to record with the system was evaluated by comparing the time stamps of the clicks in the resulting data file with the known value in the benchmark test.
Initial biological tests of the system functionality were conducted at Roatán Institute of Marine Science (RIMS), Roatán, Honduras where there are relatively low levels of reverberant surroundings. A group of 19 bottlenose dolphins (Tursiops truncatus) were kept in a large open sea pen with depth ranging from 0 to 5 meters. The hydrophone array was attached to the rope netting of the pen and placed approximately 1.5 m under the surface of the water. The sea bed was mainly coral sand and silt. During the recordings the dolphins were free-swimming and enticed to echolocate by suspending novel objects in front of the screen.
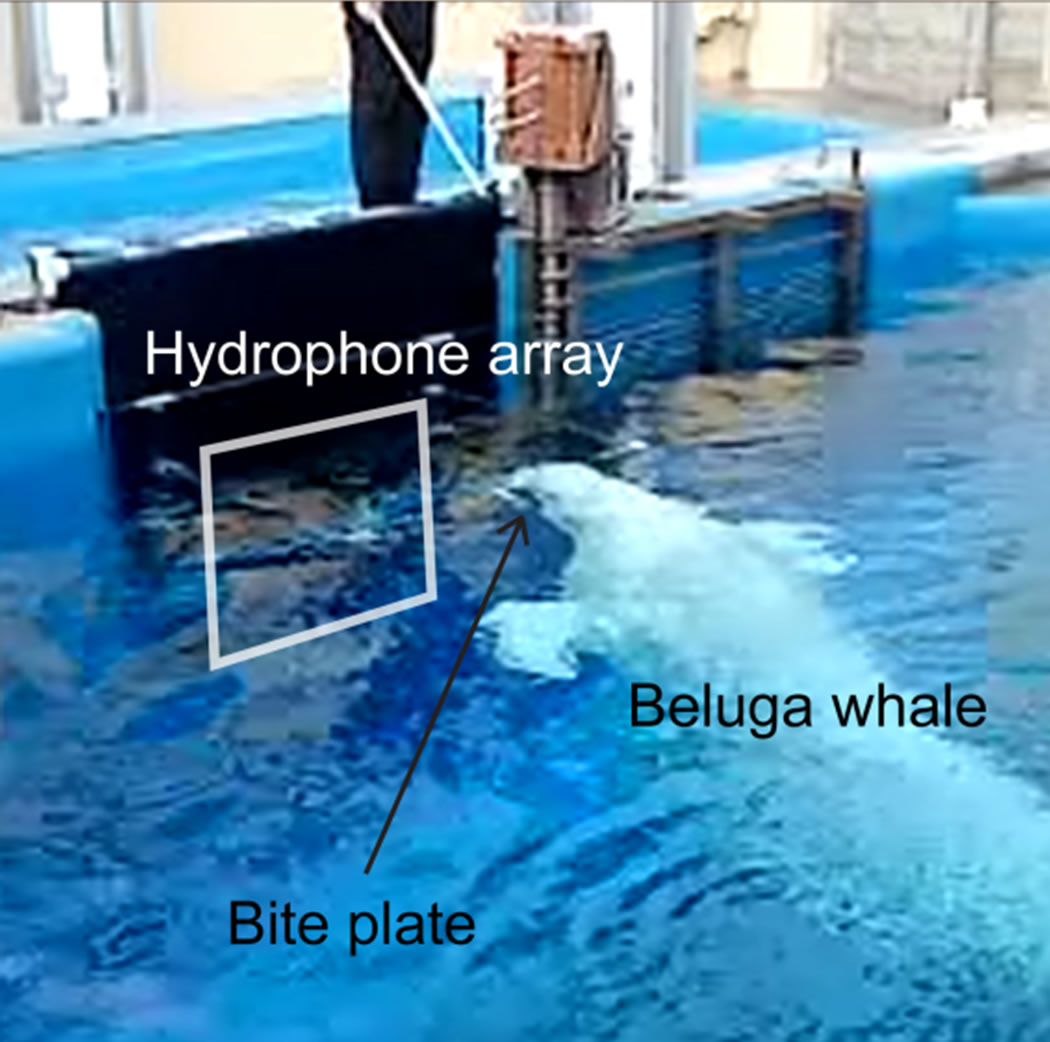
The system’s capability of dealing with a more reverberant surrounding and another species of toothed whales was tested at Sea World, San Diego. Recordings of the echolocation activities of a 28-year-old male beluga whale (Delphinapterus leucas) during approach and stationing on a submerged bite plate were carried out in a concrete pool (see Figure 7(a)). The array was placed 0.6 m under the water surface in a gateway between two pools. The distance from the hydrophone array to the back wall was approximately 5 m. The size of the array in this experiment was set to 0.87 m times 0.87 m.
3. Results and Discussion
3.1. System Benchmark Tests
The benchmark tests of the dual-core optimized version of the data acquisition software show that it is capable of acquiring click trains on all 47 channels with ICIs as short as 833 μs with a 550 μs acquisition window. This allows for any horizontal or vertical bearing angle of the echo locating animal, with no deterioration even with the run-time visualization and analysis features running simultaneously.
It is thereby capable of covering the vast majority of echolocation scenarios where dolphins use echolocation in object investigation, detection and discrimination situations and also most scenarios where pulsed sounds are used in social contexts. However, it may not be possible to capture all clicks in situations where social sounds reach extremely short ICIs (close to 500 μs) as mentioned earlier and when several individuals echolocate simultaneously with short ICIs.
Since the system is capable of streaming data with a data rate of 0.83 MB/s during normal click intervals (20 ms) and up to 20 MB/s under extreme ICIs (833 μs), the length of the recording sessions is determined mostly by the acoustic activity of the animal. Hence, recording ses-
 (a)
(a)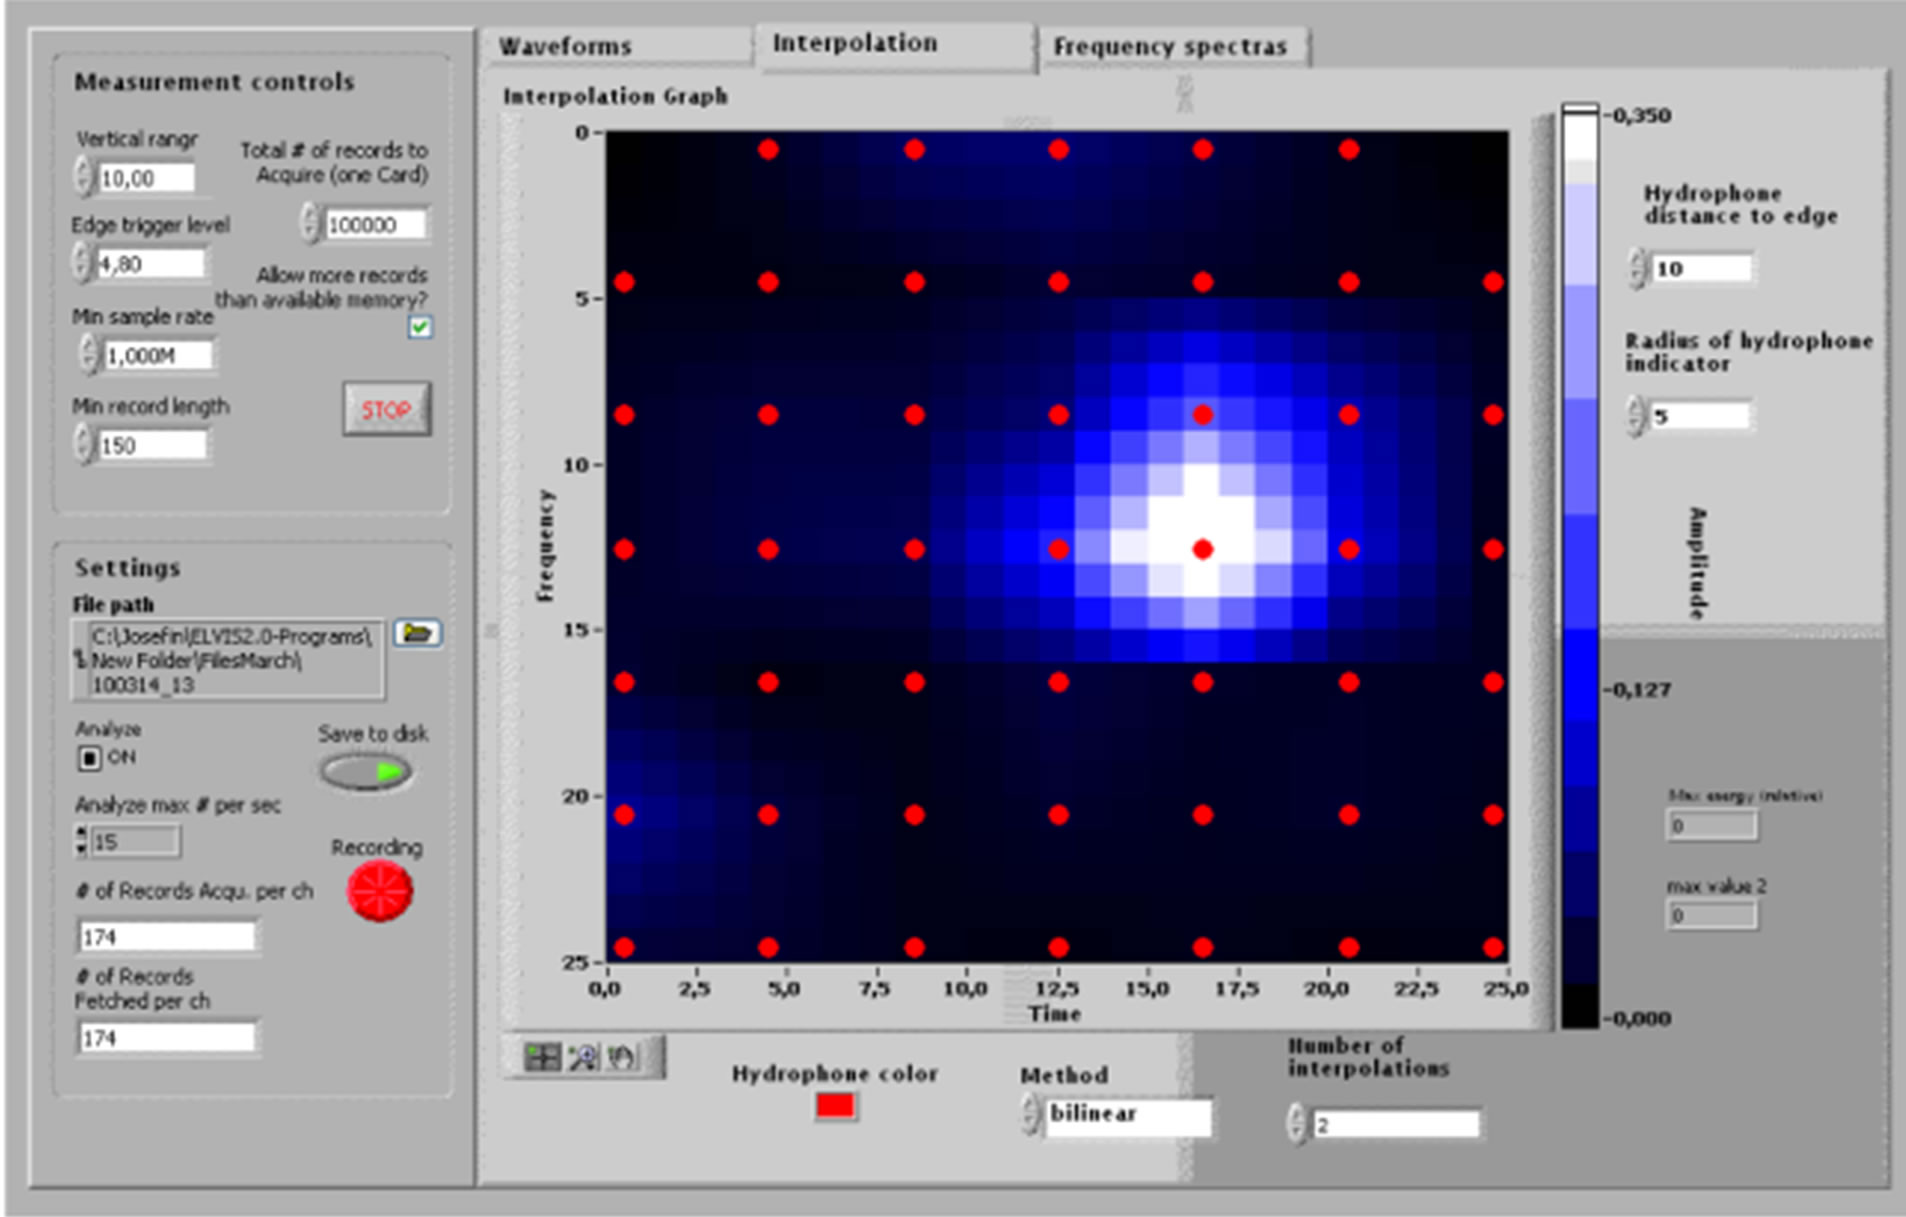 (b)
(b)
Figure 7. (a) Measurements of the echolocation behavior of a beluga whale (Delphinapterus leucas), kept at Sea World, San Diego, under training to station on a bite plate in front of the hydrophone array; (b) Measurement GUI supplying run-time 2-point bi-linearly interpolated amplitude graphs of spontaneous echolocation measured while the beluga whale swam freely in the pool (recording window = 150 µs, sample rate 1 MS/s).
sions can be run up to 20 minutes without interruption if an animal echolocate continuously with an inter-click interval of 20 ms until the file size approaches 1 GB and becomes too large to be convenient to manage in post processing GUIs on regular computers.
It was found that the measured rearm time (833 - 550 μs = 283 μs) is longer than the minimum rearm time stated in the datasheet of the digitizer cards (limited by the minimum rearm time of the internal on-board clock = 2.4 μs). The reason why the system did not come closer to the stated minimum rearm time was not be determined.
The noise level of the entire system chain (after 35 dB amplification and A/D-conversion) was measured to approximately 6.18 mVrms (shallow water ocean noise and electronic noise ≈ 82 dB re 1 μPa/√Hz) during normal field conditions. This is a lower level than the measured voltage quantization of 8.56 mV (143.7 dB re 1 μPa). The maximum measurable sound pressure level was 207 dB re 1 μPa (for 120 kHz signals). The measured –3 dB bandwidth of the amplifiers, set to 35 dB gain, was measured to be 24 kHz to 860 kHz.
The performance of the presented system shows that it is approaching the limit of what is possible to achieve with the present computer based system architecture where multi-channel measurement data has to be streamed through the PCI-bus at the same time as the graphic information and the analysis results. The maximum raw data throughput achieved here was 63 MB/s (550 samples in each sample window × 2 Bytes per sample × 48 channels × 1200 sample windows per second). If even higher throughput is needed, i.e. if even more hydrophones are required in other applications, it is possible to synchronize multiple units, like the one described here. The possibility to synchronize multiple units basically eliminates the theoretical upper limit of how many hydrophones that can be incorporated in one system.
3.2. System Functionality in Field Measurements
The measurement system was able to stream the data recorded during the echolocation activity of the animals at RIMS, a site with low reverberant surroundings, without measurement session crashes or errors. As an example of the recorded data, the frequency amplitude spectra of clicks from a recorded sequence are shown in Figure 6.
Figure 6 shows the frequency spectra of six sequential clicks recorded by channels 10, 24 and 26 during the time period of 313.950 s to 314.013 s, plotted along a time axis. The spectra are normalized to the maximum amplitude of the three channels during the sequence.
It appears that the first, third and fifth spectra for each channel (see upper part of Figure 6) are almost identical and thus most likely originate from the same animal (Animal A). Similarly, the second, fourth and sixth spectra (lower part of the figure) show the same sequential similarities in each channel and thus seem to originate from a second animal (Animal B). Hence, by comparing the spectra from each channel over the entire array in this manner, it is possible to reveal if the sequence contains overlapping click trains from more than one animal.
This method is especially useful if the animals are close to each other when commonly used source localization algorithms (e.g. algorithms based on differences in time of arrivals of clicks) are not precise enough to resolve the two sources. An initial investigation of the frequency correlations between successive clicks from just one of the hydrophones was presented in [17]. However, in future studies it would be possible to extend this approach further to include the signals from all hydrophones in the array.
The measurements at Sea World, San Diego, of the beluga echolocation clicks, during free-swimming approach and stationing on a submerged bite plate in front of the hydrophone array, shows that the system is capable of recording the echolocation activities also in a highly reverberant environment. Figure 7(a) shows the measurement situation and (b) shows a screen dump of the data acquisition user interface while the animal aimed its echolocation beam at the hydrophone array.
The fact that the measurements can be visualized in run time in such a reverberant surrounding further demonstrates the advantage of burst mode recording. Since the system records only the very short direct clicks, and not the reflections that arrive later due to the longer propagation path, the clicks can be correctly visualized. In comparison to continuous recordings, multiple reflections from the surrounding would clutter the data and the entire intensity graph would light up.
Multiple reflections may however be accidentally recorded if the reflected click reaches the array either within the recording time window or if the two way travel time in water is longer than the re-arm time of the system, relative to the recorded time of the direct click. Thus, the system automatically blocks echoes from surrounding reflective surfaces 0.3 m to 0.5 m from the array if a measurement window of 550 µs is used. As a result, the reverberations that can be the most troublesome ones to categorize as reflections since they potentially can resemble the original click in spatial distribution across the array, are automatically blocked.
Hence, the lengths of the recorded time windows can be chosen to fit the distances of the pool walls or other reflective surfaces, relative to the hydrophone array. However, if a very short window is chosen, then the animal needs to be positioned perpendicular in front of the screen. If desired, also the system’s rearm time can be varied accordingly. It is in this way possible to ensure that only the direct clicks and no reflections are recorded. This major advantage of burst mode sampling significantly reduces the clutter of unwanted reflections in between direct clicks, reduces the excess size of data files, enables run-time visualization of data and decreases the post processing time otherwise needed to find, categorize and exclude reverberations. The data obtained in the highly reverberant surrounding in the measurement situation presented in Figure 7 would most likely not have been possible to analyze or even record without the burst mode sampling strategy.
The optional run-time visualizations were 2-point bilinearly interpolated intensity graphs across the array (see Figure 7(b) and similar to 8(b)), waveform plots (see Figure 8(a)) and power spectra plots of signals from all 47 channels. Since the update rate of the computer screen is limited, as well as the ability of the human eye to perceive very rapidly changing pictures, it was sufficient to analyze and present a maximum of 20 clicks per second in run time.
The level of spatial and temporal resolution of the hydrophone system facilitates a detailed view of the frequency composition of the echolocation beam.
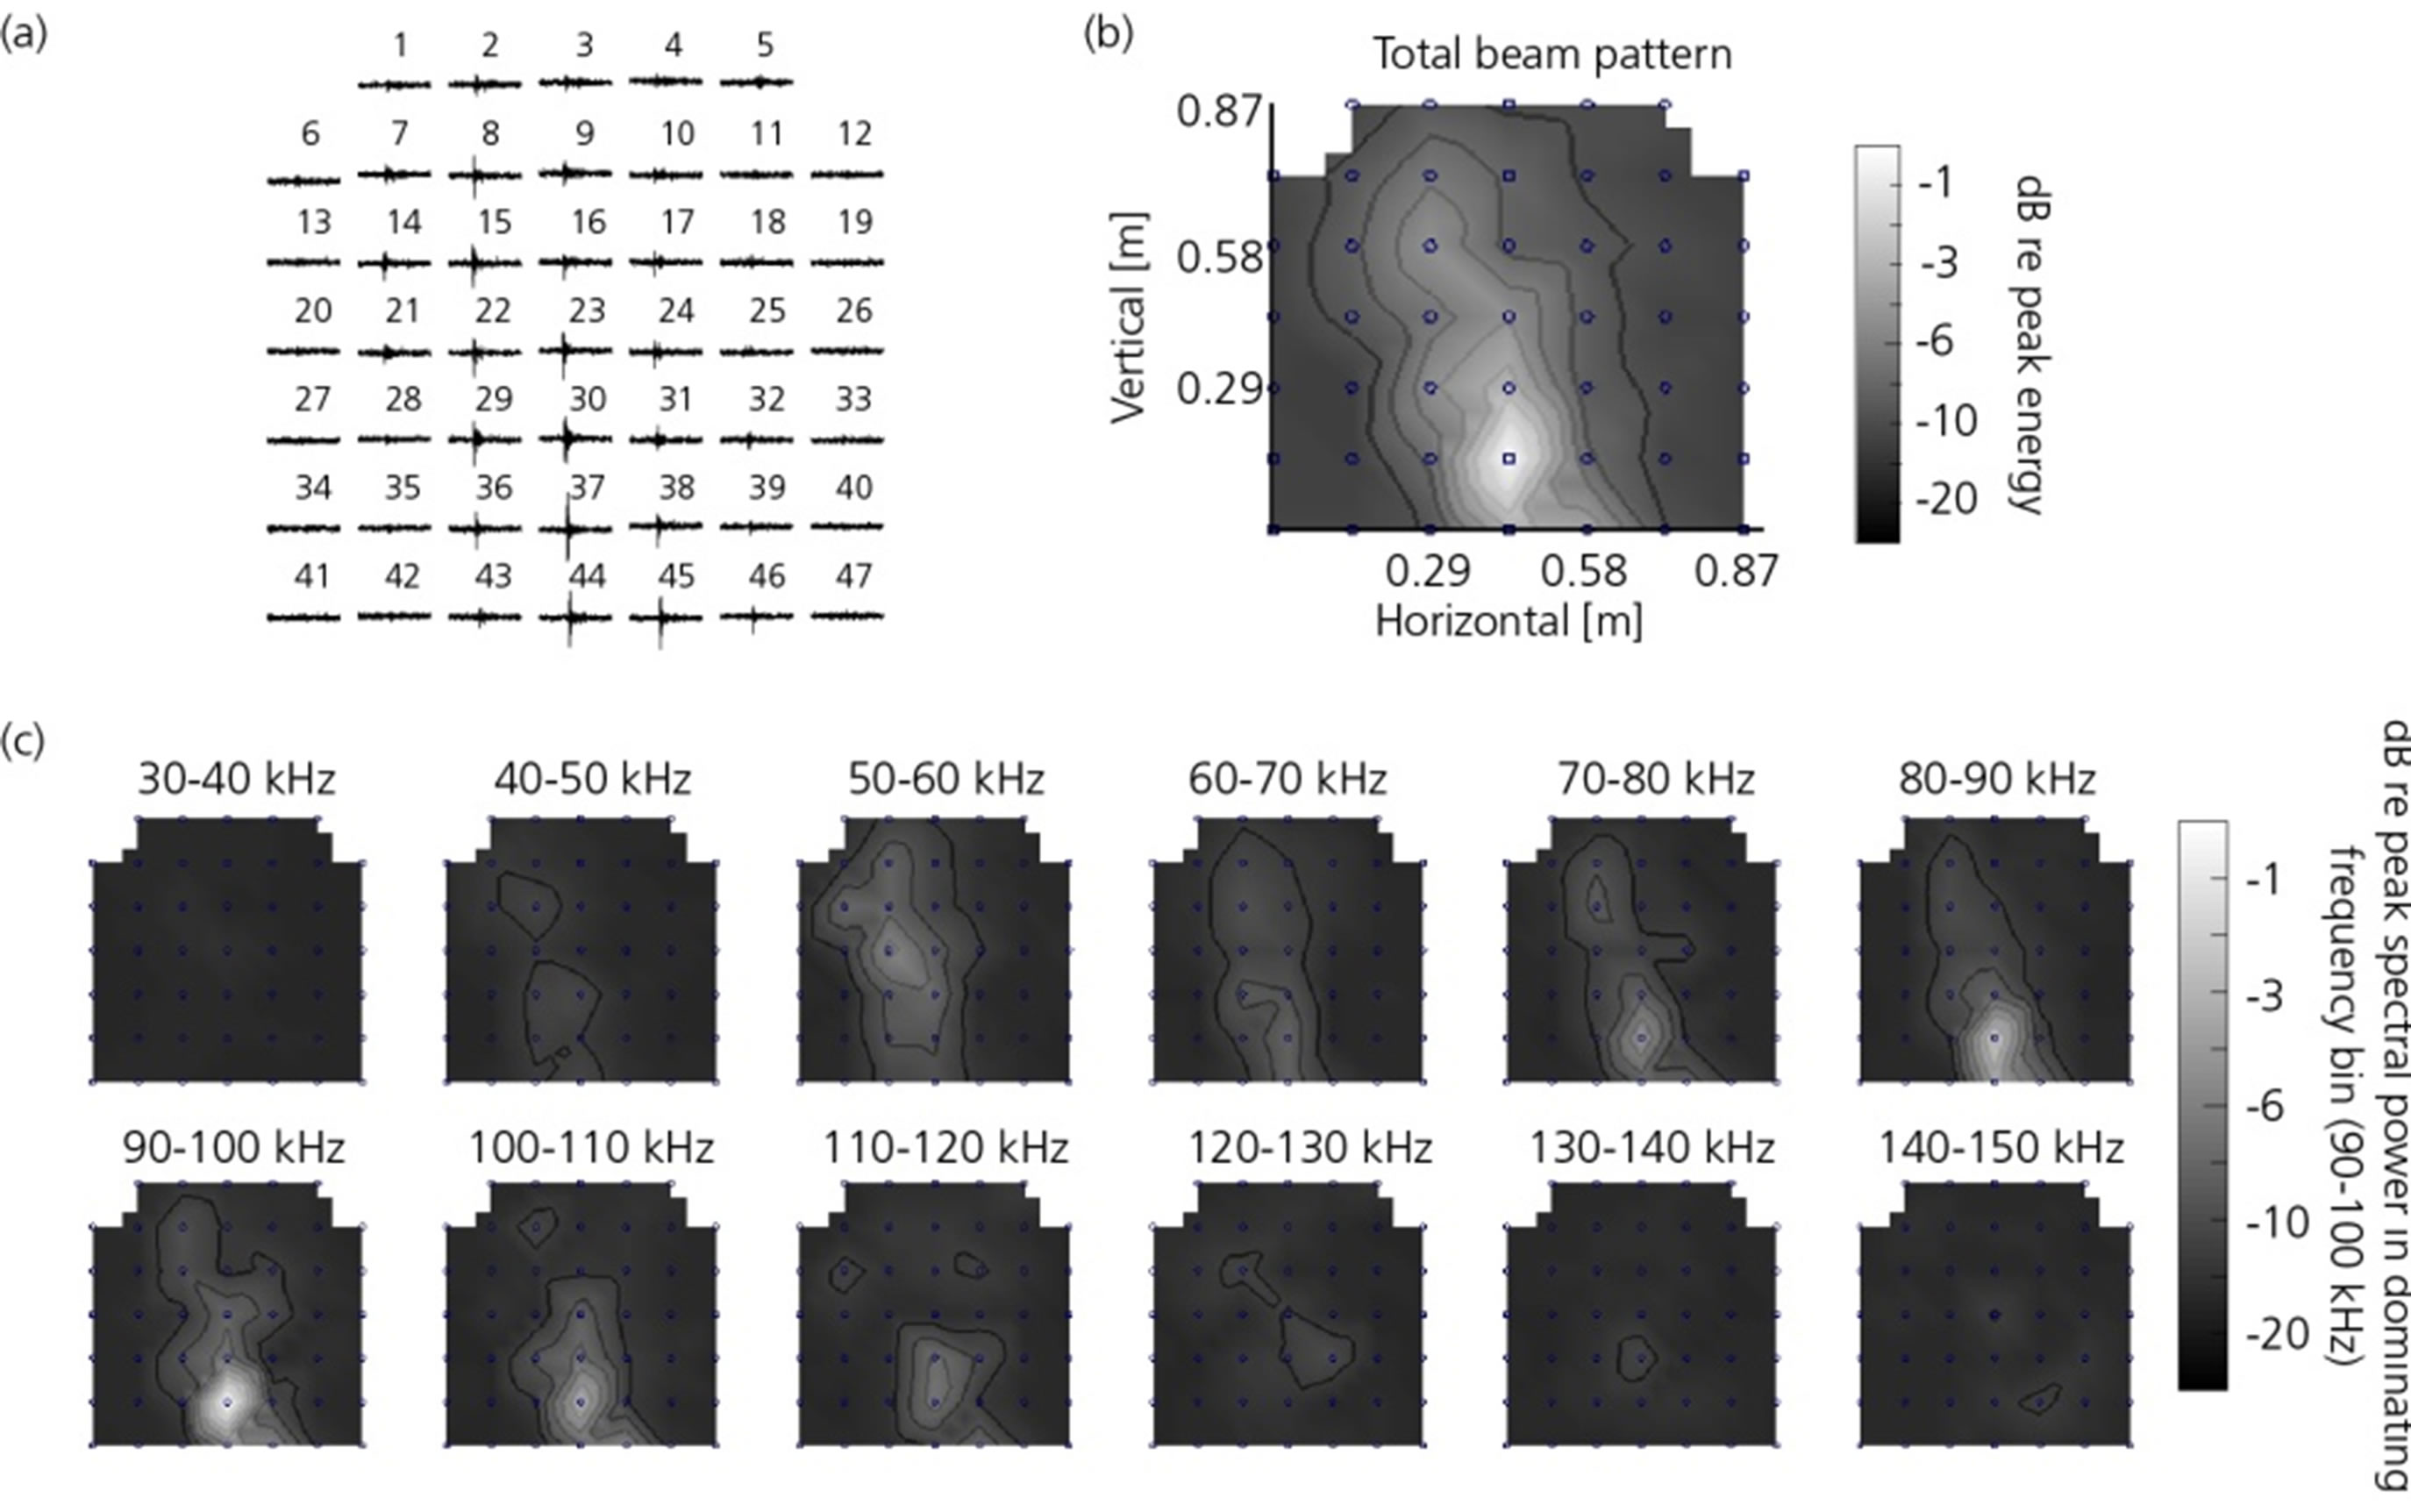
Figure 8. (a) Time domain representation of a beluga whale (Delphinapterus leucas) echolocation click recorded with all 47 hydrophones in the array; (b) Total energy distribution of the click in (a) represented as a surface plot. The surface is created with triangle-based cubic interpolation with a three times finer grid compared to the 47 hydrophone array; (c) The recorded energy within 12 separate 10 kHz frequency bands. The data is visualized with the developed post-processing software.
The plots in Figure 8 are created with the developed post-processing software and show a click recorded from a spontaneously echolocating beluga whale (Delphinapterus leucas) housed at Sea World, San Diego. The animal swam freely inside the concrete pool when this echolocation click was recorded. Figure 8(c) shows that the major energy content of the recorded click is found in the 70 - 110 kHz frequency range and that it is centered at the lower part of the array. Assuming a –3 dB beam width of 6.5˚, this would indicate that the animal was approximately 1 m from the array at the time of measurement. This is a reasonable result considering the dimensions of the pool and the circumstances of the measurements. The visualization modes in Figures 8(a) and (b) has also been implemented as two of the run-time visualizations.
As has been shown, the system allows for recordings of dolphin echolocation with a high spatial resolution during extended periods of time. The analysis tools make it possible to reconstruct and replay many important features of the echolocation behavior of dolphins, even if click trains of more than one dolphin overlap.
It is important to note that these results indicate that the system also is usable with other hydrophone array arrangements than the 2-dimensional matrix used in this study, thus opening the door to recordings of free ranging species in the open sea. As an example it would be possible to use it as a multi channel towed array, facilitating high accuracy in source positioning algorithms [18]. The array used in this study would also make possible recordings of the echolocation beam cross section of species where only sparse recordings with up to four hydrophones has previously been obtained. The more hydrophones in the array, the more likely it is to manage to capture the entire cross section of the echolocation beam. Such recordings would be fundamental for assessing the frequency composition of the beams and thus reveal information about the echolocation capacity and usage for those species. The echolocation recording performance, also in highly reverberant surroundings, such as concrete pools, further strengthens the usefulness of this system in future biosonar research.
4. Conclusions
This report includes a full description of the developed 47-channel system for dolphin echolocation recordings. In addition, the system has been evaluated in laboratory tests as well as through measurements of two different species of the delphinid family in both low reverberant and highly reverberant environments. The presented results show that the system is capable of streaming data from echolocating Odontocetes with an average data rate of 0.83 MB/s during normal click intervals (20 ms) and up to 20 MB/s under extremely short inter-click intervals (833 μs). The hardware and software design in combination with the used burst mode sampling technique allows for longer measurement sessions and more compact raw data files than previously presented systems. These features also allow the system to operate well in highly reverberant surroundings, such as concrete pools where multiple reflections clutter the data.
The run-time visualization options (presenting waveforms, peak acoustic energy and frequency spectra of all channels) and the acoustically operated “touch screen” option can be used at the same time as data is streamed to the hard drive. This was realized by a programming technique allowing for parallel operation of the dual cores of the PXI-controller in combination with the burst mode sampling technique. The visualizations make it possible to follow the acoustic activity of the animals in run-time during the recordings and also to facilitate immediate evaluation and adjustments of the measurement settings.
The developed post-processing software showed that details like the frequency composition across the beam and the frequency variability from click to click can be studied in detail, exemplified by measurements taken at two measurement sites; bottlenose dolphins in a natural habitat and a beluga whale in a concrete pool.
The presented performance of the system shows that it can be used as a research tool in a variety of bio-acoustic investigations, such as advanced studies of Odontocete echolocation and cognition, carried out both in manmade habitats and in the open ocean. Examples of such studies are those involving the animals’ echolocationbased object investigation strategies as well as basic studies of the beam amplitude and frequency composition of wild animals. The possibility to expand the system to incorporate even more hydrophones makes it useful for a wide range of applications and hence may constitute a useful tool in this field of research.
5. Acknowledgements
We thank all colleagues and friends that helped us during the practical assembly of the system and thank Teri and Eldon Bolton of the Roatán Institute of Marine Science for their time and generous contributions to the field measurements.
Sea World and the Wild Arctic team at Sea World, San Diego is greatly acknowledged for their generosity and ambitious work with the beluga whale for this research project. The National Instrument support team also contributed with valuable input during the development of the data acquisition software.
REFERENCES
- P. J. Miller and P. L. Tyack, “A Small Towed Beamforming Array to Identify Vocalizing Resident Killer Whales (Orcinus orca) Concurrent with Focal Behavioral Observations,” Deep-Sea Research Part II, Vol. 45, No. 7, 1998, pp. 1389-1405. doi:10.1016/S0967-0645(98)00028-9
- J. Starkhammar, M. Amundin, H. Olsén, M. Ahlmqvist, K. Lindstrom and H. W. Persson, “Acoustic Touch Screen for Dolphins First application of ELVIS—an Echo-Location Visualization and Interface System,” Proceedings of the Institute of Acoustics, Vol. 29, Loughborough University, Loughborough, 2007, pp. 55-60.
- M. Amundin, J. Starkhammar, M. Evander, M. Almqvist, K. Lindstrom and H. W. Persson, “An Echolocation Visualization and Interface System for Dolphin Research,” Journal of the Acoustical Society of America, Vol. 123, No. 2, 2008, pp. 1188-1194. doi:10.1121/1.2828213
- P. W. Moore, L. A. Dankiewicz and D. S. Houser, “Beamwidth Control and Angular Target Detection in an Echolocating Bottlenose Dolphin (Tursiops truncatus),” Journal of the Acoustical Society of America, Vol. 124, No. 5, 2008, pp. 3324-3332. doi:10.1121/1.2980453
- M. Johnson and P. Tyack, “A Digital Acoustic Recording Tag for Measuring the Response of Wild Marine Mammals to Sound,” IEEE Journal of Oceanic Engineering, Vol. 28, No. 1, 2003, pp. 3-12. doi:10.1109/JOE.2002.808212
- J. Starkhammar, M. Amundin, J. Nilsson, T. Jansson, S. Kuczaj, M. Almqvist and H. W. Persson, “47-Channel Burst Mode Recording Hydrophone System Enabling Measurements of the Dynamic Echolocation Behavior of Free-Swimming Dolphins,” Journal of the Acoustical Society of America, Vol. 126, No. 3, 2009, pp. 959-962. doi:10.1121/1.3184536
- W. W. L. Au, “The Sonar of Dolphins,” Springer, New York, 1993. doi:10.1007/978-1-4612-4356-4
- W. W. L. Au, “Echolocation Signals of the Atlantic Bottlenose Dolphin (Tursiops truncatus) in Open Waters,” In: R. G. Busnel and J. F. Fish, Eds., Animals Sonar Systems, Plenum Press, New York, 1980, pp. 251-282.
- M. Fahner, J. Tomas, K. Ramirez and J. Boehm, “Acoustic Properties of Echolocation Signals by Captive Pacific White-Sided Dolphins (Lagenorhynchus obliquidens),” In: J. A. Thomas, C. F. Moss and M. Vater, Eds., Echolocation in Bats and Dolphins, University of Chicago Press, Chicago, 2004, pp. 53-59.
- M. O. Lammers, W. W. L. Au, R. Aubauer and P. E. Nachtigall, “A Comparative Analysis of the Pulsed Emissions of Free-Ranging Hawaiian Spinner Dolphins (Stenella longirostris),” In: J. A. Thomas, C. F. Moss and M. Vater, Eds., Echolocation in Bats and Dolphins, University of Chicago Press, Chicago, 2004, pp. 414-419.
- M. H. Rasmussen and L. A. Miller, “Echolocation and Social Signals from White-Beaked Dolphin, Lagenorhynchus albirostris, Recorded in Icelandic Waters,” In: J. A. Thomas, C. F. Moss and M. Vater, Eds., Echolocation in Bats and Dolphins, University of Chicago Press, Chicago, 2004, pp. 50-53.
- D. L. Herzing, “Vocalizations and Associated Underwater Behavior of Free-Ranging Atlantic Spotted Dolphins, Stenella frontalis and Bottlenose dolphins, Tursiops truncates,” Aquatic Mammals, Vol. 22, No. 2, 1996, pp. 61-79.
- D. L. Herzing, and M. E. dos Santos, “Functional Aspects of Echolocation in Dolphins,” In: J. A. Thomas, C. F. Moss and M. Vater, Eds., Echolocation in Bats and Dolphins, University of Chicago Press, Chicago, 2004, pp. 386-393.
- J. Starkhammar, P. W. B. Moore, L. Talmadge and D. S. Houser, “Frequency-Dependent Variation in the Two-Dimensional Beam Pattern of an Echolocating Dolphin,” Biology Letters, Vol. 7, No. 6, 2011, pp. 836-839. doi:10.1098/rsbl.2011.0396
- W. W. L. Au, R. H. Penner and C. W. Turl, “Propagation of Beluga Echolocation Signals,” Journal of the Acoustical Society of America, Vol. 82, No. 3, 1987, pp. 807-813. doi:10.1121/1.395278
- W. W. L. Au, R. W. Floyd and J. E. Haun, “Propagation of Atlantic Bottlenose Dolphin Echolocation Signals,” Journal of the Acoustical Society of America, Vol. 64, No. 2, 1978, pp. 411-422. doi:10.1121/1.382015
- J. Starkhammar, J. Nilsson, M. Amundin, T. Jansson, M. Almqvist and H. W. Persson, “Separating Overlapping Dolphin Click Trains Originating from Multiple Individuals in Echolocation Recordings,” Journal of the Acoustical Society of America, Vol. 129, No. 1, 2011, pp. 458-466. doi:10.1121/1.3519404
- P. T. Madsen and M. Wahlberg “Recording and Quantification of Ultrasonic Echolocation Clicks from Free- Ranging Toothed Whales,” Deep Sea Research, Vol. 54, No. 8, 2007, pp. 1421-1444.