Advances in Materials Physics and Chemistry
Vol.3 No.5(2013), Article ID:36812,26 pages DOI:10.4236/ampc.2013.35037
Thermodynamic Aspects of the Graphene/Graphane/Hydrogen Systems: Relevance to the Hydrogen On-Board Storage Problem
1Bardin Institute for Ferrous Metallurgy, Kurdjumov Institute of Metals Science and Physics, Vtoraya Baumanskaya St., Moscow, Russia
2International Association for Hydrogen Energy, Miami, USA
Email: *yuri1939@inbox.ru
Copyright © 2013 Yury S. Nechaev, T. Nejat Veziroglu. This is an open access article distributed under the Creative Commons Attribution License, which permits unrestricted use, distribution, and reproduction in any medium, provided the original work is properly cited.
Received June 25, 2013; revised July 26, 2013; accepted August 12, 2013
Keywords: Hydrogenated Graphene Layers; Graphanes; Thermodynamic Stability; Solid Hydrogen Intercalated into Hydrogenated Graphite Nanofibers; Hydrogen On-Board Storage
ABSTRACT
The present analytical review is devoted to the current problem of thermodynamic stability and related thermodynamic characteristics of the following graphene layers systems: 1) double-side hydrogenated graphene of composition CH (theoretical graphane) (Sofo et al. 2007) and experimental graphane (Elias et al. 2009); 2) theoretical single-side hydrogenated graphene of composition CH; 3) theoretical single-side hydrogenated graphene of composition C2H (graphone); 4) experimental hydrogenated epitaxial graphene, bilayer graphene and a few layers of graphene on SiO2 or other substrates; 5) experimental and theoretical single-external side hydrogenated single-walled carbon nanotubes, and experimental hydrofullerene C60H36; 6) experimental single-internal side hydrogenated (up to C2H or CH composition) graphene nanoblisters with intercalated high pressure H2 gas inside them, formed on a surface of highly oriented pyrolytic graphite or epitaxial graphene under the atomic hydrogen treatment; and 7) experimental hydrogenated graphite nanofibers-multigraphene with intercalated solid H2 nano-regions of high density inside them, relevant to solving the problem of hydrogen on-board storage (Nechaev 2011-2012).
1. Introduction
As noted in a number of articles from 2007 through 2013, hydrogenation of grapheme—a single layer of carbon atoms arranged in a honeycomb lattice—as a prototype of covalent chemical functionality, and an effective tool to open the band gap of graphene is of fundamental importance [1,2].
It is relevant to the current problem of hydrogen onboard storage, and also to the related problems of thermodynamic stability and thermodynamic characteristics of the following systems: 1) double-side hydrogenated graphene (theoretical graphane of composition CH [3,4] and experimental graphane [5]); 2) theoretical single-side hydrogenated graphene of composition CH (SSHG) [6-8]; 3) theoretical single-side hydrogenated grapheme of composition C2H (graphone) [9]; 4) experimental hydrogenated epitaxial graphene, bigraphene and a few layer graphene on SiO2 or other substrates [5]; 5) experimental and theoretical single-external-side hydrogenated single-walled carbon nanotubes of composition about C2H and experimental hydrofullerene C60H36 [10-14]; 6) experimental single-internal-side hydrogenated graphene nanoblisters possessing of a very high Young’s modulus (with intercalated high pressured H2 gas) formed on the surface of highly oriented pyrolytic graphite (HOPG) or epitaxial graphene under the definite atomic hydrogen treatment [15-21]; and 7) experimental hydrogenated graphite nanofibers possessing of a high Young’s modulus with intercalated high density solid H2 that is relevant to the problem of hydrogen on-board storage [18- 21].
In this analytical review, results of thermodynamic analysis and comparison of some theoretical and experimental data are presented, including those from the most cited works [3,5] and from the least non-cited works [18- 21].
In [8], the double-side hydrogenation of graphene is now well understood, at least from a theoretical point of view. For example, Sofo et al. predicted theoretically a new insulating material of CH composition called graphane (double-side hydrogenated graphene), in which each hydrogen atom is adsorbed on top of a carbon atom from both sides, so that the hydrogen atoms adsorbed in different carbon sublattices are on different sides of the monolayer plane [3]. The formation of graphane was attributed to the efficient strain relaxation for sp3 hybridization, accompanied by a strong (diamond-like) distortion of the graphene network [3,22]. In contrast to graphene (a zero-gap semiconductor), graphane is an insulator with an energy gap of Eg » 5.4 eV [4,23]. Only if hydrogen atoms adsorbed on one side of graphene (in graphane) are retained, we obtain graphone of C2H composition, which is a magnetic semiconductor with Eg » 0.5 eV and a Curie temperature of Tc » 300 - 400 K [24].
As was noted in [6], neither graphone nor graphane is suitable for real practical applications, since the former has a low value of Eg, and undergoes a rapid disordering because of hydrogen migration to neighboring vacant sites even at a low temperature, and the latter cannot be prepared on a solid substrate [9].
Single-side hydrogenated graphene (SSHG) of CH composition is an alternative to graphane, in which hydrogen atoms are adsorbed only on one side [7,25]. In contrast to graphone, they are also adsorbed on all carbon atoms rather than on every second carbon atom. The value of Eg in SSHG is sufficiently high (1.6 eV lower than in graphane), and it can be prepared in a solid substrate in principle. However, this quasi-two-dimensional carbon-hydrogen theoretical system is shown to have a relatively low thermal stability, which makes it difficult to use SSGG in practice [6,7].
As seen in [7], it may be inappropriate to call the covalently bonded SSHG system sp3 hybridized, since the characteristic bond angle of 109.5˚ is not present anywhere, i.e., there is no diamond-like strong distortion of the graphene network, rather than in graphane. Generally in the case of a few hydrogen atoms interacting with graphene or even for graphane, the underlining carbon atoms are displaced from their locations. For instance, there may be the diamond-like local distortion of the graphene network, showing the signature of sp3 bonded system. However, in SSH Graphene all the carbon atoms remain in one plane, making it difficult to call it sp3 hybridized. Obviously, this is some specific sp3-like hybridization. Such model is taken into further consideration in this analytical study [10-21].
In a number of works, it shows that hydrogen chemisorption corrugates the graphene sheet in fullerene, carbon nanotubes [26], graphite [27] and graphene [28] and transforms it from a semimetal into a semiconductor [3,5]. This can even induce magnetic moments [29-31].
It is worth repeating the prediction for the double-side hydrogenated graphene (a free-standing membrane) that was partially confirmed by Elias et al. [5]. They demonstrated that graphene can react with atomic hydrogen, which transforms this highly conductive zero-overlap semimetal into an insulator of high thermal stability, and the double-side hydrogenation of graphene is reversible. The authors themselves expressed some doubts, relevant to the complete adequacy of the experimental graphane to the theoretical one [3]. Alternatively, they supposed that the experimental graphane (a free-standing membrane) produced by them may have a more complex hydrogen bonding than the one suggested by the theory, and that the latter may be as an “until now theoretical material”.
In the case of epitaxial graphene on substrates such as SiO2 and others, hydrogenation occurs only on the top basal plane of graphene, and it is not accompanied with a strong (diamond-like) distortion of the graphene network, but only with some ripples. The first experimental indication of such a specific single-side hydrogenation came from Elias et al. [5]. The authors mentioned a possible contradiction with the theoretical results of Sofo et al. [3], which had down-played the possibility of a single side hydrogenation. They proposed an important facilitating role of the material ripples for hydrogenation of graphene on SiO2, and believed that such a single-side hydrogenated epitaxial graphene can be a disordered material, similar to graphene oxide, rather than a new graphenebased crystal—the experimental graphane produced by them.
On the other hand, it is expedient to note that changes in Raman spectra of graphene caused by hydrogenation were rather similar (with respect to locations of D, G, D’, 2D and (D + D’) peaks) both for the epitaxial graphene on SiO2 and for the free-standing graphene membrane [5].
As it is supposed by many scientists, such a single side hydrogenation of epitaxial graphene occurs, because the diffusion of hydrogen along the graphene-SiO2 interface is negligible, and perfect graphene is impermeable to any atom and molecule [32]. But these two aspects are of the kinetic character, and therefore they can not influence the thermodynamic predictions [3,24,31].
Authors of [8] noted that their test calculations show that the barrier for the penetration of a hydrogen atom through the six-membered ring of graphene is larger than 2.0 eV. Thus, they believe that it is almost impossible for a hydrogen atom to pass through the six-membered ring of graphene at room temperature (from a private communication with H. G. Xiang and M.-H. Whangbo).
In the present analytical review, a real possibility is considered when a hydrogen atom can pass through the graphene network at room temperature. This is the case of existing relevant defects in graphene, i.e., in grain boundaries and/or vacancies [33-42]. This is related to further consideration of data in this analytical study as mentioned above.
Previous theoretical studies suggest that single-side hydrogenation of ideal graphene would be thermodynamically unstable [24,31]. Thus, it remains a puzzle why the single-side hydrogenation of epitaxial graphene is possible and even reversible, and why the hydrogenated species are stable at room temperatures [5,43]. This puzzling situation is also considered in the present analytical review. The main aim of this study is to show a real possibility, at least, from the thermodynamic point of view, of the existence of hydrogenated graphene-based nanostructures [18-21] possessing very high Young’s modulus, and also showing a real possibility of intercalation in nanostructures of solid molecular hydrogen under definite hydrogenation conditions relevant to the current problem of hydrogen on-board storage.
2. Analysis and Comparison of Data
2.1. Consideration of Data on Theoretical Graphanes
In work [3], the stability of graphane, a fully saturated extended two-dimentional hydrocarbon derived from a single graphene sheet with formula CH, has been predicted on the basis of the first principles and total-energy calculations. All of the carbon atoms are in sp3 hybridization forming a hexagonal network (a strongly diamond-like distorted graphene network) and the hydrogen atoms are bonded to carbon on both sides of the plane in an alternative manner. It has been found that graphane can have two favorable conformations: a chair-like (diamond-like, Figure 1) conformer and a boat-like (zigzag-
Figure 1. Structure of the theoretical graphane in chair configuration. The carbon atoms are shown in gray and the hydrogen atoms in white. The figure shows the diamondlike distorted hexagonal network with carbon in sp3 hybridization [3].
like) conformer [3].
The diamond-like conformer (Figure 1) is more stable than the zigzag-like one. This was concluded from the results of the calculations of binding energy ( ) (i.e., the difference between the total energy of the isolated atoms and the total energy of the compounds), and the standard energy of formation (
![]() ) of the compounds (
) of the compounds ( ) from crystalline graphite (
 ) and gaseous molecular hydrogen (
 ) at the standard pressure and temperature conditions [3].
For the diamond-like graphane, the former quantity is
 and the latter one is
![]() .
.
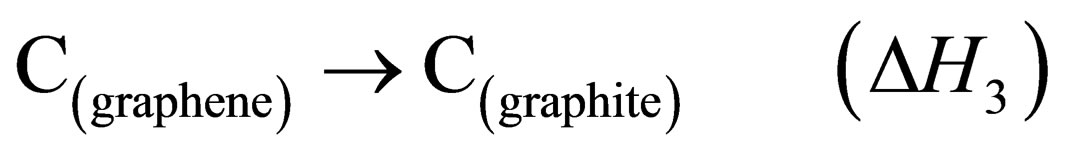
The latter quantity corresponds to the following reaction:
 (1)
(1)
where ![]() is the standard energy (enthalpy) change for this reaction.
is the standard energy (enthalpy) change for this reaction.
By using the theoretical quantity of![]() , one can evaluate, using the framework of the thermodynamic method of cyclic processes [44], a value of the energy of formation (
, one can evaluate, using the framework of the thermodynamic method of cyclic processes [44], a value of the energy of formation ( ) of graphane (
 ) from graphene (
 ) and gaseous atomic hydrogen (
 ) [3]. For this, it is necessary to take into consideration the following three additional reactions:
 (2)
(2)
 (3)
(3)
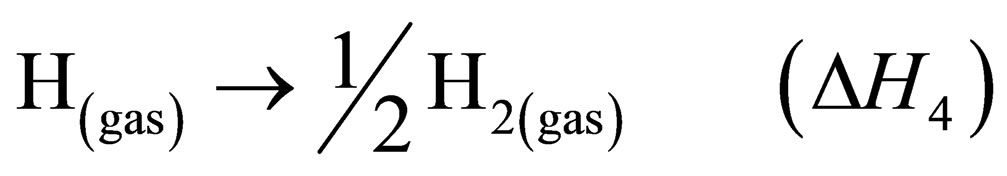 (4)
(4)
where ,
,  and
and  are the standard energy (enthalpy) changes.
Reaction (2) can be presented as a sum of reactions (1), (3) and (4) using the framework of the thermodynamic method of cyclic processes [44]:
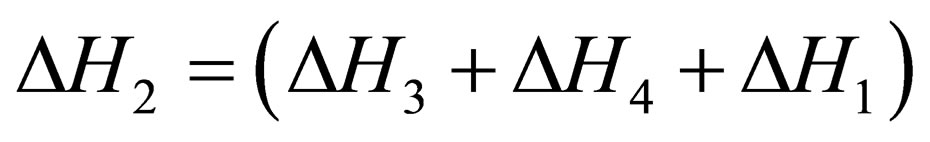 (5)
(5)
Substituting in Equation (5) the known experimental values of  = −2.26 eV/atom and
  » −0.05 eV/atom, and also the theoretical value of
 ![]() = −0.15 эВ/atom, one can obtain a desired value of
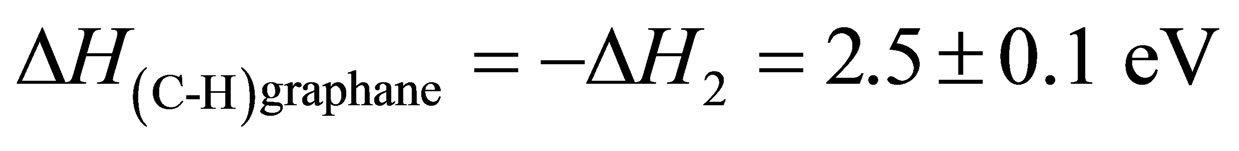
= −0.15 эВ/atom, one can obtain a desired value of  = −2.5 ± 0.1 eV/atom. The quantity of
  characterizes the break-down energy of C-H sp3 bond in graphane (Figure 1), relevant to the breaking away of one hydrogen atom from the material, which is
 .
.
In evaluating the above mentioned value of ∆H3, one can use the experimental data [45] on the graphite sublimation energy at 298 K
( )and the theoretical data [25] on the binding cohesive energy at about 0 K for graphene
( ).
).
Therefore, neglecting the temperature dependence of these quantities in the interval of 0 - 298 K, and one obtains the value of .
.  quantity characterizes the break-down energy of 1.5 C-C sp2 bond in graphene, relevant to the breaking away of one carbon atom from the material. Consequently, one can evaluate the break-down energy of C-C sp2 bonds in graphene, which is
 .
.
This theoretical quantity coincides with the similar empirical quantities obtained in [18-21] from  for C-C sp2 bonds in graphene and graphite, which are
 .
.
The similar empirical quantity for C-C sp3 bonds in diamond obtained from the diamond sublimation energy  is
is
 [18-21].
It is important to note that chemisorption of hydrogen on graphene was studied using atomistic simulations, with a second generation reactive empirical bond order of Brenner inter-atomic potential. As it has been shown, the cohesive energy of graphane (CH) in the ground state is  (C). This results in the binding of hydrogen energy, which is
 (H) [25].
The theoretical  quantity characterizes the break-down energy of one C-H sp3 bond and 1.5 C-C sp3 bonds (Figure 1). Hence, by using the above mentioned values of
  and
and , one can evaluate the break-down energy of C-C sp3 bonds in the theoretical graphane, which is
 . Also, by using the above noted theoretical values of
  and
and , one can evaluate similarly the break-down energy of C-C sp3 bonds in the theoretical graphane, which is
 . Comparing the obtained values of
 ,
,  ,
,  ,
,  and
and  show that the elastic and intrinsic strength properties, and particularly, the Young’s modulus of the theoretical graphanes is much less than those for perfect graphene, perfect graphite or perfect diamond [1,3,25].
2.2. Consideration of Data on Hydrogen Thermal Desorption from Theoretical and Experimental Graphanes
In [4], the process of hydrogen thermal desorption from graphane has been studied using the method of molecular dynamics. The temperature dependence for T = 1300 - 3000 K at the time ( ) of hydrogen desorption onset (i.e., the time of removal ~1% (
 ) of the initial hydrogen concentration C0 » 0.5 (in atomic fractions,
 ) from the C54H7(54 + 18) clustered with 18 hydrogen passivating atoms at the edges to saturate the dangling bonds of sp3-hybridized carbon atoms have been calculated. The corresponding activation energy of Ea = 2.46 ± 0.17 eV and the corresponding near temperature independent frequency factor
  have also been calculated. The process of hydrogen desorption at T = 1300 - 3000 K has been described in terms of the following standard Arrhenius relationship:
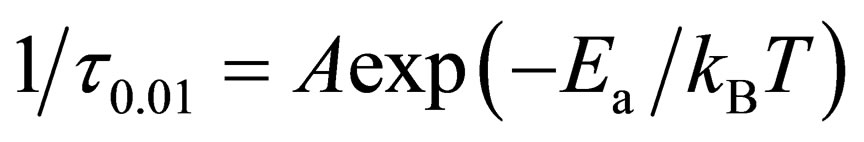 (6)
(6)
where kB is the Boltzmann constant. The authors predicted that their results would not contradict the experimental data [5], according to which the nearly complete desorption of hydrogen  from a graphane membrane (Figure 2(b)) was achieved by annealing it in argon at T = 723 K for 24 hours (i.e.,
![]() ).
).
By using Equation (6), the authors evaluated the quantity of  for T = 300 K (~1∙1024 s) and for T = 600 K (~2×10³ s). However, they note that the above two values of
  should be considered as rough estimates. Using Equation (6), one can evaluate the value of
  for T = 723 K, which is much less (by five orders) than the
  value [4].
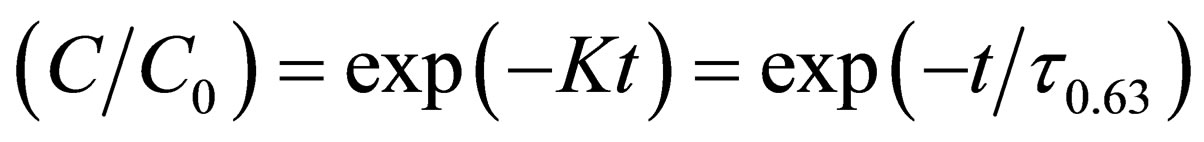
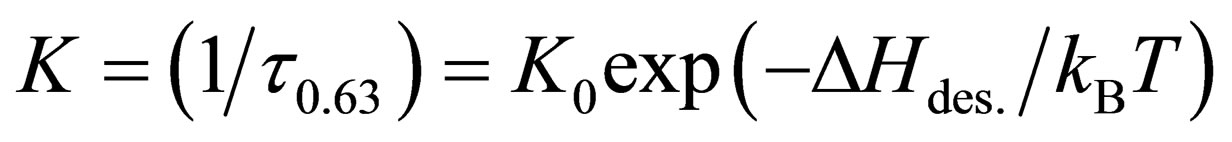
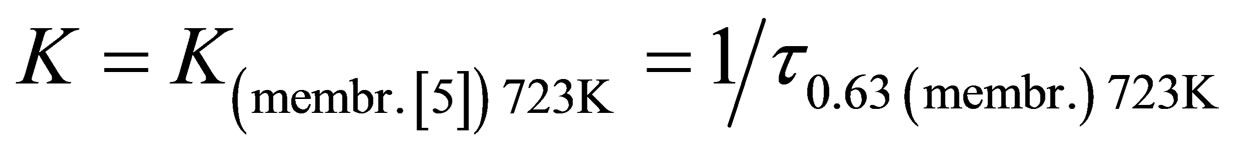
In the framework of the formal kinetics approximation of the first order rate reaction [46], a characteristic quantity for the reaction of hydrogen desorption is 0.63–the time of the removal of ~ 63% ( ) of the initial hydrogen concentration C0 (i.e.,
 ) from the hydrogenated graphene. Such a first order rate reaction (desorption) can be described by the following equations [14,46]:
 (7)
(7)
 (8)
(8)
 (9)
(9)
where  is the reaction (desorption) rate constant,
  is the reaction (desorption) activation energy, and K0 is the per-exponential (or frequency) factor of the reaction rate constant. In the case of a non-diffusion rate limiting kinetics, the quantity of K0 may be the corresponding vibrational frequency (K0 = n), and Equation (9) may be related to the Polanyi-Wigner value [14]. By substituting in Equation (8) the quantities of
and , one can evaluate the desired quantity
 . Hence, using Equation (9) results in the analytical quantity of Aan. = 2∙1015 s−1.
Analogically, one can evaluate the desired quantity
![]() which differs from
which differs from  by about three orders, by substituting in Equation (9) the quantity of
and supposing that
 .
.
In such an approximation, one can evaluate the quantity ![]() for the experimenttal graphane membranes [5]. The obtained quantity of
for the experimenttal graphane membranes [5]. The obtained quantity of  is less by one and a half orders of the vibrational frequency nRD = 2.5∙1014 s−1 corresponding to the D Raman peak (1342 cm−1) for hydrogenated graphene membrane and epitaxial graphene on SiO2 (Figure 2).
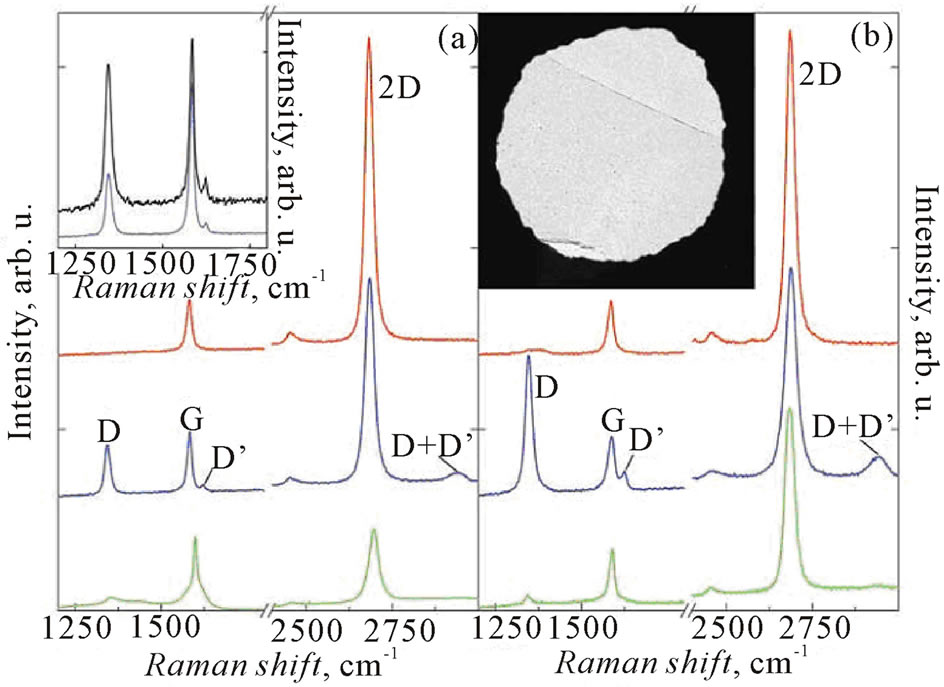
Figure 2. Changes in Raman spectra of graphene caused by hydrogenation [5]. The spectra are normalized to have a similar integrated intensity of the G peak. (a) Graphene on SiO2. (b) Free-standing graphene. Red, blue, and green curves (top to bottom) correspond to pristine, hydrogenated, and annealed samples, respectively. Graphene was hydrogenated for ~2 hours, and the spectra were measured with a Renishaw spectrometer at wavelength 514 nm and low power to avoid damage to the graphene during measurements. (Left inset) Comparison between the evoluation of D and D’ peaks for singleand double-sided exposure to atomic hydrogen. Shown is a partially hydrogenated state achieved after 1 hour of simultaneous exposure of graphene on SiO2 (blue curve) and of a membrane (black curve). (Right inset) TEM image of one of the membranes that partially covers the aperture 50 μm in diameter.
The activation of which in the hydrogenated samples authors attribute to breaking of the translation symmetry of C-C sp2 bonds after formation of C-H sp3 bonds. Also,  is less by one order of the vibrational frequency nHREELS = 8.7∙1013 s−1 corresponding to an additional HREELS peak arising from C-H sp3, and a stretching appears at 369 meV after a partial hydrogenation of the epitaxial graphene. The authors suppose that this peak can be assigned to the vertical C-H bonding, giving direct evidence for hydrogen attachment on the epitaxial graphene surface [47].
Taking into account nRD and nHREELS quantities, and substituting in Equation (9) quantities of
and
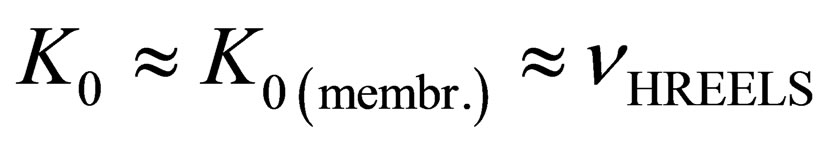 one can evaluate
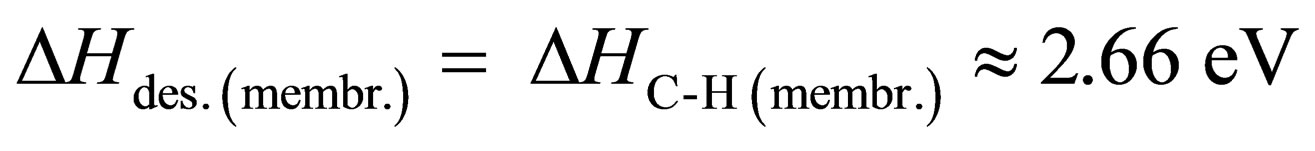 . In such approximation, the obtained value of
  coincides (within the errors) with the experimental value of the break-down energy of C-H sp3-like bonds in hydrofullerene C60H36
( ).
).
The above analysis of the related data shows that for the experimental graphene membranes (hydrogenated up to the near-saturation) can be used for the following thermodesorption characteristics, relevant to Equation (9), of the empirical character:
 ,
,
![]() .
.
The analysis also shows that this is a case for a nondiffusion rate limiting kinetics, when Equation (9) corresponds to the Polanyi-Wigner [14]. Certainly, these tentative results could be directly confirmed and/or modified by receiving and treating within Equations (8) and (9) of the experimental data on t0.63 at several annealing temperatures.
The above noted fact that the empirical quantity  is much larger (by about 3 orders), than the theoretical one (
 ), is consistent with that mentioned in [5]. The alternative possibility that the experimental graphane membrane (a free-standing membrane) may have a more complex hydrogen bonding, than the suggested by the theory, may point out for further theoretical developments.
2.3. Consideration of a Thermodynamic Probability of Existence of Hydrogenated Graphenes-Graphanes* Possessing of a Very High Binding Energy
In connection with the above consideration, it seems expedient to consider a thermodynamic probability of existence of hydrogenated graphene-graphane* ( )
)
possessing of the values of  [3- 5,12,13,18-21] and
  [18-21]. This corresponds to a very high binding (cohesive) energy (
 , in comparison with those considered above for theoretical graphanes. Because of such thermodynamic probability, it is necessary to take into consideration two more additional reactions:
 (10)
(10)
 (11)
(11)
where  and
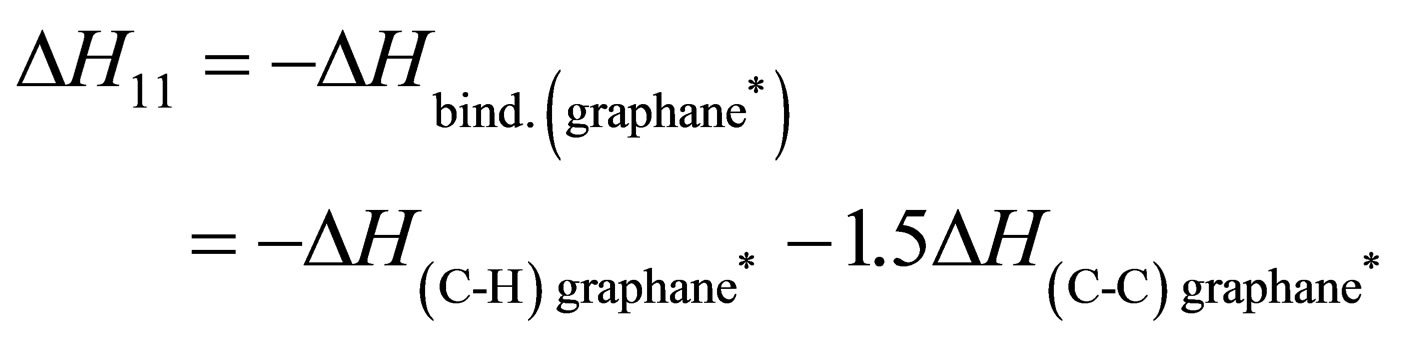
and  are the standard energy (enthalpy) changes. Reaction (11) can be presented as a sum of reaction (2), applied for graphane* as (2*), as well as reaction (10), resulting in the following equation:
 (12)
(12)
Substituting in Equation (12) above the considered values of

and
one can obtain a desired value of
 .
.
The quantity of  corresponds to the binding (cohesive) energy of graphane*
( ).
).
The quantity  characterizes the break-down energy of one (C-H) sp3-like bond and 1.5 (C-C) sp3-like bonds, relevant to breaking away of one hydrogen atom and one neighboring carbon atom from the material:
 (13)
(13)
Hence, substituting in Equation (13) the above noted
 value, one can evaluate the desired value of
 , which coincides (within the errors) with the analogical values for perfect graphene and perfect graphite. The same value of
  can be evaluated in a similar manner, i.e., for hydrogenated (up to composition C2H) single-walled graphite nanotubes* and hydrofullerene* C60H36. Comparing of the obtained values of
 ,
,  ,
,  ,
,  ,
,  and
and
 show that the elastic and intrinsic strength properties (and particularly Young’s modulus (E)) of graphane*-like nanostructures can be closer to those for graphene. In connection with this, it is relevant to note that a unique experimental value from work [48] of a Young’s modulus of graphene is Egraphene = 1.0 terapascal.
As was noted in [5], when a hydrogenated graphene membrane has no free boundaries (a rigidly fixed membrane) in the expanded regions of it, the lattice is stretched isotropically by nearly 10% (i.e., the elastic deformation degree efix.membr. » 0.1) with respect to the pristine graphene. This amount of stretching (e » 0.1) is close to the limit of possible elastic deformations in graphene, and indeed it has been observed that some of their membranes rupture during hydrogenation. It is believed that the stretched regions are likely to remain non-hydrogenated. They also found that instead of exhibiting random stretching, hydrogenated graphene membranes normally split into domain-like regions of the size of the order of 1 mm, and that the annealing of such membranes led to complete recovery of the periodicy in both stretched and compressed domains [5].
By using the experimental value of the degree of elastic deformation ( ) of the hydrogenated fixed graphene membranes, and the experimental value of a Young’s modulus of graphene (
 ), one can evaluate (within Hooke’s law approximation) the stretching stress value
( )
)
in the expanded regions (domains or grains) of the material [5,48]. This analytical result in this study is consistent with the analytical results of the related data considered from [15-21], relevant to the possibility of the existence of hydrogenated graphane*-like nanostructures possessing of a Young’s modulus value close to that of grapheme ( ).
).
2.4. Consideration of Data on Hydrogen Desorption in the Hydrogenated Monoand Bi-Layer Epitaxial Graphene Samples
In [5], both the graphene membrane samples considered above, and the epitaxial graphene and bi-graphene samples on substrate SiO2 were exposed to a cold hydrogen dc plasma for 2 hours to reach the saturation in the measured characteristics. They used a low-pressure (0.1 mbar) hydrogen-argon mixture of 10% H2). Raman spectra for hydrogenated and subsequently annealed graphene membranes (Figure 2(b)) are rather similar to those for epitaxial graphene samples (Figure 2(a)), but with some notable differences. If hydrogenated simultaneously for 1 hour, and before reaching the saturation (a partial hydrogenation), the D peak area for a membrane was two factors greater than the area for graphene on a substrate (Figure 2, the left inset), which indicates the formation of twice as many C-H sp3 bonds in the membrane. This result also agrees with the general expectation that atomic hydrogen attaches to both sides of the membranes. Moreover, the D peak area became up to about three times greater than the G peak area after prolonged exposures (for 2 hours, a near-complete hydrogenation) of membranes to atomic hydrogen. The integrated intensity area of the D peak in Figure 2(b) corresponding to the adsorbed hydrogen saturation concentration in the graphene membranes is larger by a factor of about 3 for the area of the D peak in Figure 2(a), corresponding to the hydrogen concentration in the epitaxial graphene samples. This may be related to some partial hydrogenation localized in some defected nano-regions of the epitaxial graphene samples even after the prolonged (3 hour) exposures, i.e. after reaching their near-saturation [33-42,49]. It is expedient to note that in [5], the absolute values of the adsorbed hydrogen concentration (C0) were neither considered for the hydrogenated graphene membranes, nor for the hydrogenated epitaxial graphene samples.
According to a private communication from D.C. Elias, a near-complete desorption of hydrogen
( )
)
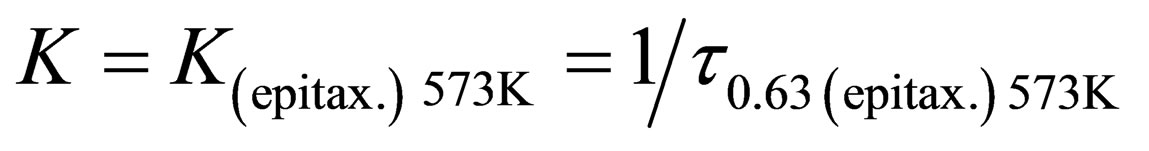
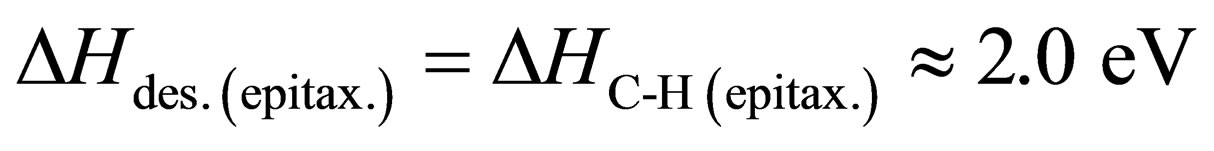
from a hydrogenated epitaxial graphene on a substrate SiO2 (Figure 2(a)) has been achieved by annealing it in 90% Ar/10% H2 mixture at T = 573 K for 2 hours (i.e.,![]() ). Hence, by using Equation (8), one can evaluate the value of
). Hence, by using Equation (8), one can evaluate the value of![]() , which is about six orders less than the evaluated value of
, which is about six orders less than the evaluated value of![]() .
.
Also, the changes in Raman spectra of graphene [5] caused by hydrogenation were rather similar in respect to locations of D, G, D’, 2D and (D + D’) peaks, both for the epitaxial graphene on SiO2 and for the free-standing graphene membrane (Figure 2). Hence, one can suppose that
![]()
Then, by substituting in Equation (9) the values of
and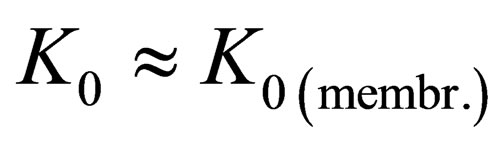 , one can evaluate
Here, the case is supposed of a non-diffusion-ratelimiting kinetics, when Equation (9) corresponds to the Polanyi-Wigner one [14]. Certainly, these tentative thermodynamic characteristics of the hydrogenated epitaxial graphene on a substrate SiO2 could be directly confirmed and/or modified by further experimental data on  at various annealing temperatures.
It is now easy to state that: 1) these analytical results are not consistent with the mass spectrometry data (Figure 3) on thermal desorption of hydrogen from a specially prepared single-side graphane; and 2) they cannot be described in the framework of the theoretical models and characteristics of thermal stability of single-side hydrogenated graphene [6] or graphone [9]. According to the further considerations in this study, it may be a hydrogen desorption case of a diffusion rate limiting kinetics, when K0 ¹ n, and Equation (9) does not correspond to the Polanyi-Wigner one [14].
By using the method of treatment for thermal desorption (TDS) spectra, relevant to the mass spectrometry data (Figure 3) on thermal desorption of hydrogen from a specially prepared single-side graphane (under heating from room temperature to 573 K for 6 minutes), one can obtain the following results: 1) the total integrated area of the thermal desorption spectra corresponds to ~2∙10−8 g of desorbed hydrogen; 2) the TDS spectra can be approximated by three thermodesorption (TDS) peaks (# 1, # 2 and # 3); 3) TDS peak # 1 (~30% of the total area, Tmax#1 » 370 K) can be characterized by the activation energy of ETDS-peak # 1 = 0.6 ± 0.3 eV and by the per-exponential factor of the reaction rate constant![]() ; 4) TDS peak # 2 (~15% of the total area, Tmax # 2 » 445 K) can be characterized by the activation energy ETDS-peak # 2 = 0.6 ± 0.3 eV, and by the per-exponential factor of the reaction rate constant
; 4) TDS peak # 2 (~15% of the total area, Tmax # 2 » 445 K) can be characterized by the activation energy ETDS-peak # 2 = 0.6 ± 0.3 eV, and by the per-exponential factor of the reaction rate constant
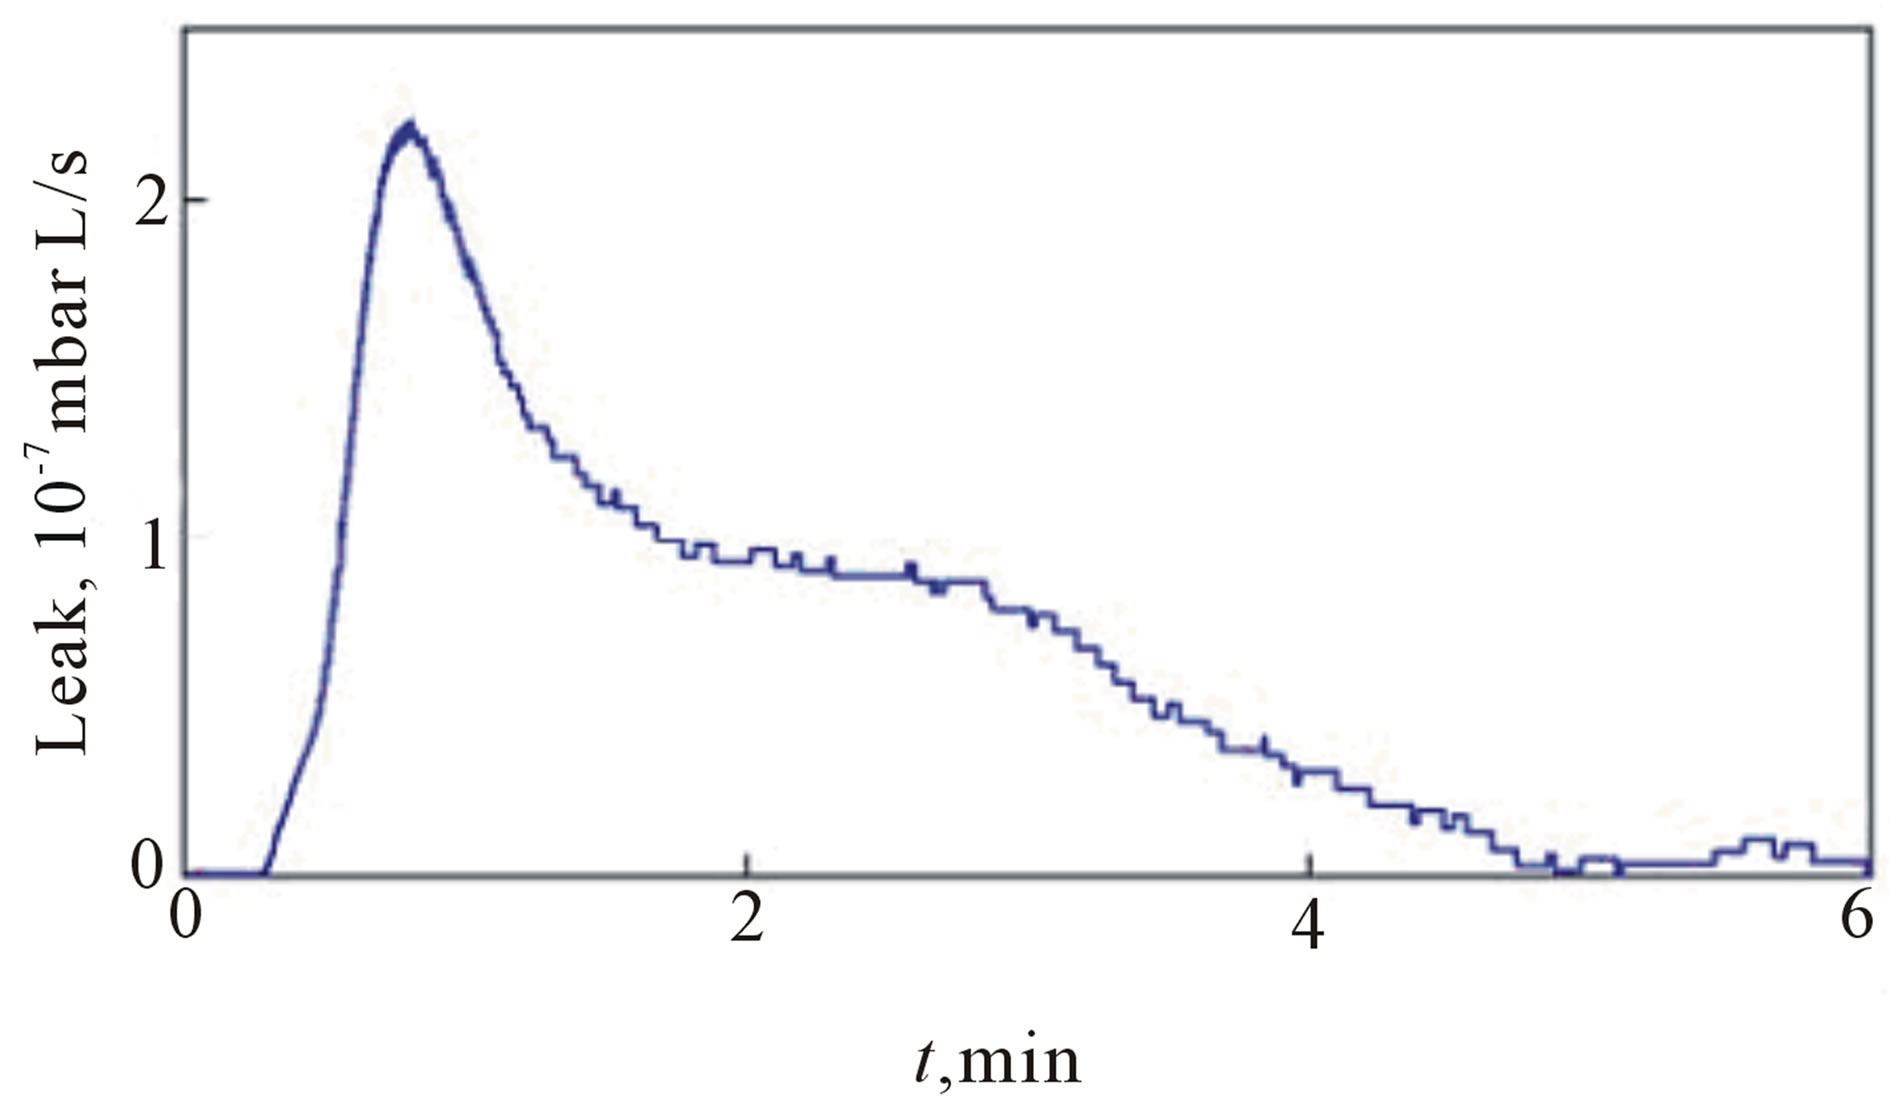
Figure 3. Desorption of hydrogen from single-side graphane [5]. The measurments were done by using a leak detector tuned to sense molecular hydrogen. The sample was heated to 573 K (the heater was switched on at t = 10 s). Control samples (exposed to pure argon plasma) exhibited much weaker and featureless response (<5∙10−8 mbar L/s), which is attributed to desorption of water at heated surfaces and subtracted from the shown data (water molecules are ionized in the mass-spectrometer, which also gives rise to a small hydrogen signal).
![]() ; and 5) TDS peak # 3 (~55% of the total area, Tmax # 3 » 540 K) can be characterized by the activation energy ETDS-peak # 3 = 0.23 ± 0.05 eV and by the per-exponential factor of the reaction rate constant
; and 5) TDS peak # 3 (~55% of the total area, Tmax # 3 » 540 K) can be characterized by the activation energy ETDS-peak # 3 = 0.23 ± 0.05 eV and by the per-exponential factor of the reaction rate constant ![]() [14]. These analytical results show that all three of the above noted thermal desorption (TDS) processes (# 1TDS, # 2TDS and # 3TDS) may be related to a hydrogen desorption case of a diffusion-ratelimiting kinetics, when in Equation 9 the value of
[14]. These analytical results show that all three of the above noted thermal desorption (TDS) processes (# 1TDS, # 2TDS and # 3TDS) may be related to a hydrogen desorption case of a diffusion-ratelimiting kinetics, when in Equation 9 the value of 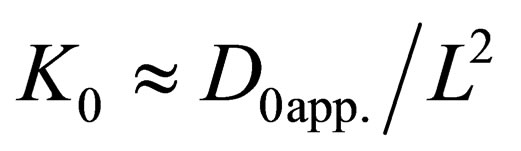 and the value of
 , where D0app is the per-exponent factor of the apparent diffusion coefficient
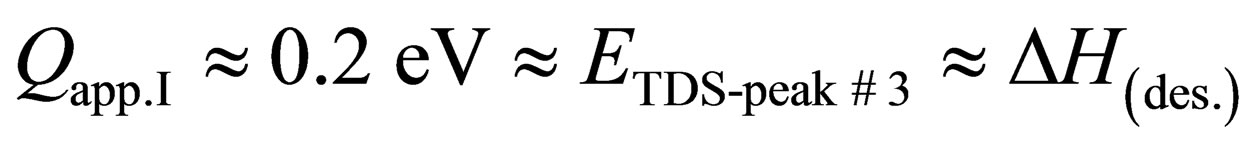
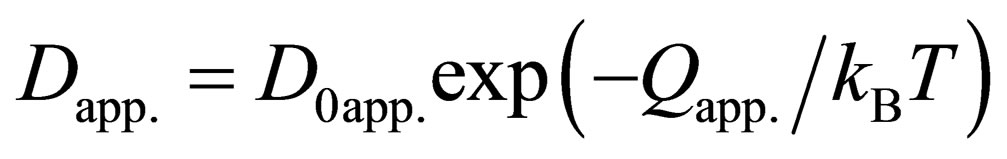 , L is the characteristic diffusional size (length), and Qapp. is the apparent diffusion activation energy. TDS process # 3TDS may be related to TDS process (or peak) I in [14,18-21], for which the apparent diffusion activation energy is

and
 .
.
Hence, one can evaluate the quantity of
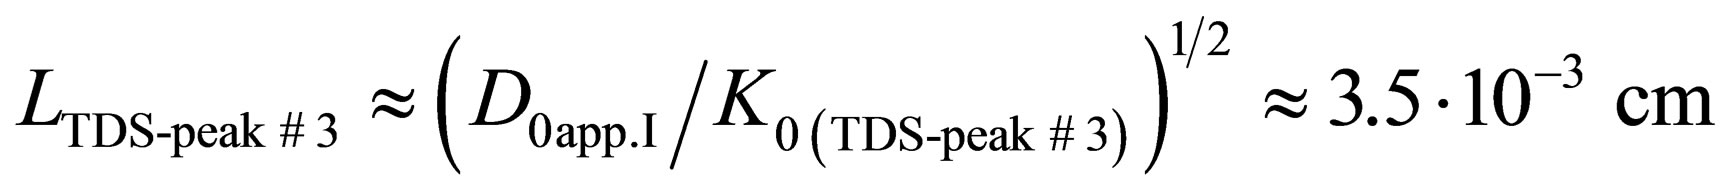 which may be related to the linear size of the graphene specimens. Thus, TDS process # 3TDS may be related to chemisorption models “H” and/or “G” (Figure 4) corresponding to TDS process (or peak) I in [14, 18-21].
TDS processes # 1TDS and # 2TDS may be related, in some extent to chemisorption models “H” and/or “G” (Figure 4). Model “H” corresponds to TDS process (or peak) II in [14,16,18-21], for which the apparent diffusion activation energy is Qapp.II » 1.2 eV that is comparatively close to ETDS-peak # 1, 2 and D0app.II » 2∙103 cm2/s. Obviously, chemisorption models “H” and/or “G” (Figure 4) can be applied only for the defected nano-regions in the epitaxial graphene flakes [5], for instance, in vacancies, grain boundaries (domains), and/or triple junc-
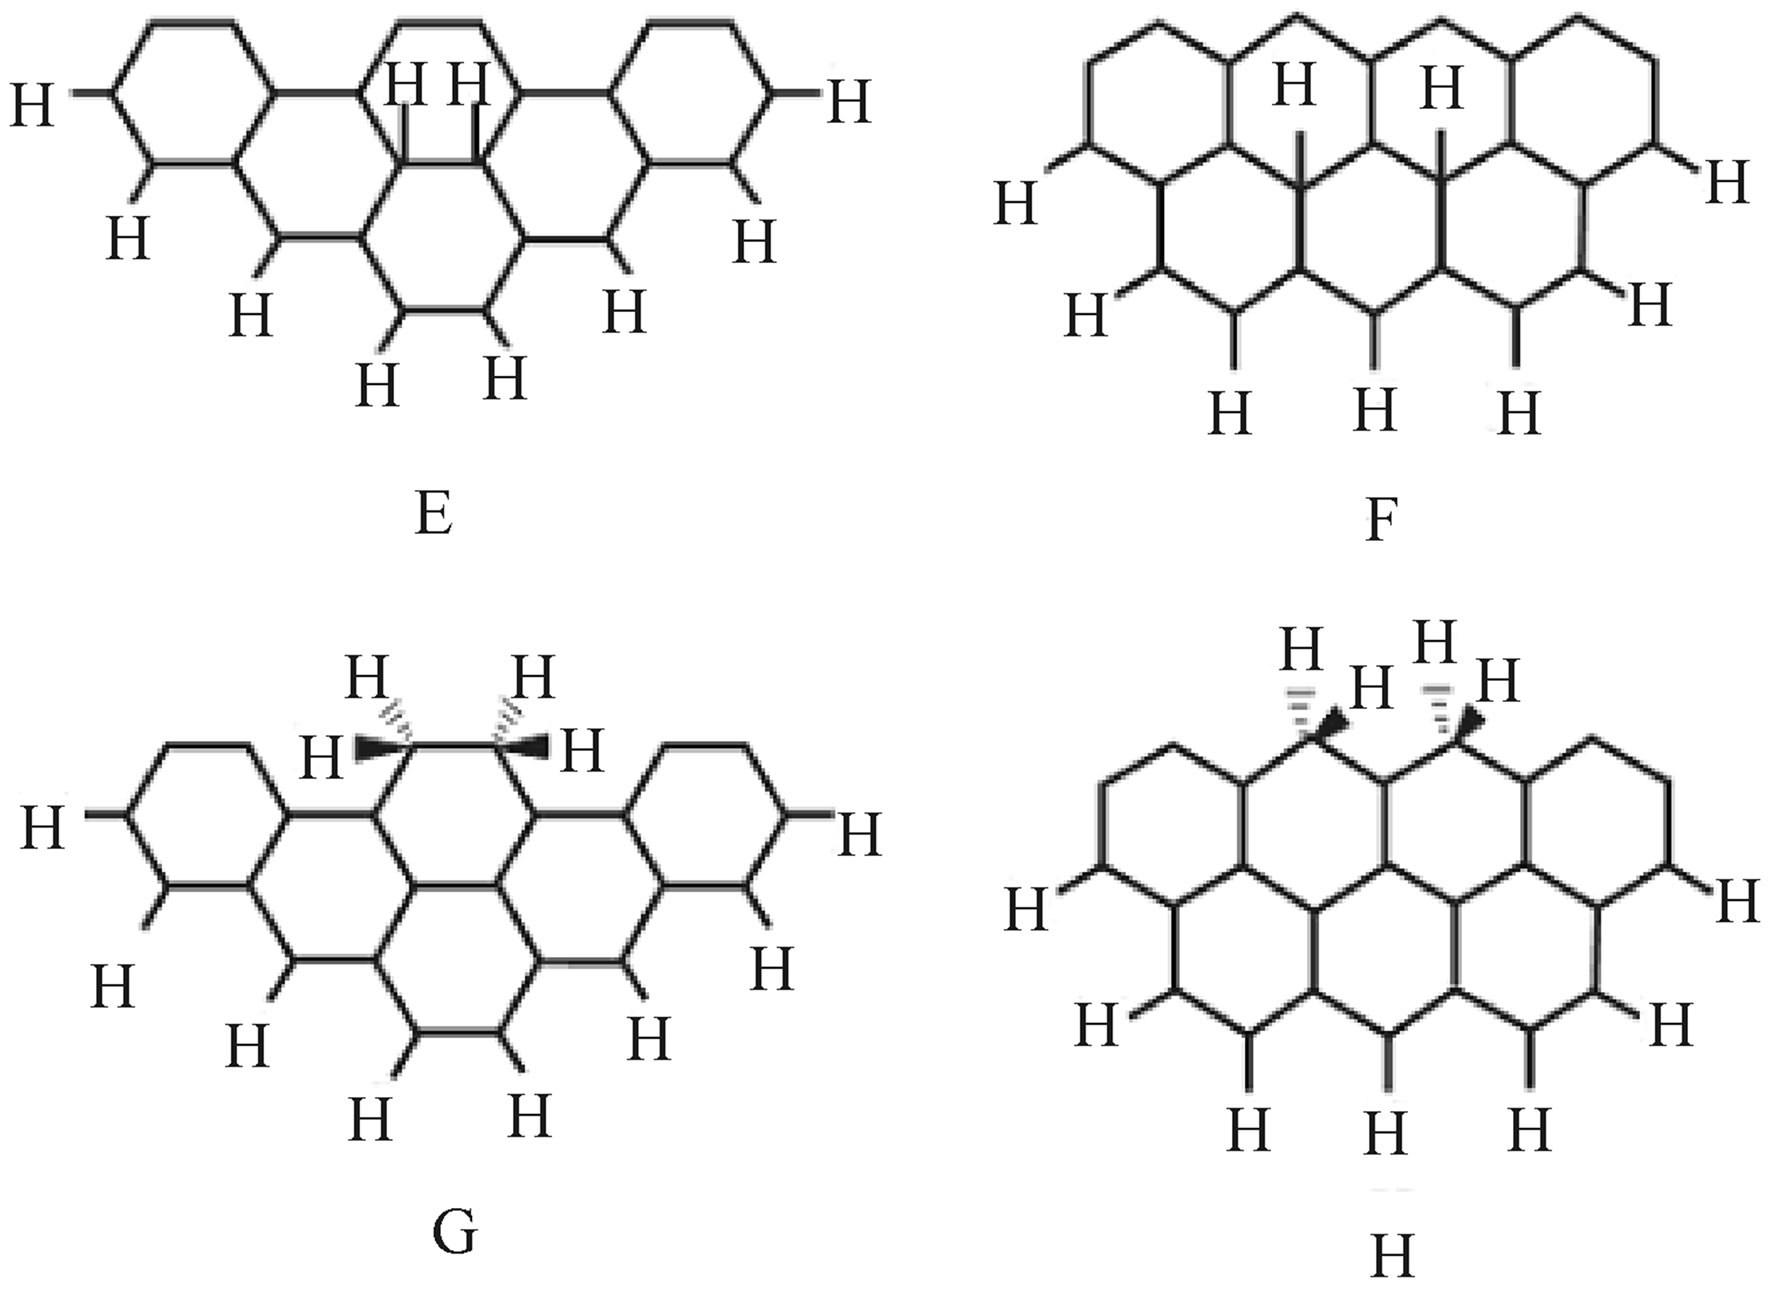
Figure 4. Schematics of some theoretical models (ab initio molecular orbital calculations [50]) of chemisorption of atomic hydrogen on graphite on the basal and edge planes.
tions (nodes) of the grain-boundary network [33-42,49], where the dangling carbon bonds can occur.
It is important to note that in Items 2.1 - 2.3 chemisorption of atomic hydrogen on graphene membranes may be related to model “F*” [14,16,18-21], which is relevant to chemisorption of a single hydrogen atom on one of the carbon atoms possessing of 3 unoccupied (by hydrogen) nearest carbons, but not two hydrogen atoms on two carbons, as seen in model “F”. Model “F*” is characterized [14,16,18-21] by the quantity of
 which coincides with the similar quantities of graphanes [3-5].
In work [5], the same hydrogenation procedures of the 2 hour long expositions have been applied, as well as bilayer epitaxial graphene on SiO2/Si wafer. Bilayer samples showed little change in their charge carrier mobility and a small D Raman peak, compared to the single-layer epitaxial graphene on SiO2/Si wafer exposed to the same hydrogenation procedures. The authors believe that higher rigidity of bilayers suppressed their rippling, thus reducing the probability of hydrogen adsorption.
In this study, further consideration must be given to some other known experimental data that on hydroge nation and thermal stability characteristics of mono-layer, bi-layer and three-layer epitaxial graphene systems play an important role in some defects found in graphene networks [33-42,49], relevant to the probability of hydrogen adsorption and the permeability of graphene networks for atomic hydrogen. The analytical results of Item 2 are presented in Table 1.
3. Analysis and Comparison of Data
3.1. Analysis of the Raman Spectroscopy Data on Thermal Desorption of Hydrogen from Hydrogenated Graphene Flakes
In [51], it is reported that the hydrogenation of single and bilayer graphene flakes by an argon-hydrogen plasma produced a reactive ion etching (RIE) system. They analyzed two cases: one where the graphene flakes were electrically insulated from the chamber electrodes by the SiO2 substrate, and the other where the flakes were in electrical contact with the source electrode (a graphene device). Electronic transport measurements in combination with Raman spectroscopy were used to link the electric mean free path to the optically extracted defect concentration, which is related to the defect distance (Ldef.). This showed that under the chosen plasma conditions, the process does not introduce considerable damage to the graphene sheet, and that a rather partial hydrogenation ( ) occurs primarily due to the hydrogen ions from the plasma, and not due to fragmentation of water adsorbates on the graphene surface by highly accelerated plasma electrons. To quantify the level of hydrogenation, they used the integrated intensity ratio (ID/IG) of Raman bands. The hydrogen coverage (CH) determined from the defect distance (Ldef.) did not exceed ~0.05%.
In [51], they also performed the heating of the hydrogenated single graphene flakes (on the SiO2 substrate) in a nitrogen environment, on a hot-plate, and with temperatures ranging from 348 K to 548 K, each time ( ) of 1 min. As seen in Figure 5, heating results decrease the integrated intensity ratio (ID/IG) of Raman bands. Within a formal kinetics approach, the averaged kinetic data for samples of 10, 20 and 40 minute exposure can be treated by using Equation (7) transformed to a more suitable form (7’):
 where Dt = 60 s,
  and C are determined from Figure 5. This resulted in finding 5 values of the reaction (desorption) rate constant (K) for 5 temperatures (T = 348, 398, 448, 498 and 548 K). Their temperature dependence is described by Equation (9). Hence, the desired quantities have been determined (Table 2) for the reaction (desorption) activation energy
 and the per-exponential factor of the reaction rate constant
![]() . Hence, desorption time at 553 K is
. Hence, desorption time at 553 K is .
.
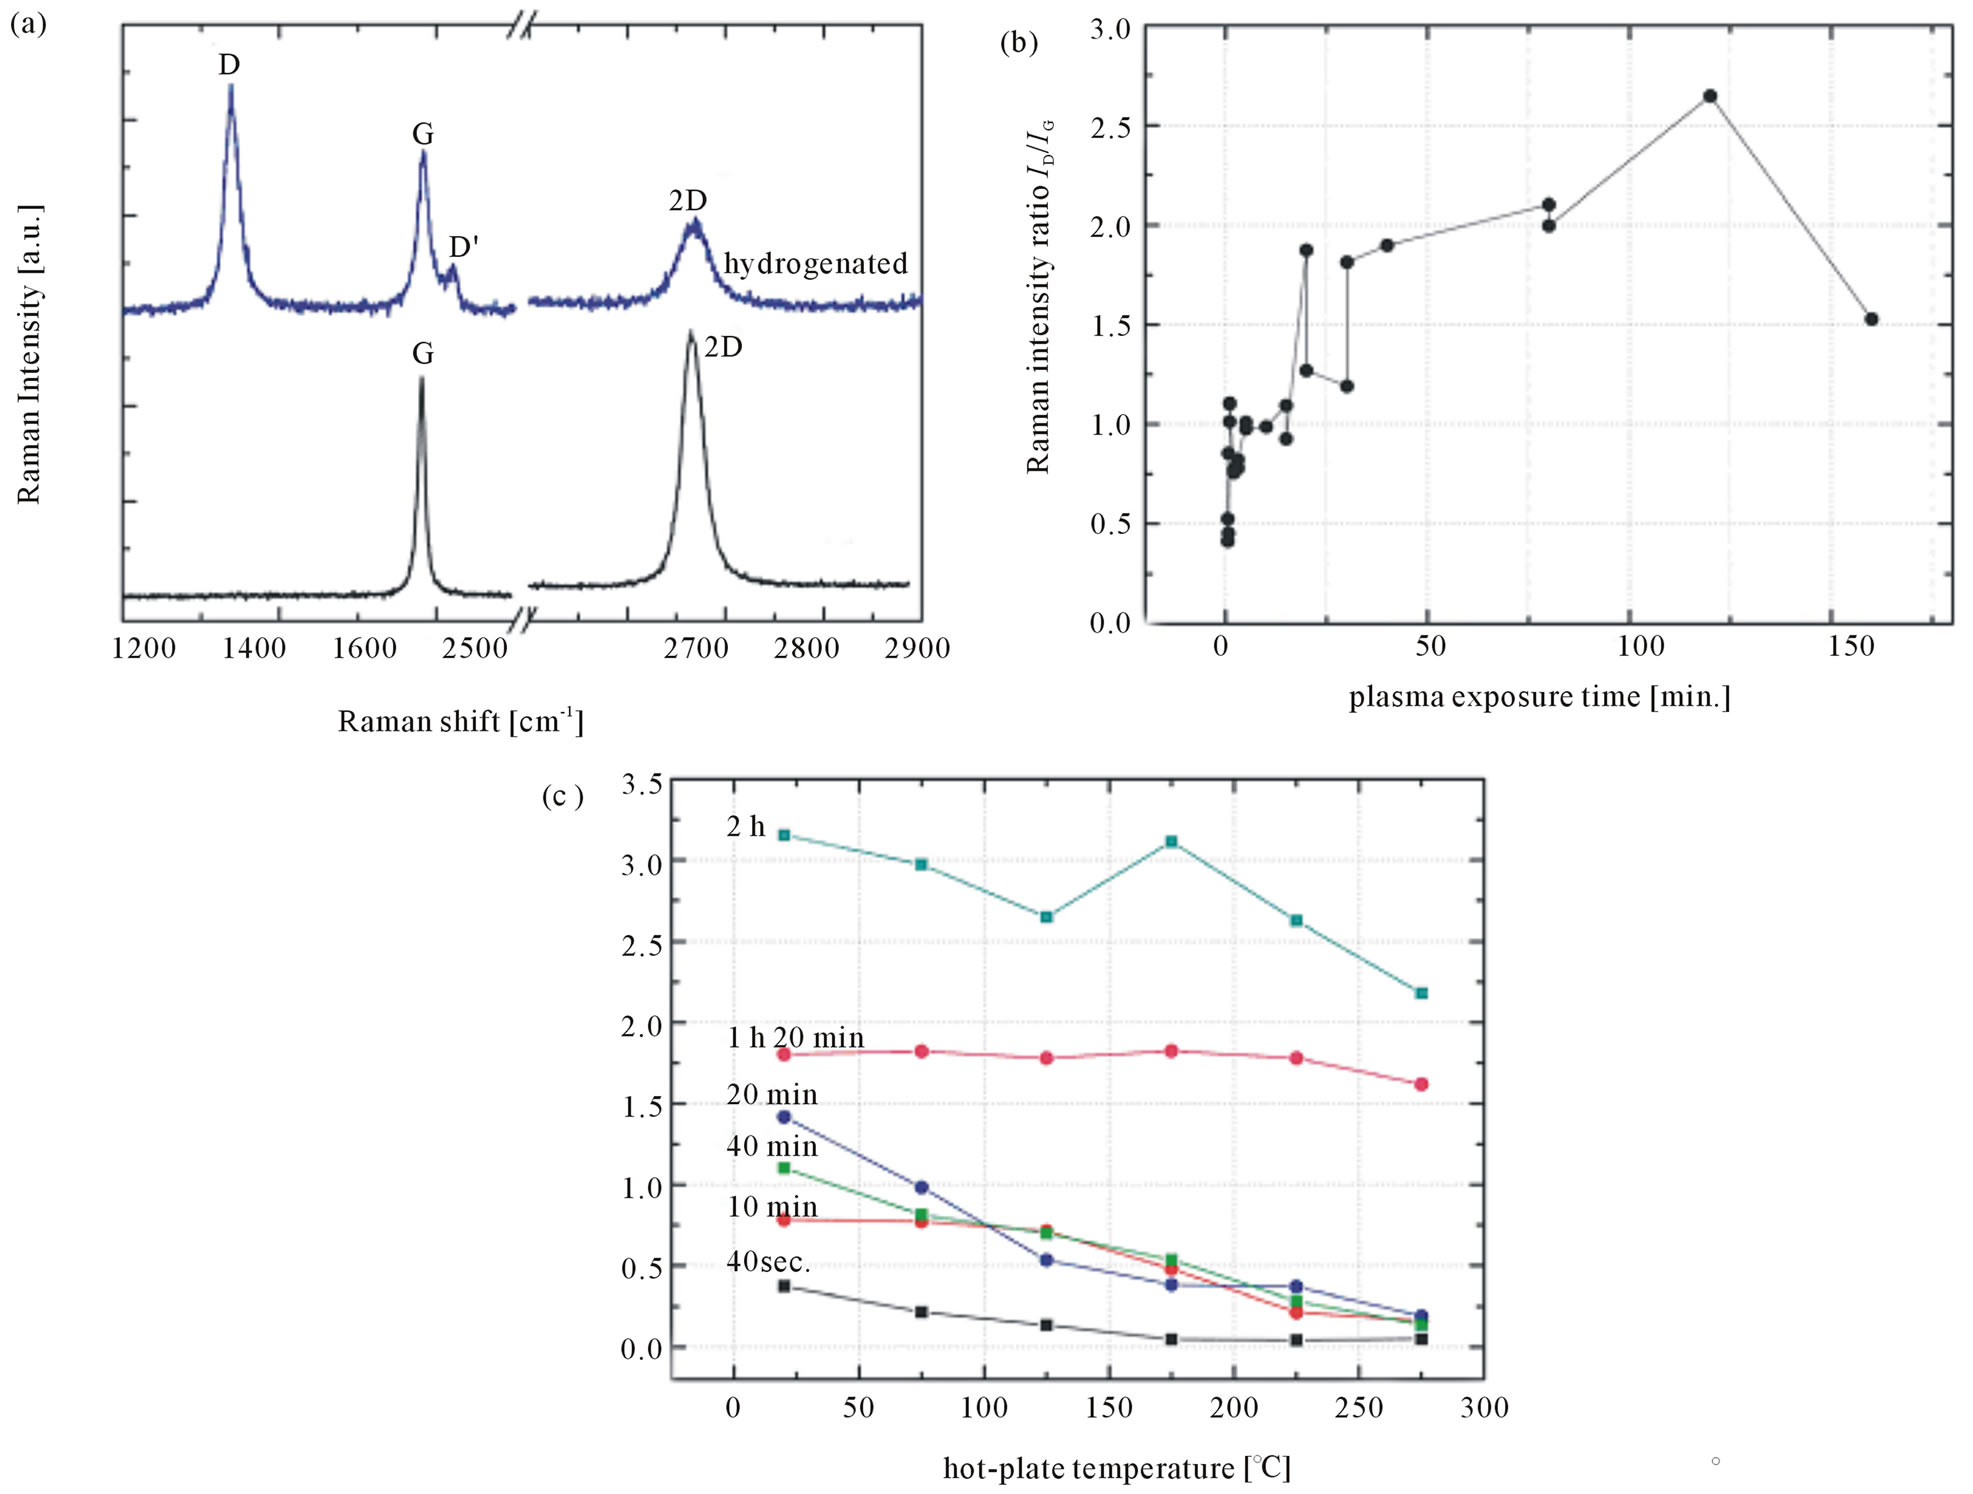
Figure 5. (a) Raman spectrum of pristine single layer graphene—SLG (black) and after 20 min of exposure to the Ar/H2 plasma (blue) [51]. Exposure induces additional Raman bands: a D band around 1340 cm−1 and a weaker D’ band around 1620 cm−1. The increase of FWHM of original graphene bands (G, 2D) is apparent. (b) Integrated intensity ratio between the D and G bands (ID/IG) of SLG after different Ar/H2 plasma exposure times. The scattering of the data for different samples is attributed to the floating potential of the graphene flake during exposure. (c) The change of the ID/IG ratio of exposed flakes under annealing on hot-plate for 1 min. The plasma exposure time for each flake is indicated next to the corresponding ID/IG values. In flakes exposed for less than 1 h the D band could be almost fully suppressed ( ), which confirms the hydrogen-type origin of defects. In longer exposed samples (80 min and 2 h), annealing does not significantly reduce ID/IG, which suggests a different nature of defects, e.g., vacancies.
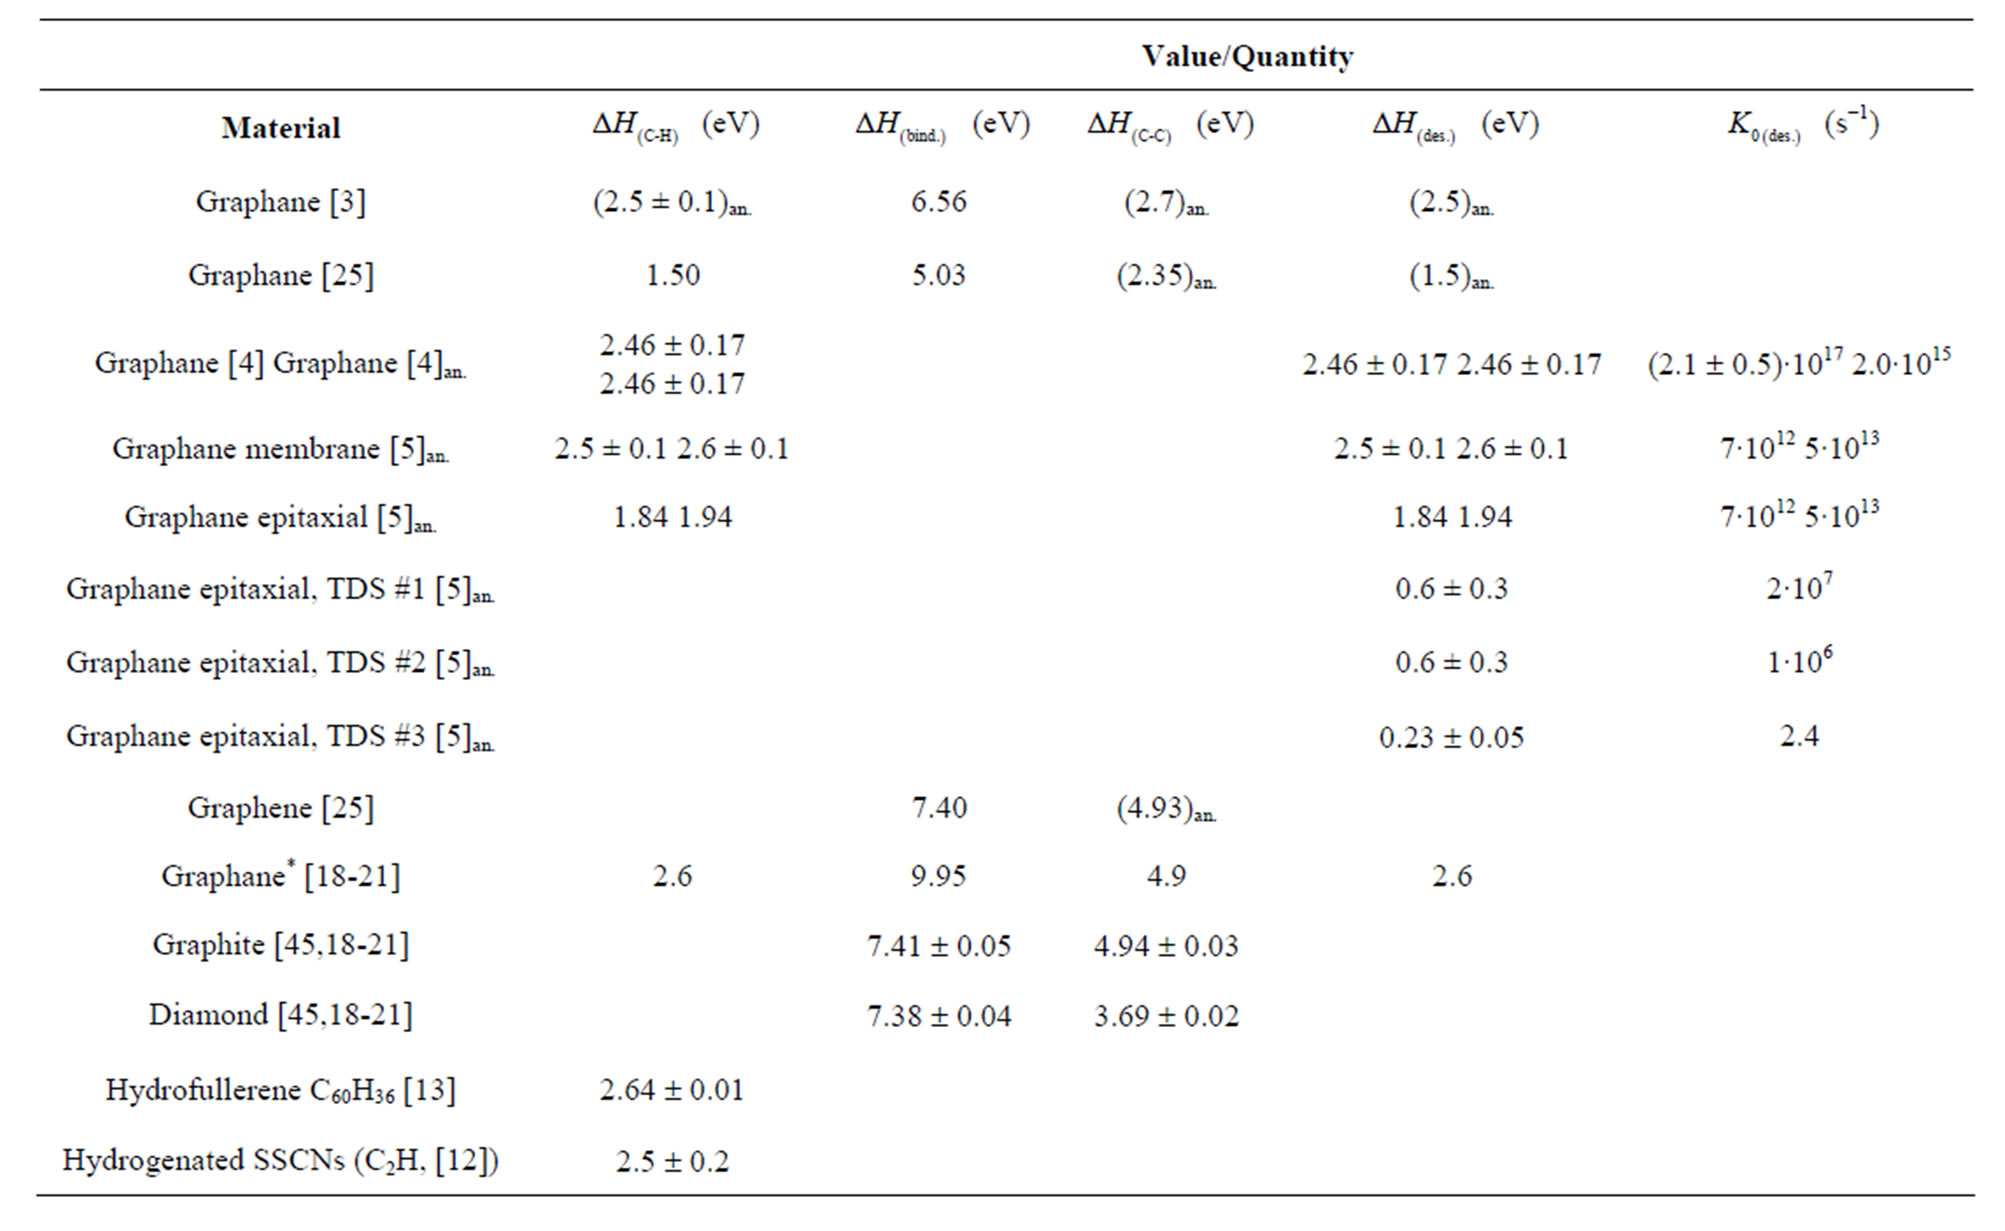
Table 1. Analytical (an.) results of Item 2.
The calculated values of  and
and  are closer (within the errors) to those for TDS process # 3 (Table 1). These two desorption processes may be related to TDS process (or peak) I in [14,18-21], for which the apparent diffusion activation energy is
 .
.
By taking into account the facts that the RIE exposure regime [51] is characterized by a form of 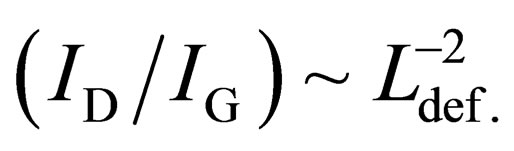 (for
(for ), Ldef. » 11 - 17 nm and the hydrogen concentration CH £ 5∙10−4, one can suppose that the hydrogen adsorption centers in the single graphene flakes (on the SiO2 substrate) are related in some point to nanodefects (i.e., vacancies and/or triple junctions (nodes) of the grain-boundary network) of diameter ddef. » const. In such a model, the quantity CH can be described satisfactory as:
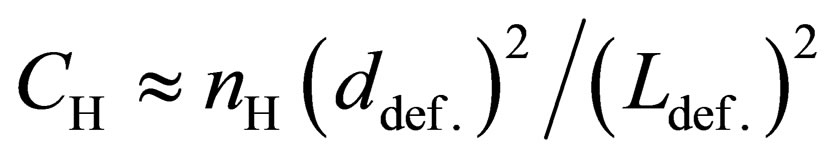 (14)
(14)
where nH » const. is the number of hydrogen atoms adsorbed by a center;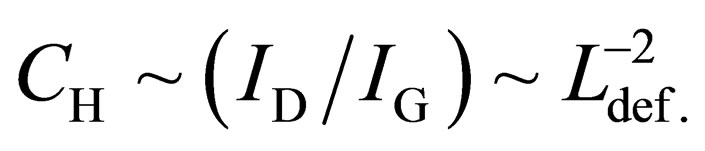 . It was also found that after the Ar/H2 plasma exposure, the (ID/IG) ratio for bilayer graphene device is larger than that of the single graphene device. As noted in [51], this observation is in contradiction to the Raman ratios after exposure of graphene to atomic hydrogen and when other defects are introduced.
3.2. Analysis of the STM and STS Data on Reversible Hydrogenation of Epitaxial Graphene and Graphite Surfaces
In [52], the effect of hydrogenation on topography and electronic properties of graphene grown by CVD on top of a nickel surface and high oriented pyrolytical graphite (HOPG) surfaces were studied by scanning tunneling microscopy (STM) and spectroscopy (STS). The surfaces were chemically modified using 40 min Ar/H2 plasma (with 3 W power) treatment (Figure 6). This determined that the hydrogen chemisorption on the surface of graphite/graphene opens on average an energy bandgap of 0.4 eV around the Fermi level. Although the plasma treatment modifies the surface topography in an irreversible way, the change in the electronic properties can be reversed by moderate thermal annealing (for 10 min at 553 K), and the samples can be hydrogenated again to yield a similar, but slightly reduced, semiconducting behavior after the second hydrogenation. The data shows that the time of desorption from both the epitaxial graphene/Ni samples and HOPG samples of about 99% of hydrogen under 553 K annealing is![]() . Hence, by using Equation (8), one can evaluate the quantity
. Hence, by using Equation (8), one can evaluate the quantity , which is close (within the errors) to the similar quantity of
 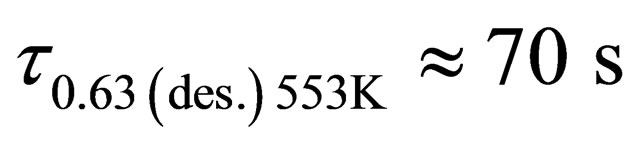 for the epitaxial graphene flakes considered in the previous Section 3.1.
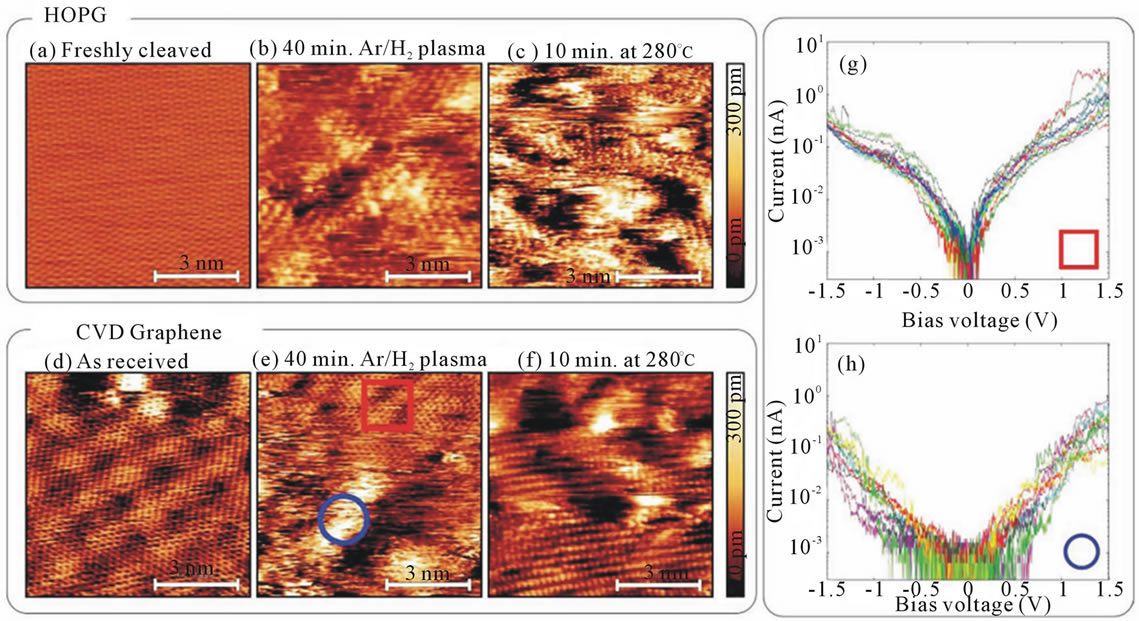
Figure 6. (a)-(f) Topography images acquired in the constant-current STM mode [52]: (a)-(c) HOPG, (d)-(f) graphene grown by CVD on top of a nickel surface at different steps of the hydrogenation/dehydrogenation process. (a), (d) Topography of the surface before the hydrogen plasma treatment. For the HOPG, the typical triangular lattice can be resolved all over the surface. For the CVD graphene, a Moiré pattern, due to the lattice mismatch between the graphene and the nickel lattices, superimposed onto the honeycomb lattice is observed. (b), (e) After 40 min of Ar/H2 plasma treatment, the roughness of the surfaces increases. The surfaces are covered with bright spots where the atomic resolution is lost or strongly distorted. (c), (f) graphene surface after 10 min of moderate annealing; the topography of both the HOPG and CVD graphene surfaces does not fully recover its original crystallinity. (g) Current-voltage traces measured for a CVD graphene sample in several regions with pristine atomic resolution, such as the one marked with the red square in (e). (h) The same as (g) but measured in several bright regions, such as the one marked with the blue circle in (e), where the atomic resolution is distored.
As noted in [53], before the plasma treatment, the CVD graphene exhibits a Moiré pattern superimposed to the honeycomb lattice of graphene (Figure 6(d)). This is due to the lattice parameter mismatch between the graphene and the nickel surfaces, and thus the characteristics of the most of the epitaxial graphene samples. On the other hand for the hydrogenated CVD graphene, the expected structural changes are twofold [53]. First, the chemisorption of hydrogen atoms will change the sp2 hybridization of carbon atoms to tetragonal sp3 hybridization, modifying the surface geometry. Second, the impact of heavy Ar ions, present in the plasma, could also modify the surface by inducing geometrical displacement of carbon atoms (rippling graphene surface) or creating vacancies and other defects (for instance, grain or domain boundaries [33-42,49]). Figure 6(e) shows the topography image of the surface CVD graphene after the extended (40 min) plasma treatment. The nano-ordercorrugation increases after the treatment, and there are brighter nano-regions (of about 1 nm in height and several nm in diameter) in which the atomic resolution is lost or strongly distorted. It was also found that these bright nano-regions present a semiconducting behavior, while the rest of the surface remains conducting (Figures 6(g)-(h)) [52,53].
It is reasonable to assume that most of the chemisorbed hydrogen is localized into these bright nano-regions, which have a blister-like form. Moreover, it is also reasonable to assume that the monolayer (single) graphene flakes on the Ni substrate are permeable to atomic hydrogen only in these defected nano-regions. This problem has been formulated in Section 1 (Introduction). A similar model may be valid and relevant for the HOPG samples (Figures 6(a)-(c)).
It has been found out that when graphene is deposited on a SiO2 surface (Figures 7 and 8), the charged impurities presented in the graphene/substrate interface produce strong inhomogeneities of the electronic properties of graphene. On the other hand, it has also been shown how homogeneous graphene grown by CVD can be altered by chemical modification of its surface by the chemisoption of hydrogen. It strongly depresses the local conductance at low biases, indicating the opening of a band gap in grapheme [53,54].
The charge inhomogeneities (defects) of epitaxial hydrogenated graphene/SiO2 samples do not show long range ordering, and the mean spacing between them is Ldef. » 20 nm (Figure 8). It is reasonable to assume that the charge inhomogeneities (defects) are located at the interface between the SiO2 layer (300 nm thick) and the
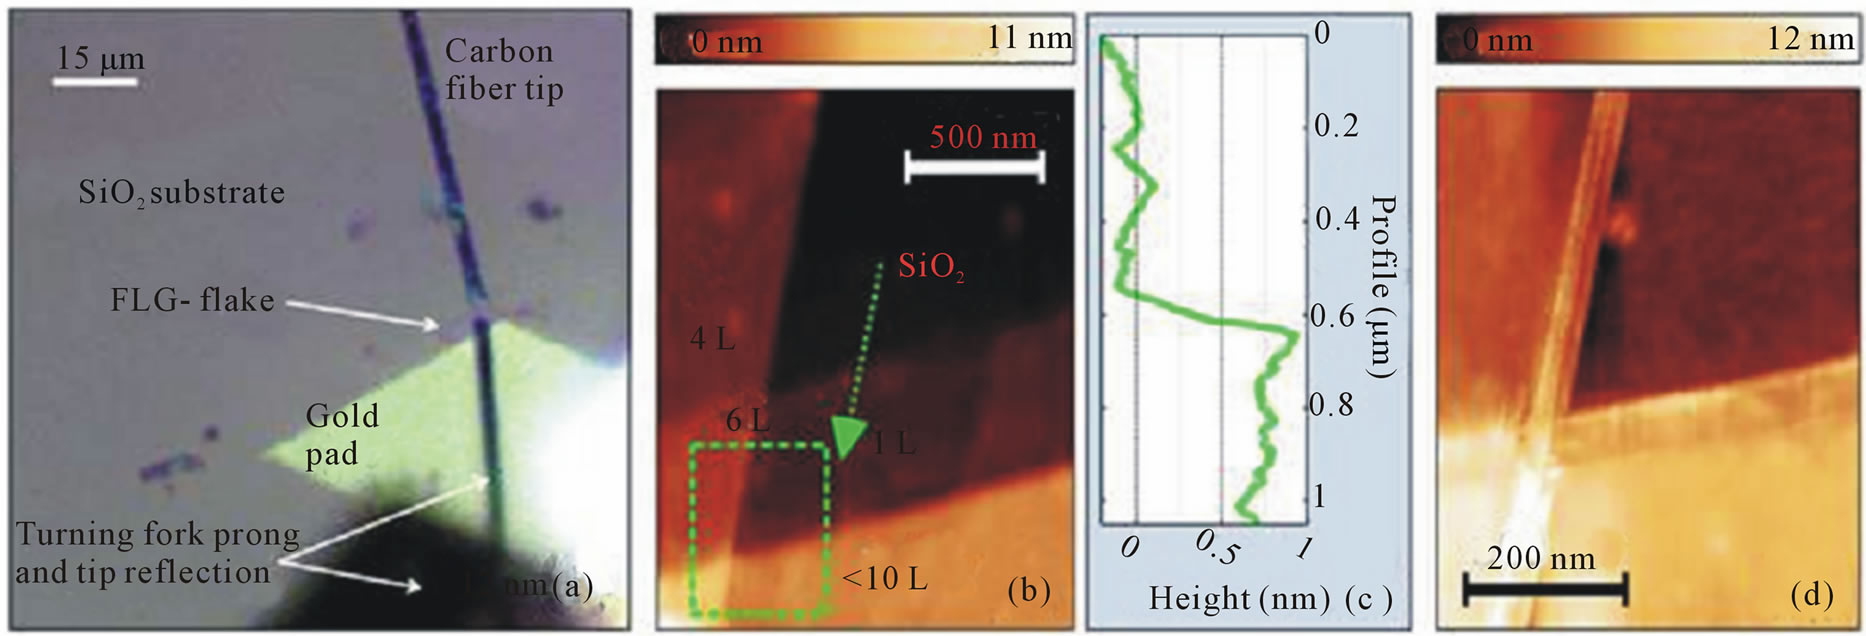
Figure 7. (a) Optical image of the coarse tip positioning on a few-layers graphene flake on the SiO2 substrate, (b) AFM topography image of the interface between the few-layers graphene flake and the the SiO2 substrate and areas with different number of layers (labeled as >10 L, 6 L, 4 L and 1 L) are found, (c) Topographic line profile acquired along the dotted line in (b), showing the interface between the SiO2 substrate and a monolayer (1 L) graphene region, and (d) STM topography image of the regions marked by the dashed rectangle in (b) [53,54].
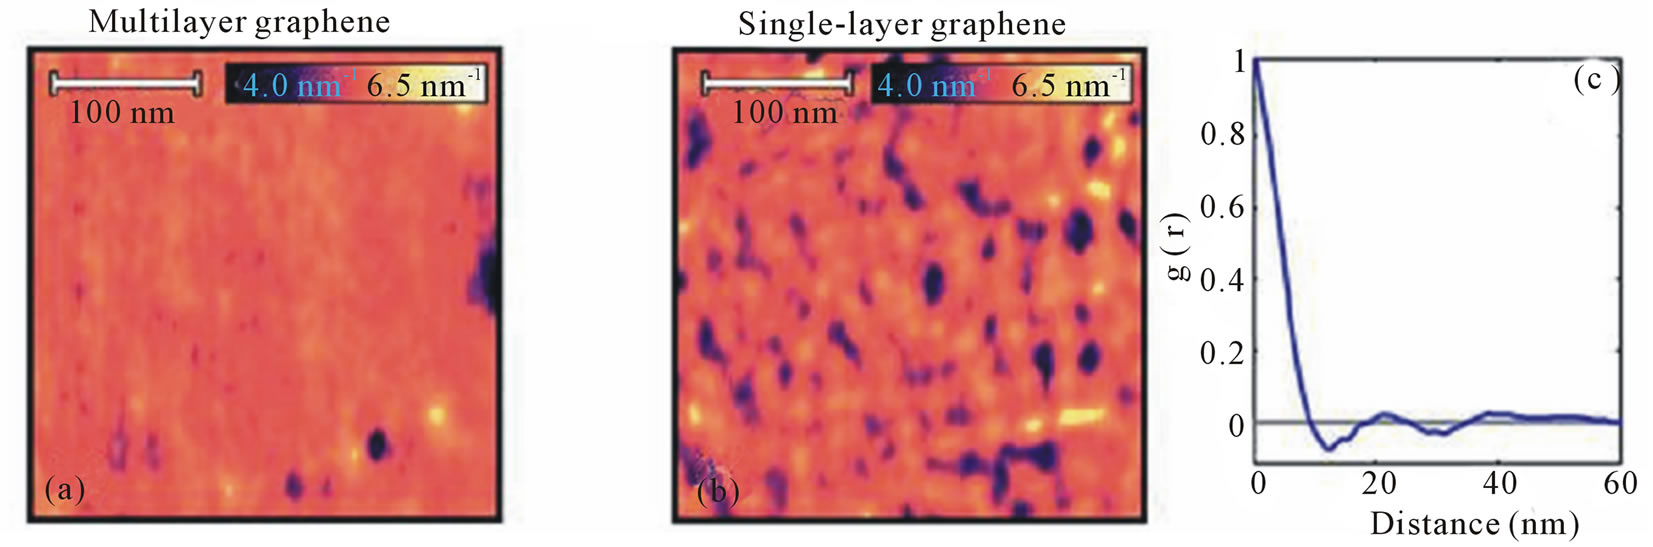
Figure 8. (a) and (b) show the local tunneling decay constant maps measured on a multilayer and a single-layer (1 L) region, respectively. (c) Radial autocorrelation function of the local tunneling decay image in (b) [53,54].
graphene flake [53,54]. A similar quantity (Ldef. » 11 - 17 nm, [51])) for the hydrogen adsorption centers in the single graphene flakes on the SiO2 substrate has been considered in Section 3.1.
3.3. Analysis of the HREELS/LEED Data on Thermal Desorption of Hydrogen from Hydrogenated Graphene on SiC
In [55], hydrogenation of deuterium-intercalated quasifree-standing monolayer graphene on SiC (0001) was obtained and studied with low-energy electron diffraction (LEED) and high-resolution electron energy loss spectroscopy (HREELS). While the carbon honeycomb structure remained intact, it has shown a significant band gap opening in the hydrogenated material. Vibrational spectroscopy evidences for hydrogen chemisorption on the quasi-free-standing graphene has been provided and its thermal stability has been studied (Figure 9). Deuterium intercalation, transforming the buffer layer in quasi-freestanding monolayer graphene (denoted as SiC-D/QFMLG), has been performed with a D atom exposure of ~5∙1017 cm−2 at a surface temperature of 950 K. Finally, hydrogenation up to saturation of quasi-free-standing monolayer graphene has been performed at room temperature with a H atom exposure >3∙1015 cm−2. The latter sample has been denoted as SiC-D/QFMLG-H to stress the different isotopes used.
According to a private communication from R. Bisson, the temperature indicated at each point in Figure 9 corresponds to successive temperature ramp (not linear) of 5 minutes. Within a formal kinetics approach for the first order reactions [14,46], one can treat the above noted points at Ti = 543 K, 611 K and 686 K, by using Equation (8) transformed to a more suitable form (8’):
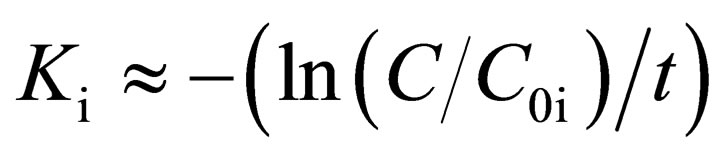 where t = 300 s, and the corresponding quantities C0i and C are determined from Figure 9. It resulted in finding values of the reaction (hydrogen desorption from SiC-D/ QFMLG-H samples) rate constant Ki for 3 temperatures Ti = 543 K, 611 K and 686 K. The temperature dependence is described by Equation (9). Hence, the desired quantities
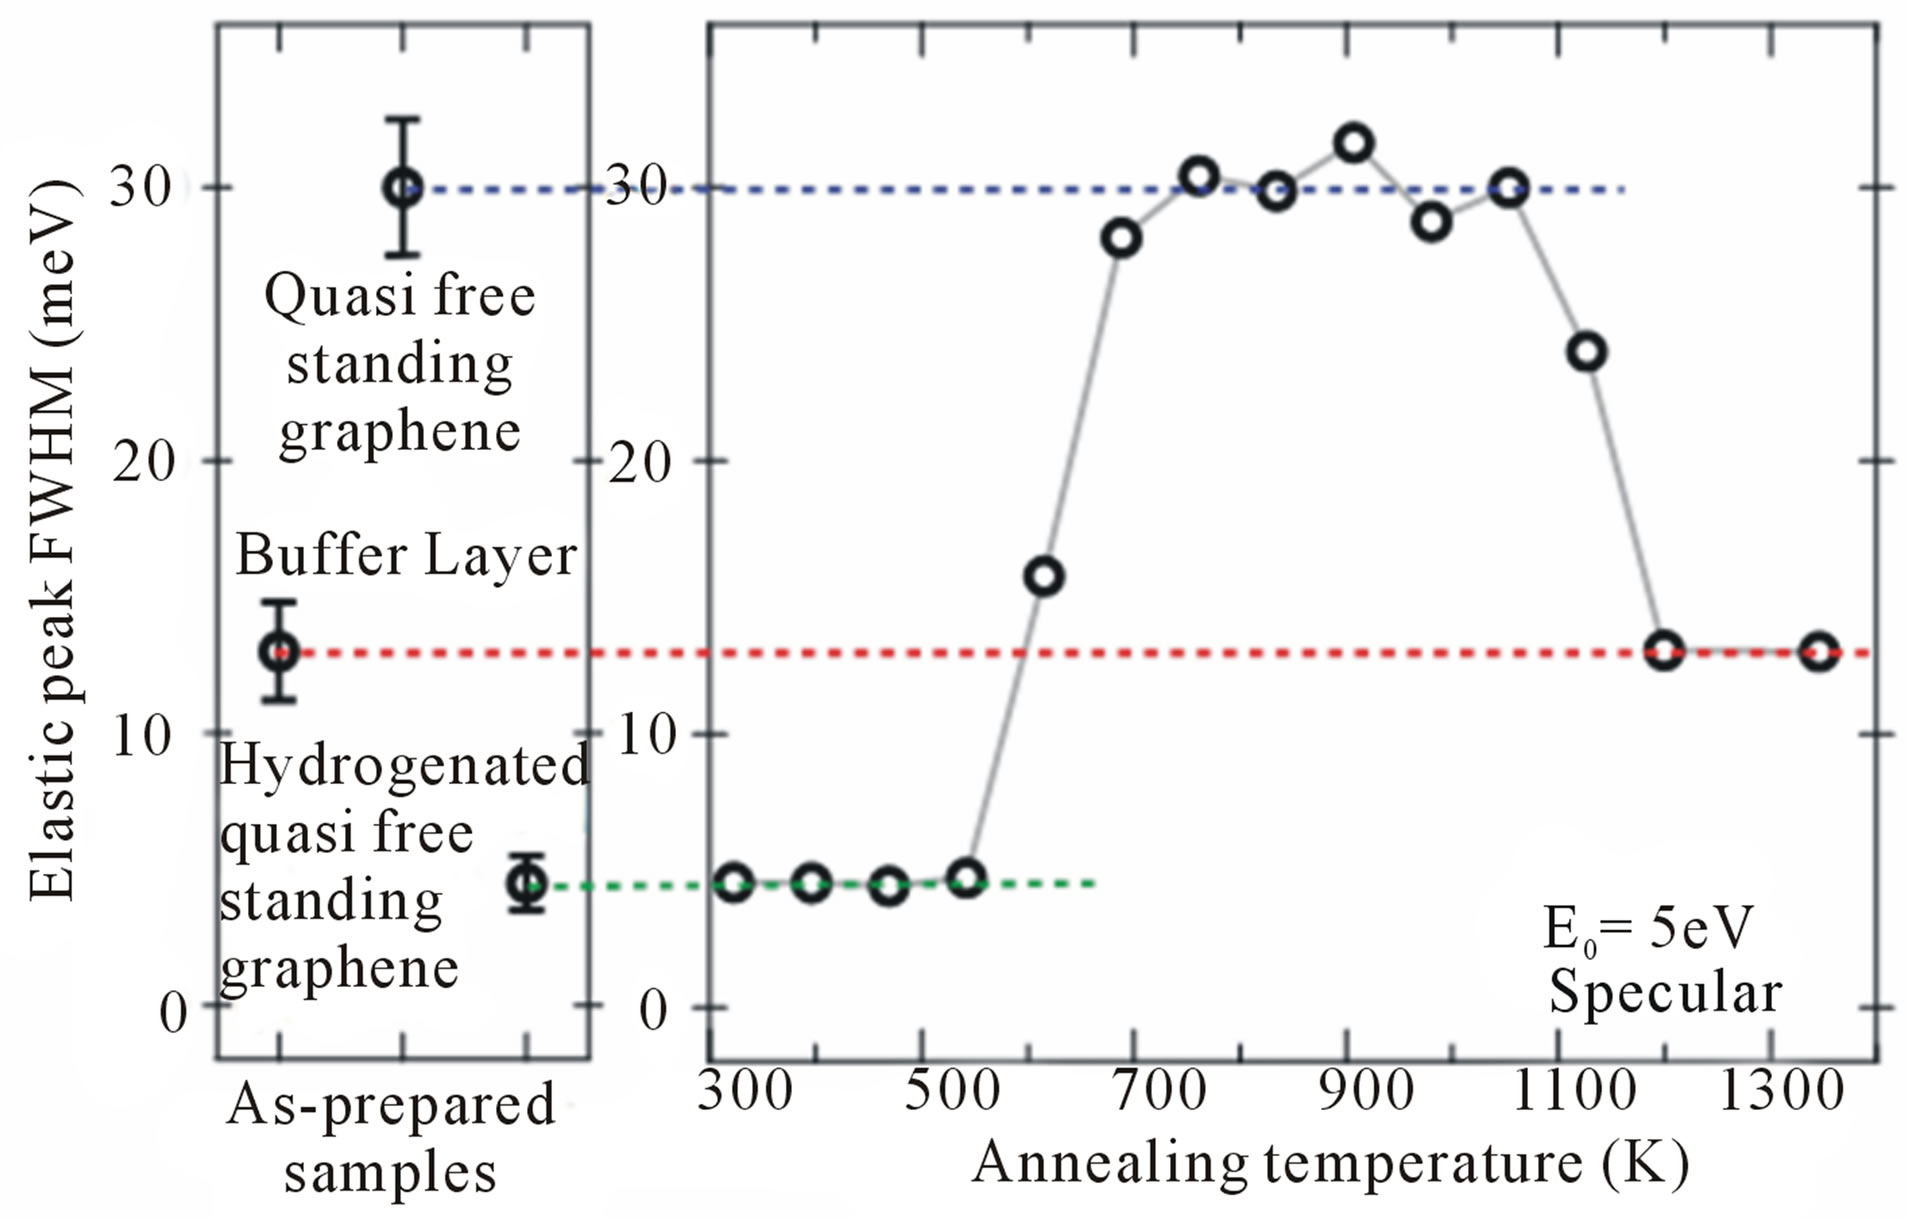
Figure 9. Evaluation of the HREELS elastic peak FWHM of SiC-D/QFMLG-H upon annealing. The uncertain annealing temperature is estimated to be ±5%. Error bars represent the ±σ variation of FWHM measured across the entire surface of several samples [55].
have been determined (Table 2) as the reaction (hydrogen desorption) activation energy
 and the per-exponential factor of the reaction rate constant
![]() . The obtained value of
. The obtained value of  is close (within the errors) to the similar ones (ETDS-peak # 1 [5] and ETDS-peak # 2) for TDS processes # 1 and # 2 (Item 2.4, Table 1). But the obtained value
  differs by several orders from the similar ones (
 and
and ) for TDS processes # 1 and # 2 (Item 2.4, Table 1). Nevertheless, these three desorption processes may be (in some extent) related to chemisorption models “H” and/or “G” (Figure 4). Model “H” corresponds to TDS process II in [14,18-21], for which the apparent diffusion activation energy is Qapp.II » 1.2 eV.
In the same way, one can treat the points from Figure 9 at Ti = 1010 K, 1120 K and 1200 K, which one are related to the intercalated deuterium desorption from SiCD/QFMLG samples. This results in finding the desired quantities (Table 2): the reaction (deuterium desorption) activation energy
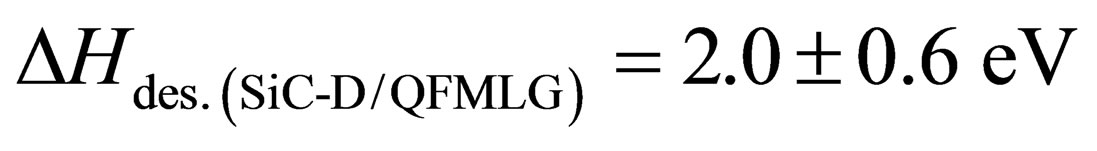 and the per-exponential factor of the reaction rate constant
![]() . Formally, this desorption process (of a diffusion-limiting character) may be described similarly to TDS process (peak) III in [14, 18-21], and the apparent diffusion activation energy may be close to the break-down energy of the Si-H bonds. As concluded in [55], the exact intercalation mechanism of hydrogen diffusion through the anchored graphene lattice, at a defect or at a boundary of the anchored graphene layer, remains an open question.
. Formally, this desorption process (of a diffusion-limiting character) may be described similarly to TDS process (peak) III in [14, 18-21], and the apparent diffusion activation energy may be close to the break-down energy of the Si-H bonds. As concluded in [55], the exact intercalation mechanism of hydrogen diffusion through the anchored graphene lattice, at a defect or at a boundary of the anchored graphene layer, remains an open question.
It is reasonable to assume that the quasi-free-standing monolayer graphene on the SiC-D substrate is permeable to atomic hydrogen (at room temperature) in some defect nano-regions (probably, in vacancies and/or triple junctions (nodes) of the grain-boundary network [33-42,49]). It would be expedient to note that the HREELS data [55] on bending and stretching vibration C-H frequencies in SiC-D/QFMLG-H samples (153 meV (3.7∙1013 s−1)) and 331 meV (8.0∙1013 s−1), respectively) are consistent with those considered in Section 2.2, related to the HREELS data for the epitaxial graphene.
The obtained characteristics (Table 2) of desorption processes [51,52,55] show that these processes may be of a diffusion-rate-controlling character [14].
3.4. Analysis of the Raman Spectroscopy Data on Thermal Desorption of Hydrogen from Hydrogenated Graphene Layers on SiO2 Substrate
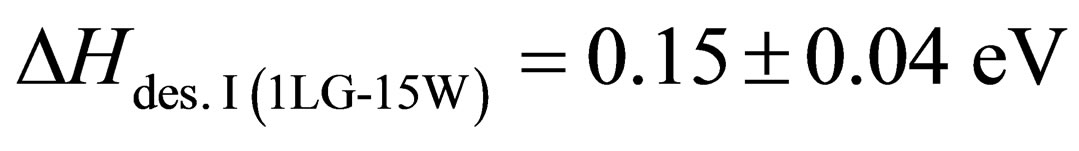
In [56], graphene layers on SiO2/Si substrate have been chemically decorated by radio frequency hydrogen plasma (the power of 5 - 15 W, the pressure of 1 Tor) treatment for 1 min. As seen from the investigation of hydrogen coverage by Raman spectroscopy and micro-x-ray photoelectron spectroscopy characterization demonstrates that the hydrogenation of a single layer graphene on SiO2/Si substrate is much less feasible than that of bilayer and multilayer graphene. Both the hydrogenation and dehydrogenation processes of the graphene layers are controlled by the corresponding energy barriers, which show significant dependence on the number of layers. These results [56] on bilayer graphene/SiO2/Si are in contradiction to the results [5] on a negligible hydrogenation of bilayer epitaxial graphene on SiO2/Si wafer, when obviously other defects are produced.
Within a formal kinetics approach [14,46], the kinetic data from Figure 10(a) for single layer graphene samples (1LG-5W and 1LG-15W ones) can be treated. Equation (7) is used to transform into a more suitable form (7’):
 where
where  = 1800 s, and DC and C are determined from Figure 10(a).
The results have been obtained for 1LG-15W sample 3 values of the I reaction rate constant  for 3 temperatures (T = 373, 398 and 423 K), and 3 values of the II reaction rate constant
  for 3 temperatures (T = 523, 573 and 623 K). Hence, by using Equation (9), the following values for 1LG-15W samples have been determined (Table 3): the I reaction activation energy
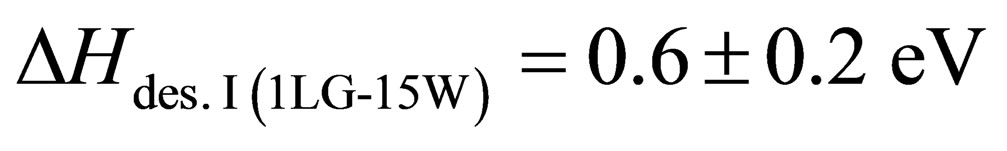 , the per-exponential factor of the I reaction rate constant
![]() , the II reaction activation energy
, the II reaction activation energy
 (a)
(a)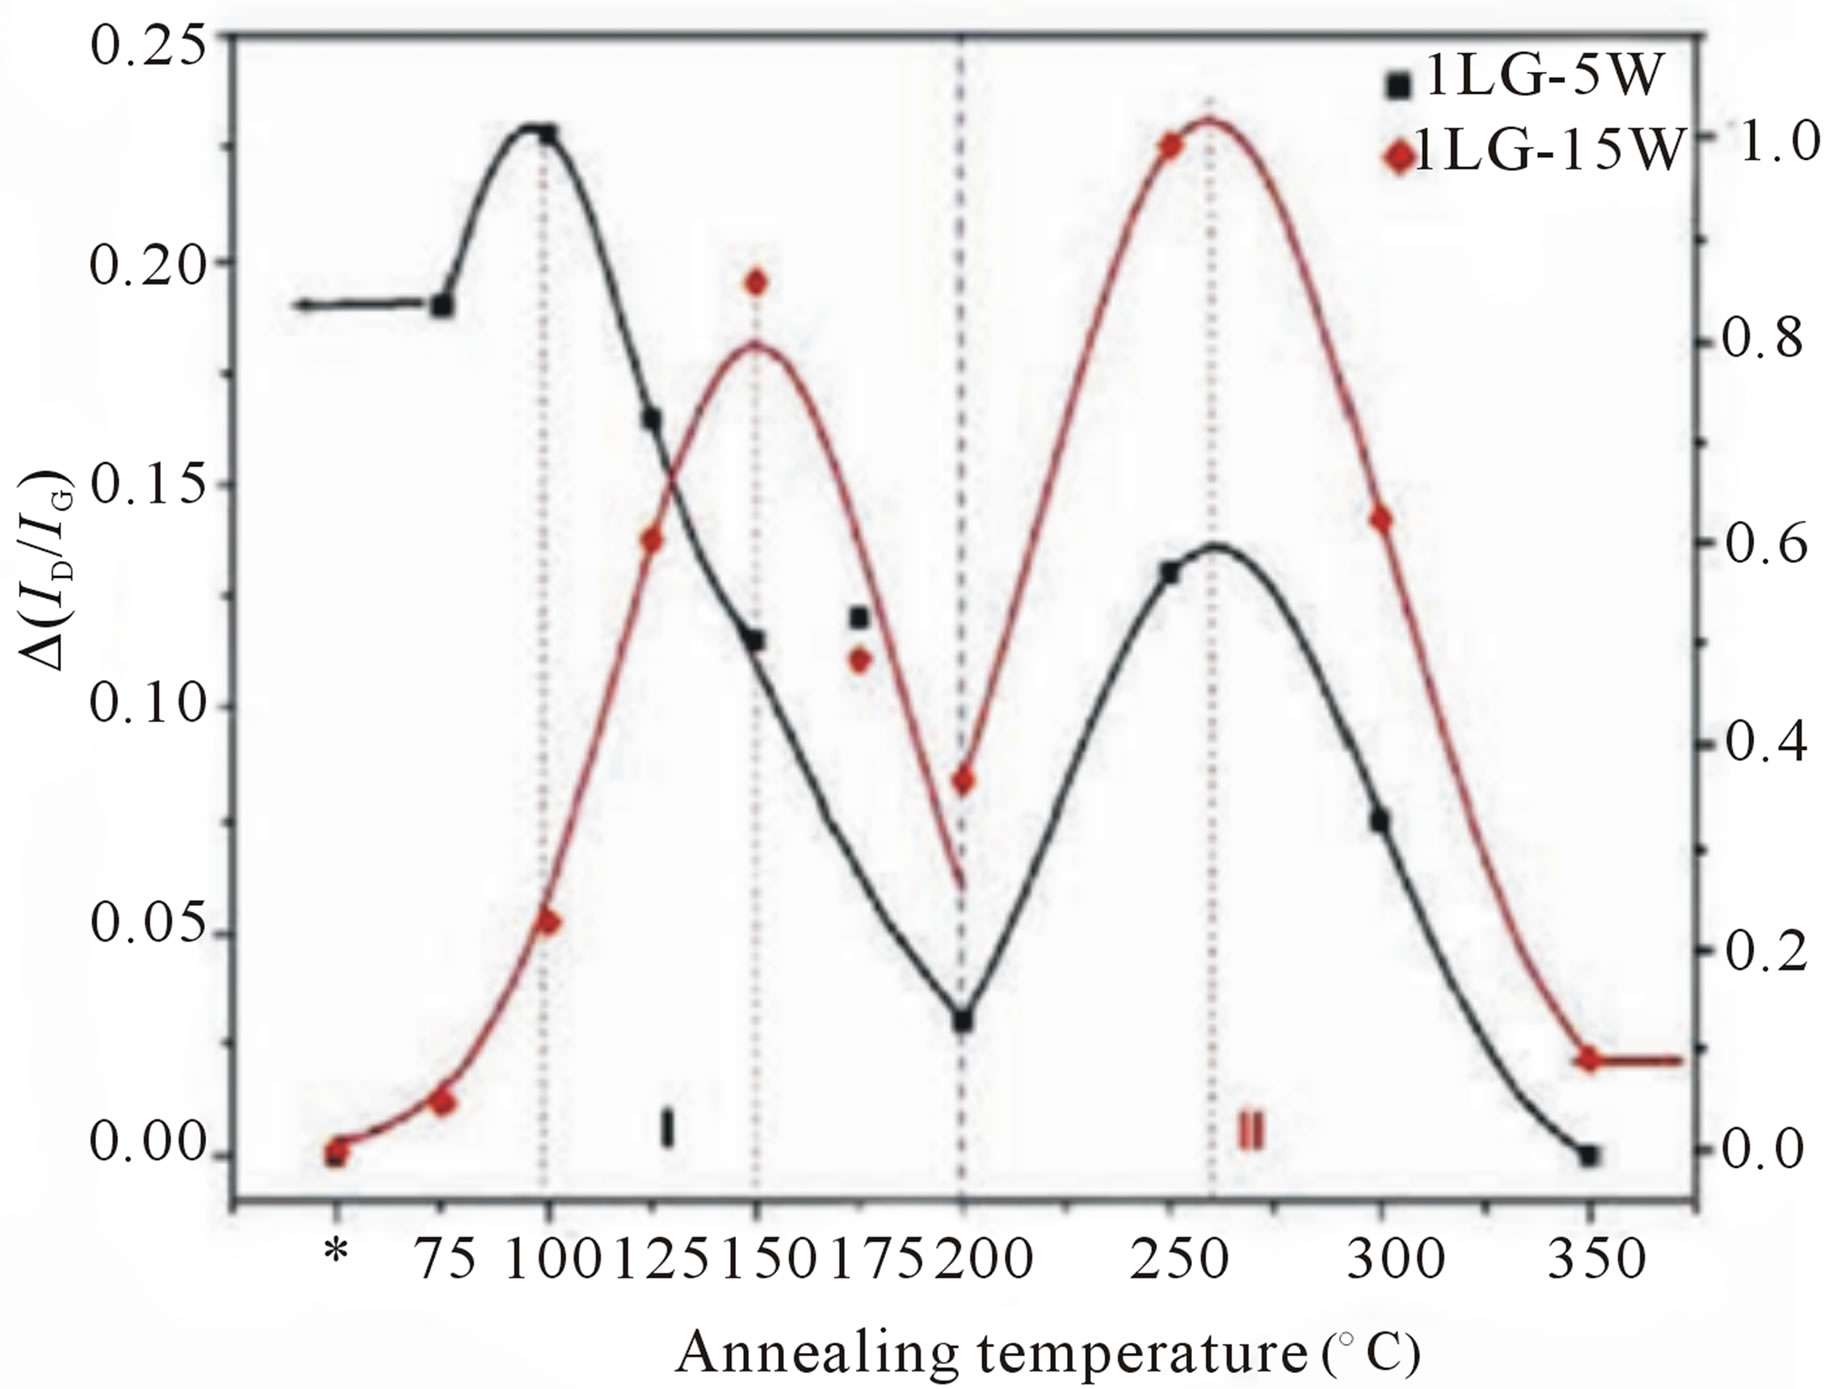 (b)
(b) (c)
(c)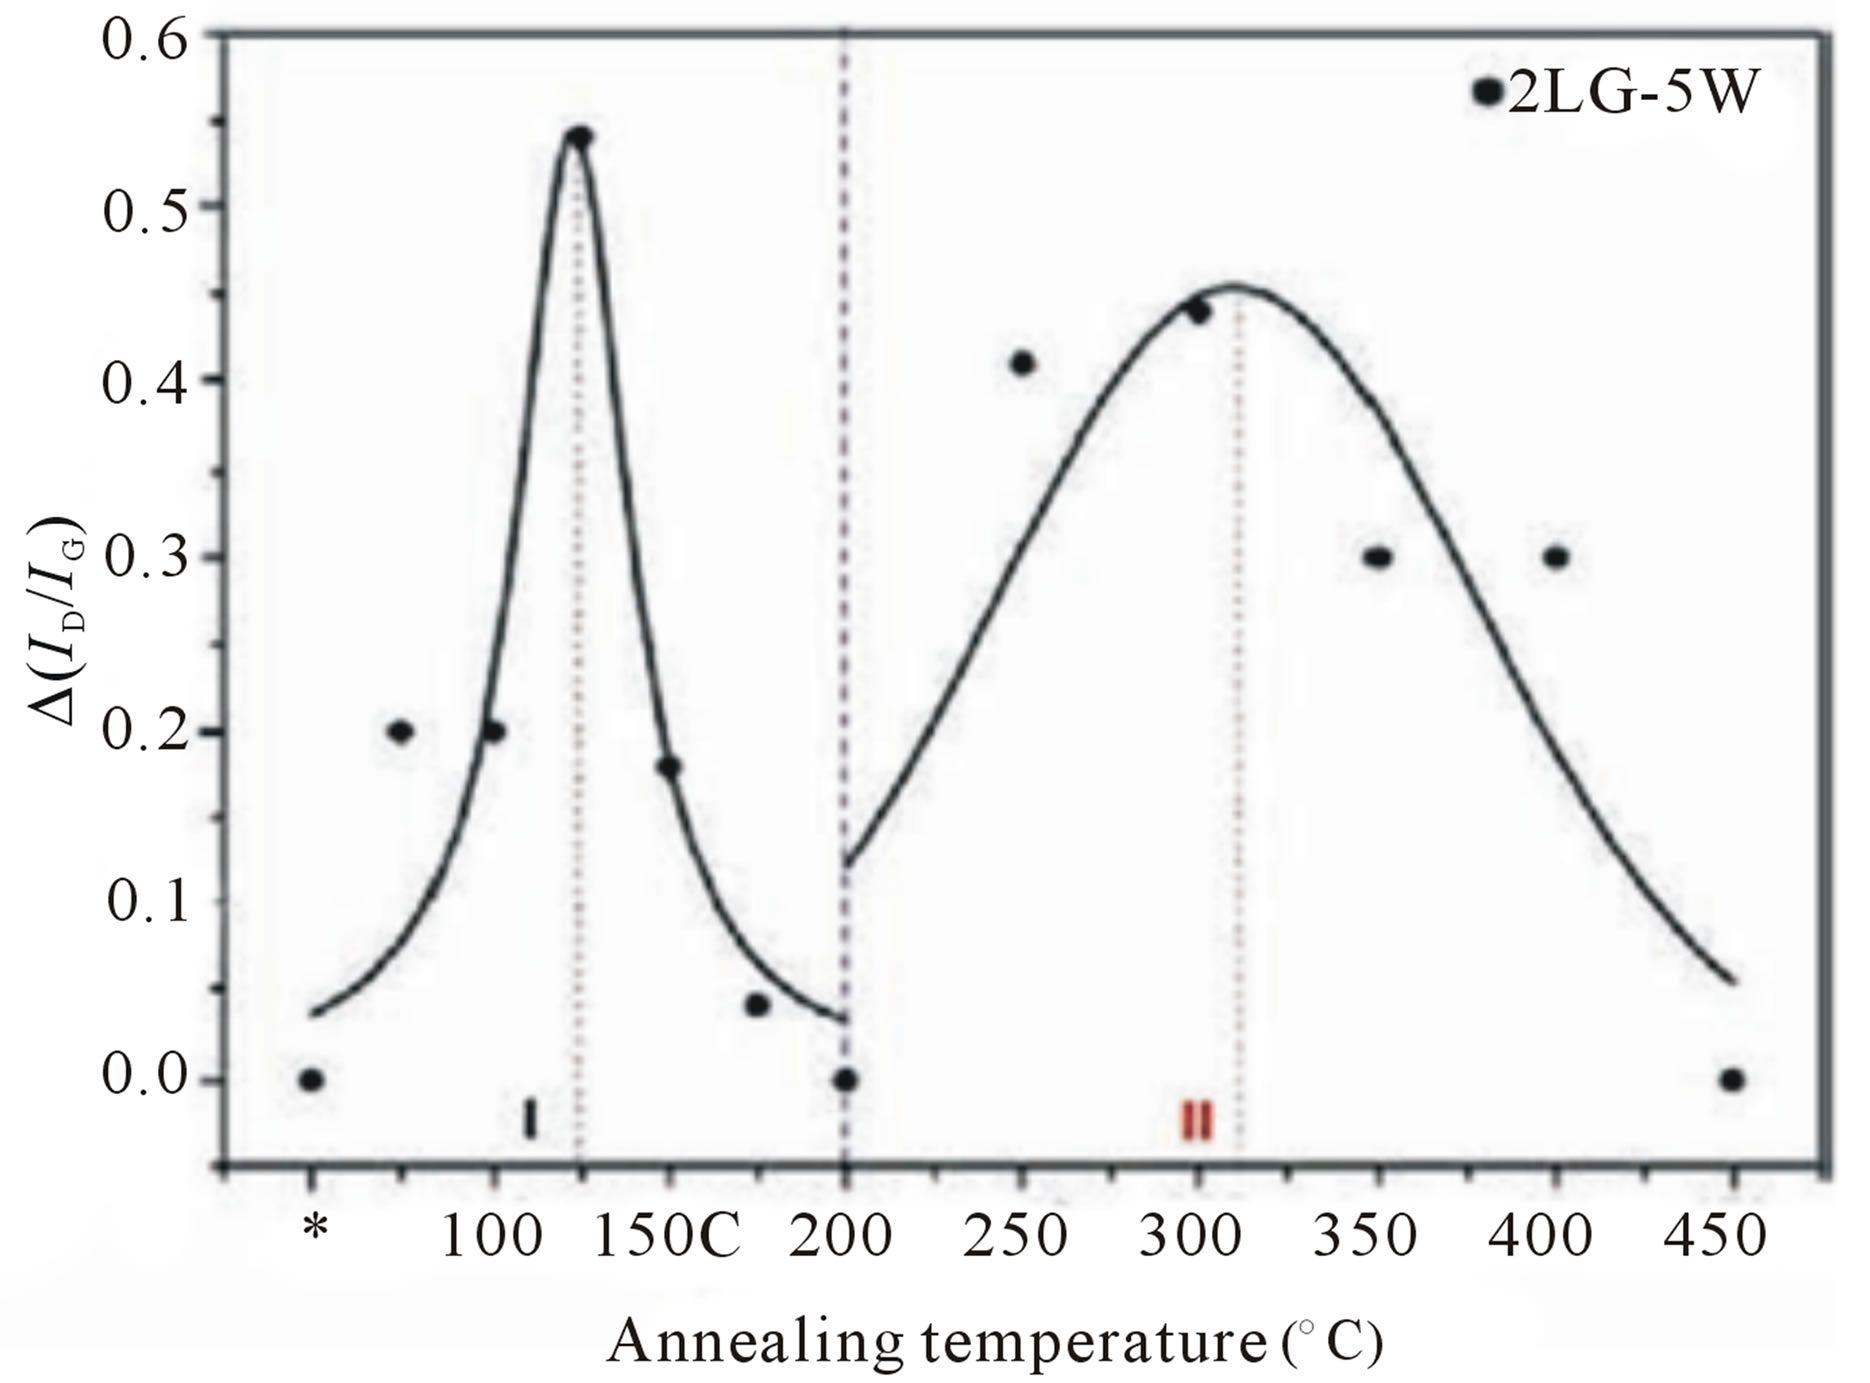 (d)
(d)
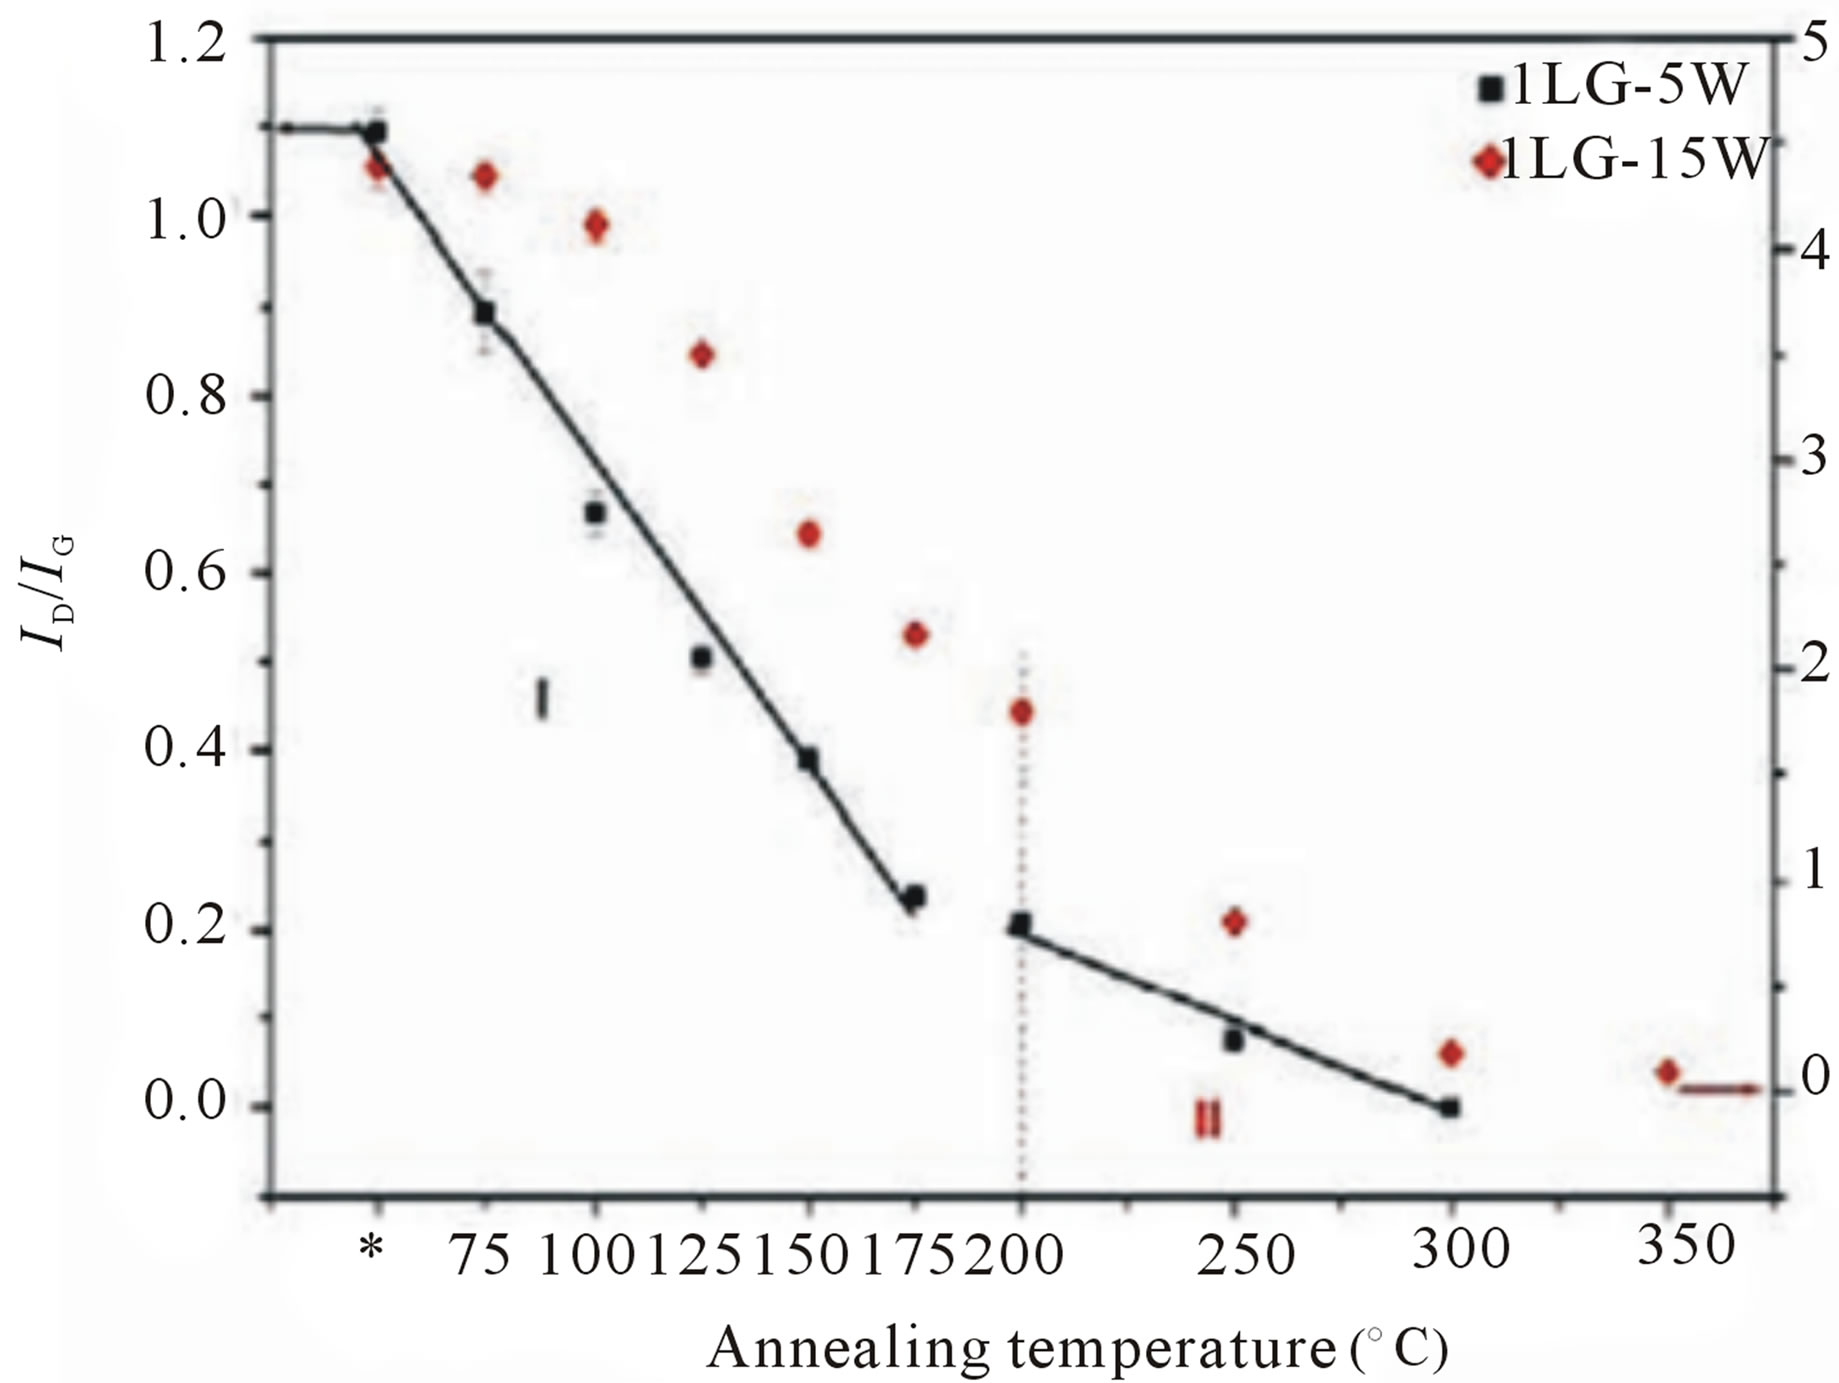
Figure 10. (a) The evoluation of the D and G band intensity ratio (ID/IG) with annealing temperatures of 1LG (single-layer graphene) hydrogenated by 5 and 15 W (the power), 1 Torr hydrogen plasma for 1 min [56]; (b) the evoluation of  with annealing temperatures of 1 LG hydrogenated by 5 and 15 W, 1 Torr hydrogen plasma for 1 min; (c) the evoluation of the D and G band intensity ratio (ID/IG) with annealing temperatures of 2 LG (bi-layer graphene) hydrogenated by 5 and 15 W, 1 Torr hydrogen plasma for 1 min; (d) the evoluation of
  with annealing temperatures of 2 LG hydrogenated by 5 and 15 W, 1 Torr hydrogen plasma for 1 min. The asterisk (*) denotes the as-treated sample by H2 plasma.
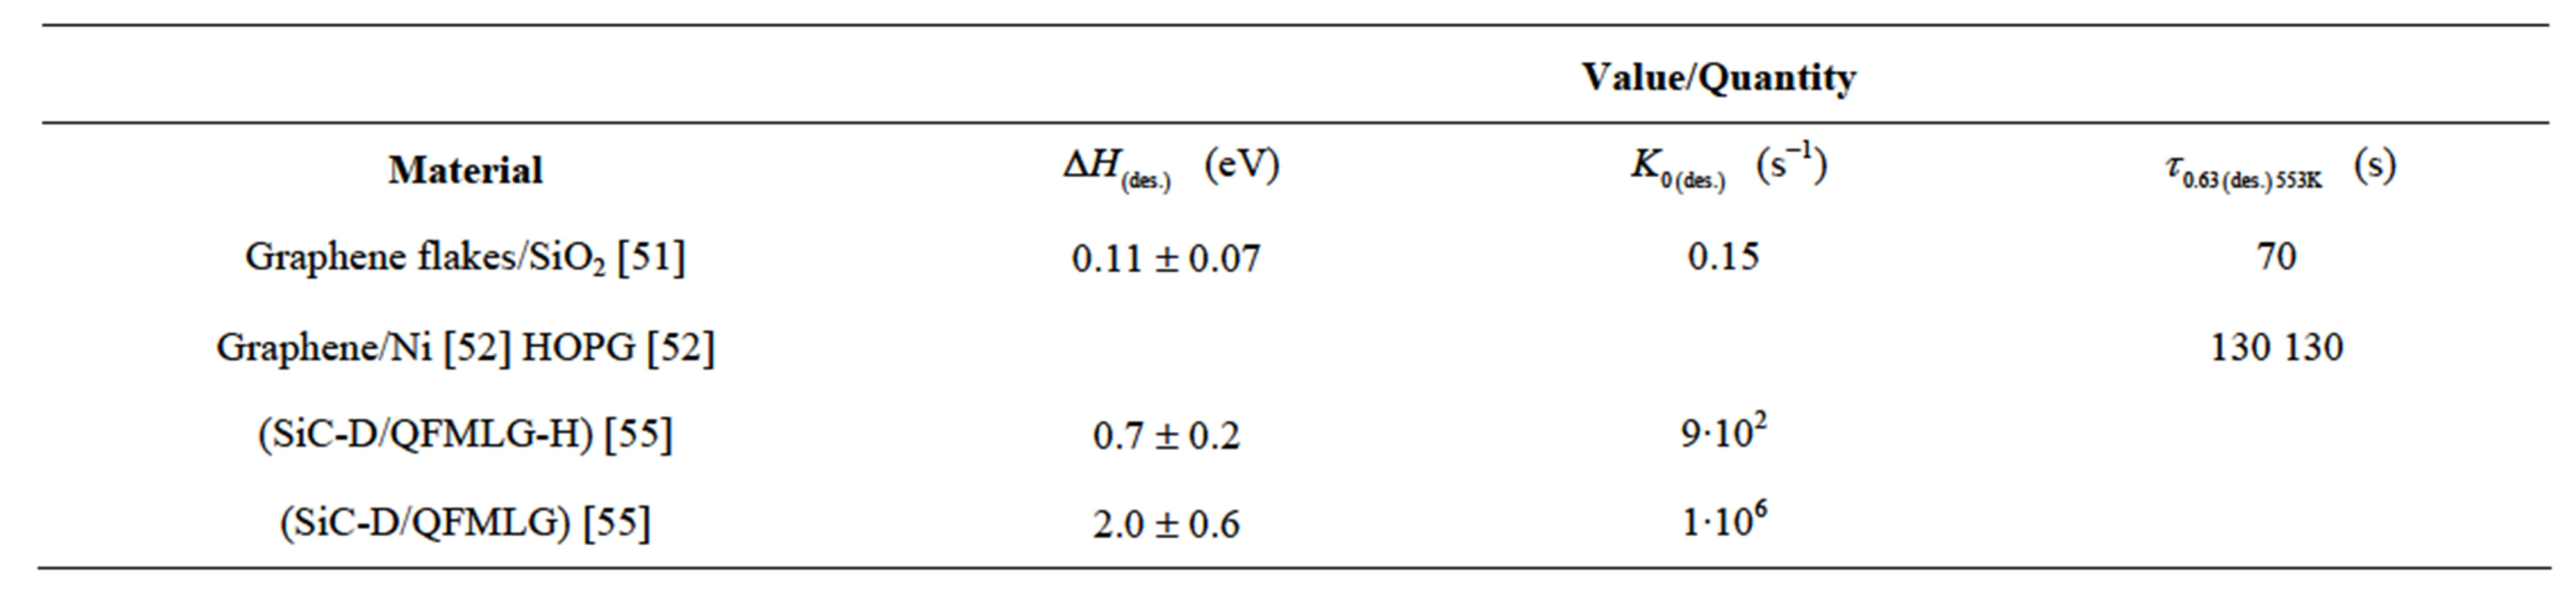
Table 2. Analytical results of Sections 3.1 - 3.3.
 and the per-exponential factor of the II reaction rate constant
![]() . It also resulted in finding for 1LG-5W sample 4 values of the I[56] reaction rate constant
. It also resulted in finding for 1LG-5W sample 4 values of the I[56] reaction rate constant  for 4 temperatures (T = 348, 373, 398 and 423 K), and 2 values of the II reaction rate constant
  for 2 temperatures (T = 523 and 573 K). Therefore by using Equation (9), one can evaluate the desired quantities for 1LG-5W specimens (Table 3): the I reaction activation energy
 the per-exponential factor of the I reaction rate constant
![]() , the II reaction activation energy
, the II reaction activation energy , and the per-exponential factor of the II reaction rate constant
![]() . A similar treatment of the kinetic data from Figure 10(c) for bilayer graphene 2LG- 15W samples resulted in obtaining 4 values of the II reaction rate constant
. A similar treatment of the kinetic data from Figure 10(c) for bilayer graphene 2LG- 15W samples resulted in obtaining 4 values of the II reaction rate constant  for 4 temperatures (T = 623, 673, 723 and 773 K). Hence, by using Equation (9), the following desired values are found (Table 3): the II reaction activation energy
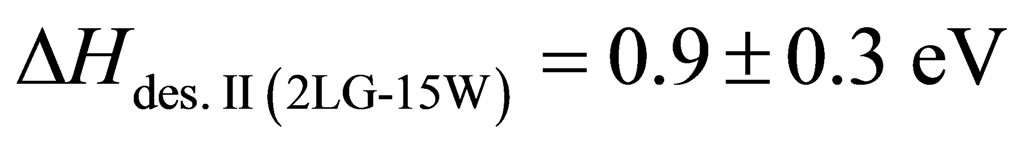 , the per-exponential factor of the II[56] reaction rate constant
![]() .
.
A similar treatment of the kinetic data from Figure 6(c) in [56] for bilayer graphene 2LG-5W samples results in obtaining 4 values for the I reaction rate constant  for 4 temperatures (T = 348, 373, 398 and 423 K), and 3 values for the II reaction rate constant
  for 3 temperatures (T = 573, 623 and 673 K). Their temperature dependence is described by Equation (9). Hence, one can evaluate the following desired values (Table 3): the I reaction activation energy
 , the per-exponential factor of the I reaction rate constant
![]() the II reaction activation energy
the II reaction activation energy
 and the per-exponential factor of the II reaction rate constant
![]() .
.
The obtained characteristics (Table 3) of the desorption processes I and II show that these processes may be of a diffusion-rate-controlling character.
3.5. Analysis of TDS and STM Data on HOPG Treated by Deuterium
In [57], the results are present of a scanning tunneling microscopy (STM) study of graphite (HOPG) treated by atomic deuterium, which reveals the existence of two distinct hydrogen dimer states on graphite basal planes (Figure 11 and Figure 12(b)). The density functional theory calculations allow them to identify the atomic structure of these states and to determine their recombination and desorption pathways. As predicted, the direct recombination is only possible from one of the two dimer states. In conclusion, this results in an increased stability of one dimer species, and explains the puzzling double peak structure observed in temperature programmed desorption (TPD or TDS) spectra for hydrogen on graphite (Figure 12(a)) [57].
By using the described method of TPD (TDS) peak treatment (for the first order reactions), relevant to TPD (TDS) peak I (~65% of the total area, Tmax # I » 473 K) in Figure 12(a), one can obtain values of the reaction I rate constant ( ) for several temperatures (for instance, T = 458, 482 and 496 K) [14]. Their temperature dependence can be described by Equation (9). Hence, the desired values are defined as follows (Table 3): the reaction (desorption) I activation energy
 and the per-exponential factor of the reaction I rate constant
![]() . In a similar way, relevant to TPD (TDS) peak II (~35% of the total area, Tmax#II » 588 K)) in Figure 12(a), one can obtain values of the reaction II rate constant (
. In a similar way, relevant to TPD (TDS) peak II (~35% of the total area, Tmax#II » 588 K)) in Figure 12(a), one can obtain values of the reaction II rate constant ( ) for several temperatures (for instance, T = 561 and 607 K). Hence, the desired values are defined as follows (Table 3): the reac tion (desorption) II activation energy
 ,
,

Table 3. Some analytical (an.) results of Items 3.4, 3.5, 3.6, 3.7 and 4.
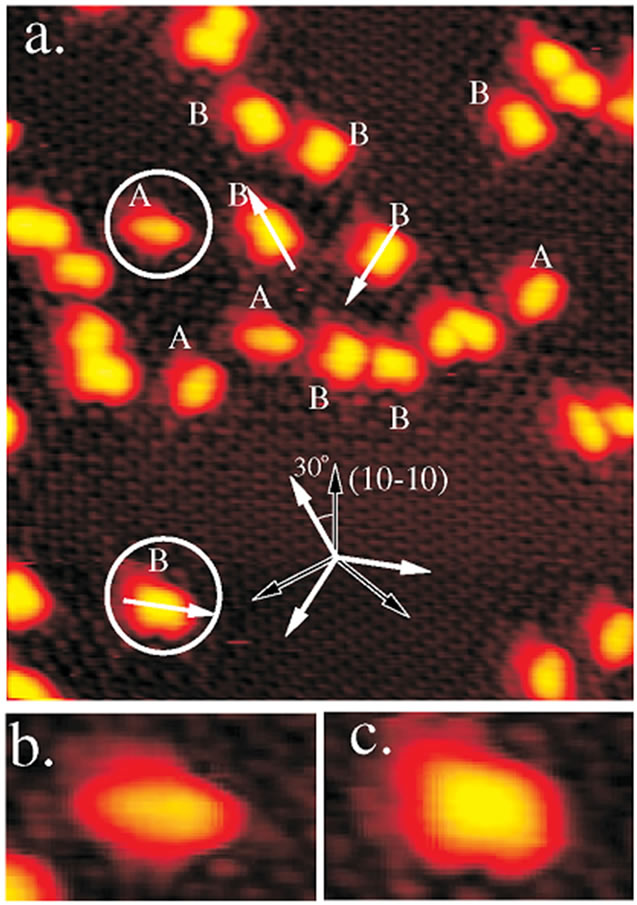
Figure 11. (a) STM image (103 × 114 Å2) of dimer structures of hydrogen atoms on the graphite surface after a 1 min deposition at room temperature [57]. Imaging parameters: Vt = 884 mV, It = 160 pA. Examples of dimmer type A and B are marked. Black arrows indicate ‹21‾1‾0› directions and white arrows indicate the orientation of the dimers 30˚ off. (c) Close up of dimer B structure in lower white circle in image (a).
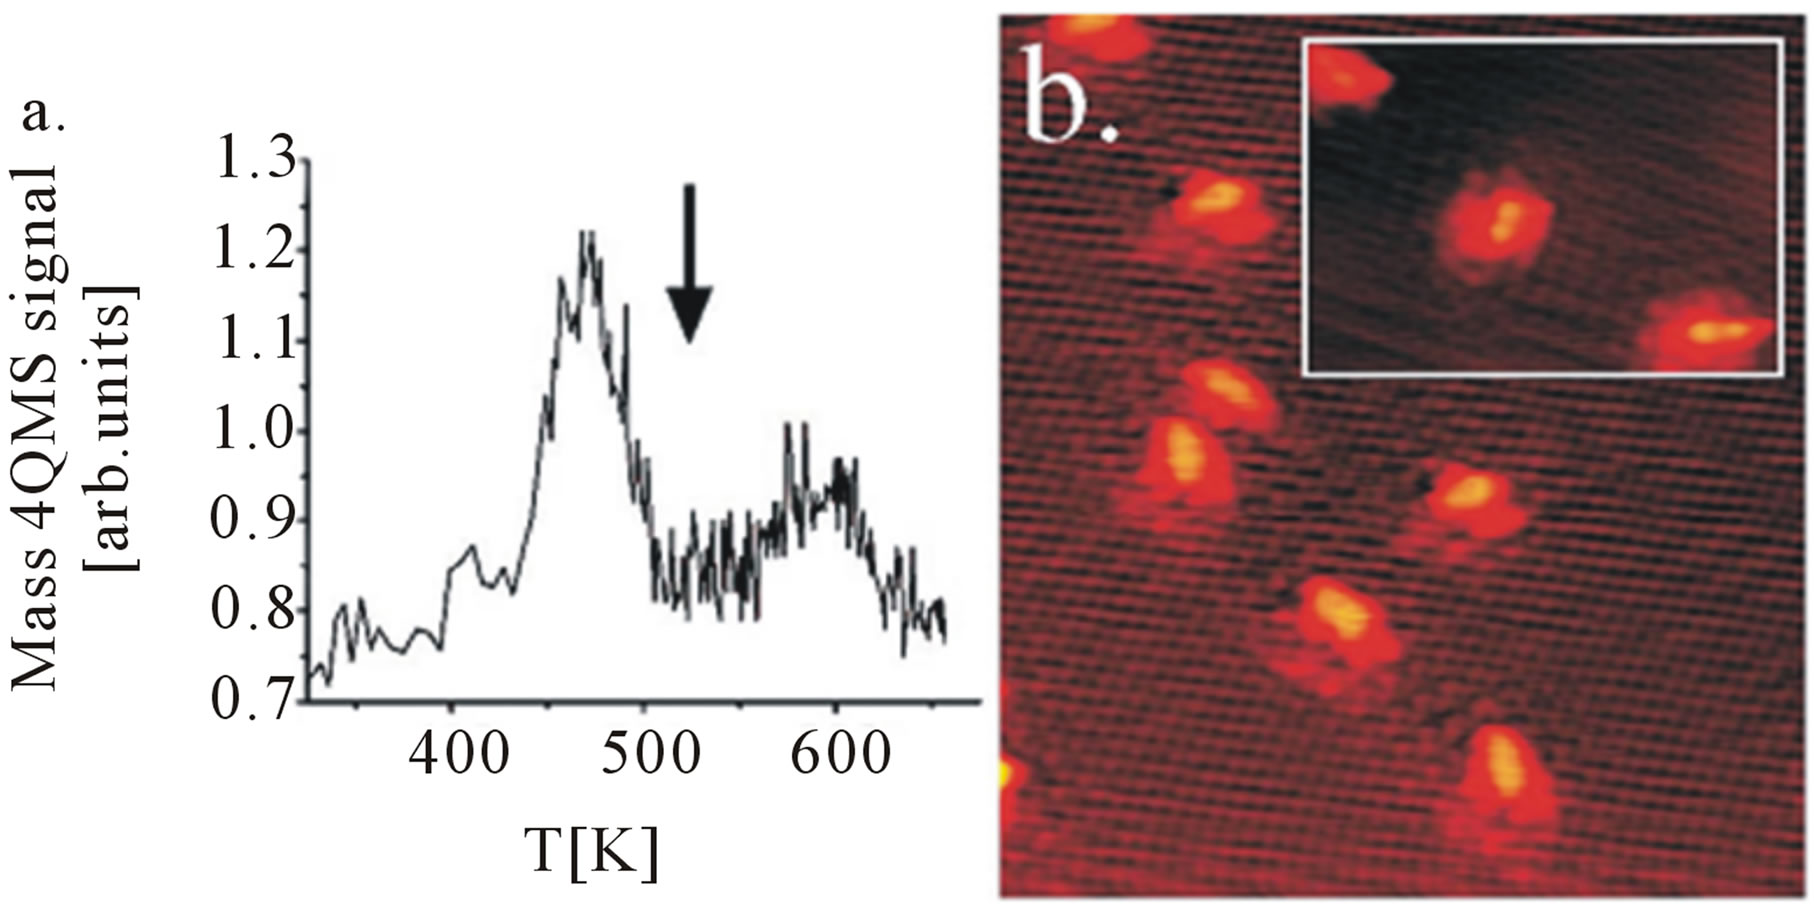
Figure 12. (a) A mass 4 amu, i.e., D2, TPD spectrum from the HOPG surface after a 2 min D atom dose (ramp rate: 2 K/s below 450 K, 1 K/s above) [57]. The arrow indicates the maximum temperatue of the thermal anneal performed before recording the STM image in (b). (b) STM image (103 × 114 Å2) of dimer structures of hydrogen atoms on the graphite surface after a 1 min deposition at room temperature and subsequent anneal to 525 K (ramp rate: 1 K/S, 30 s dwell at maximum temperature). Imaging parameters: Vt = 884 mV, It = 190 pA. The inset shows a higher resolution STM image of dimer structures of hydrogen atoms on the graphite surface after a 6 min deposition at room temperature and subsequent anneal to 550 K. Imaging parameters: Vt = −884 mV, It = −210 pA.
and the per-exponential factor of the reaction II rate constant ![]()
The obtained characteristics (Table 3) of the desorption processes I and II show that these processes probably are of a diffusion-rate-controlling character [14]. In a diffusion-rate-controlling case, these processes can not be described by using the Polanyi-Wigner equation (as it has been done in [57]). The observed in “nano-dimer states” or “nano-protrusions” (Figure 11 and Figure 12(b)) may be related to the defected nano-regions, probably, as grain (domain) boundaries [49] and/or triple and other junctions (nodes) of the grain-boundary network in the HOPG samples. Some defected nano-regions at the grain boundary network (hydrogen adsorption centers #I, mainly, the “dimer B” structures) can be related to TPD (TDS) peak I, the others (hydrogen adsorption centers #II, mainly, the “dimer A” structures) to TPD (TDS) peak II.
In Figures 11(a) and 12(b), one can imagine some grain boundary network (with the grain size of about 2 - 5 nm) decorated (in some nano-regions at grain boundaries) by some bright nano-protrusions. Similar “nanoprotrusions” are observed and in graphene/SiC systems (Figures 13 and 14 from [58], and Figures 15 and 16 from [17]).
In Figures 13(a) and 14(b) [58], one can also imagine some grain boundary network (with the grain size of about 2 - 5 nm) decorated in some nano-regions at grain boundaries, by some bright nano-protrusions [33-42,49].
In [58], hydrogenation was studied by a beam of atomic deuterium 1012 - 1013 cm−2∙s−1 (corresponding to PD » 10−4 Pa) at 1600 K, and the time of exposure of 5 - 90 s, for single graphene on SiC-substrate. The formation of graphene blisters were observed, and intercalated with hydrogen in them (Figures 13 and 14), similar to those observed on graphite [57] (Figures 11 and 12) and graphene/SiO2 [17] (Figures 15 and 16). The blisters [58] disappeared after keeping the samples in vacuum at 1073
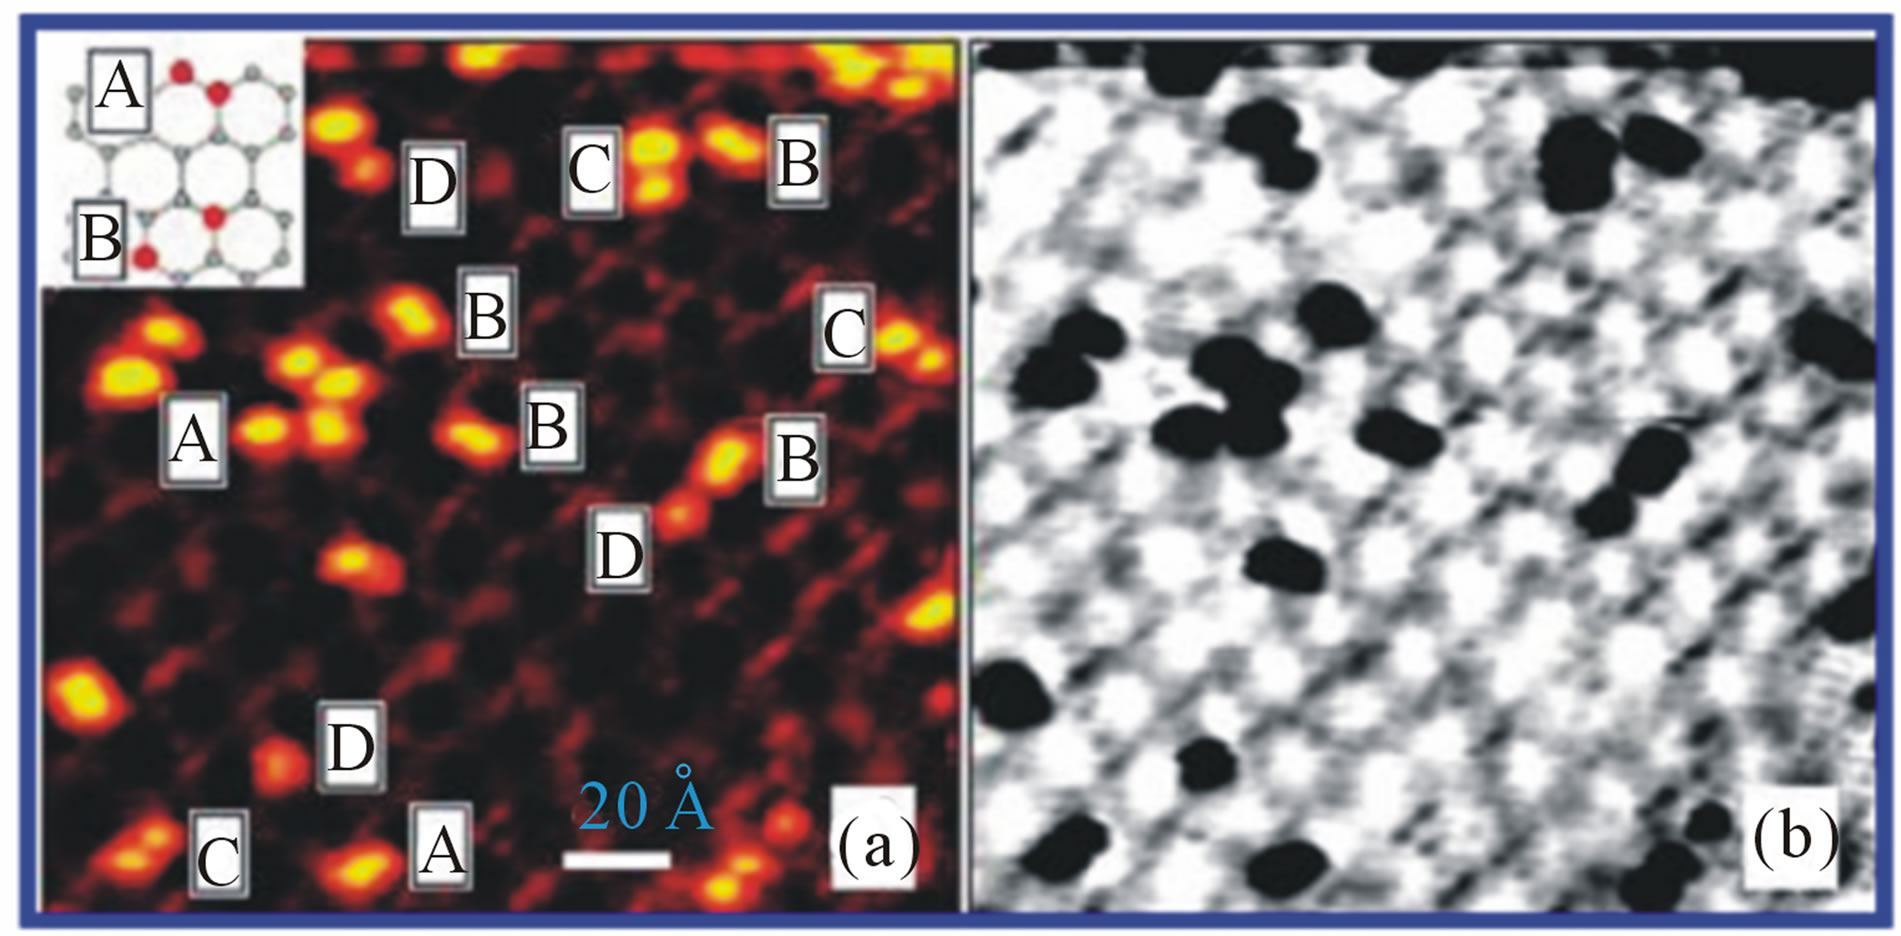
Figure 13. (a) Scanning tunneling microscopy (STM) image of hydrogenated graphene [58]. The bright protrusions visible in the image are atomic hydrogen adsorbate structures identified as A = ortho-dimers, B = para-dimers, C = elongated dimers, D = monomers (imaging parameters: Vt = −0.245 V, It = −0.26 nA). Inset in (a); Schematic of the A orthoand B para-dimer configuration on the graphene lattice. (b) Same image as in (a) with inverted color scheme, giving emphasis to preferential hydrogen adsorption along the 6 × 6 modulation on the SiC (0001)-(1 × 10 surface. Hydrogen dose at Tbeam = 1600 K, t = 5 s, F = 1012 - 1013 atoms/cm2∙s.
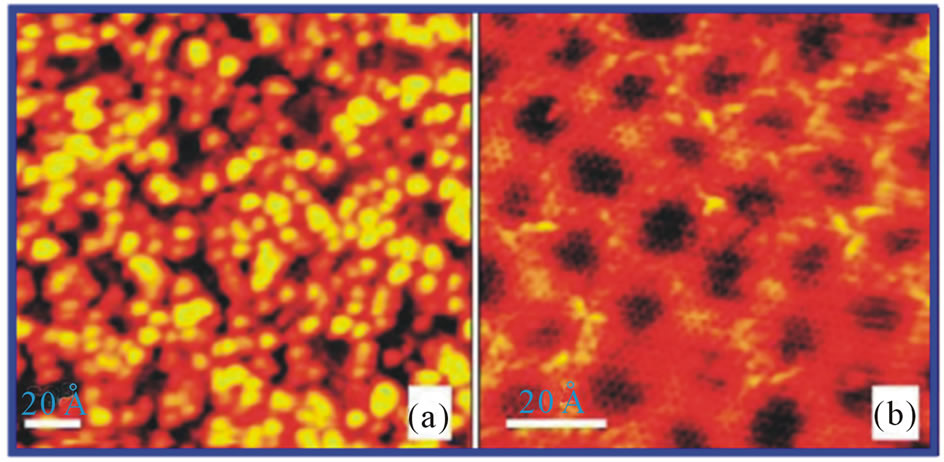
Figure 14. (a) STM image of the graphene surface after extended hydrogen exposure [58]. The bright protrusions visible in the image are atomic hydrogen clusters (imaging parameters: Vt = −0.36 V, It = −0.32 nA). Hydrogen dose at T = 1600 K, t = 90 s, F = 1012 - 1013 atoms/cm2 s. (b) Large graphene area recovered from hydrogenation by annealing to 1073 K (imaging parameters: Vt = −0.38 V, It = −0.41 nA).
K (~15 min). By using Equation (8), one can evaluate the quantity of , which coincides (within the errors) with the similar quantity of
  evaluated for graphene/SiC samples [17] (Item 3.6, Table 3).
A nearly complete decoration of the grain boundary network [33-42,49] can be imagined in Figure 15(b). Also, seen in Figure 16, such decoration of the nanoregions (at the grain boundaries [33-42,49]) has a blister-like cross-section of height of about 1.7 nm and width of 10 nm order.
According to the thermodynamic analysis presented in Section 3.7, Equation (15), such blister-like decoration nano-regions (at the grain boundaries [33-42,49]) may contain the intercalated gaseous molecular hydrogen at a high pressure.
3.6. Analysis of PES and ARPES Data on Dehydrogenation of Graphene/SiC Samples
Atomic hydrogen exposures at a pressure of PH » 1∙10−4 Pa and temperature T = 973 K on a monolayer graphene grown on the SiC (0001) surface are shown, to result in hydrogen intercalation [17]. This shows that the hydrogen intercalation induces a transformation of the monolayer graphene and the carbon buffer layer to bi-layer graphene without a buffer layer. The STM, LEED, and core-level photoelectron spectroscopy (PES) measurements reveal that hydrogen atoms can go underneath the graphene and the carbon buffer layer. This transforms the buffer layer into a second graphene layer. Hydrogen exposure (15 min) results initially in the formation of bilayer graphene (blister-like) islands with a height of ~0.17 nm and a linear size of ~20 - 40 nm, covering about 40% of the sample (Figures 15(b), 15(e), 16(a) and 16(b)). With larger (additional 15 min) atomic hydrogen exposures, the islands grow in size and merge until the surface is fully covered with bi-layer graphene (Figures 15(c), 15(f), 16(c) and 16(d)). A (√3 ×√3) R30˚ periodicity is observed on the bi-layer areas. Angle resolved photoelectron spectroscopy (ARPES) and energy filtred X-ray photoelectron emission microscopy (XPEEM) investigations of the electron band structure confirm that after hydrogenation the single p-band characteristic of monolayer graphene is replaced by two pbands that represent bi-layer graphene. Annealing an intercalated sample, representing bi-layer graphene, to a temperature of 1123 K or higher, re-establishes the monolayer graphene with a buffer layer on SiC (0001).
The dehydrogenation has been performed by subsequently annealing (for a few minutes) the hydrogenated samples at different temperatures, from 1023 to 1273 K. After each annealing step, the depletion of hydrogen has been probed by PES and ARPES (Figures 17 and 18). From this data, by using Equations (8) and 9), one can determine the following tentative quantities:  (at 1023 K and 1123 K),
and ![]() (Table 3). These results can be interpreted so that the model of the interaction of hydrogen and silicon atoms at the graphene-SiC interface result in Si-C bonds at the intercalated islands. Obviously, the quantities of
(Table 3). These results can be interpreted so that the model of the interaction of hydrogen and silicon atoms at the graphene-SiC interface result in Si-C bonds at the intercalated islands. Obviously, the quantities of  and
and  correspond to those of the Polanyi-Wigner equation [14] relevant for the Si-C bonds [17].
3.7. Analysis of TDS and STM Data on HOPG Treated by Hydrogen
Atomic hydrogen accumulation in HOPG samples and etching their surface on hydrogen thermal desorption (TD) have been studied by using a scanning tunneling microscope (STM) and atomic force microscope (AFM). STM investigations revealed that the surface morphology of untreated reference HOPG samples was found to be atomically flat (Figure 19(a)), with a typical periodic structure of graphite (Figure 19(b)). Atomic hydrogen exposure (treatment) of the reference HOPG samples (30 - 125 min at atomic hydrogen pressure  and a near-room temperature (~300 K)) to different atomic hydrogen doses (D), has drastically changed the initially flat HOPG surface into a rough surface, covered with nanoblisters with an average radius of ~25 nm and an average height of ~4 nm (Figures 19(c) and 19(d)) [15].
Thermal desorption (TD) of hydrogen has been found in heating of the HOPG samples under mass spectrometer control. As shown in Figure 20(a), with the increase of the total hydrogen doses (D) to which HOPG samples have been exposed, the desorbed hydrogen amounts (Q) increase and the percentage of D retained in samples (Q) approaches towards a saturation stage. After TD, no
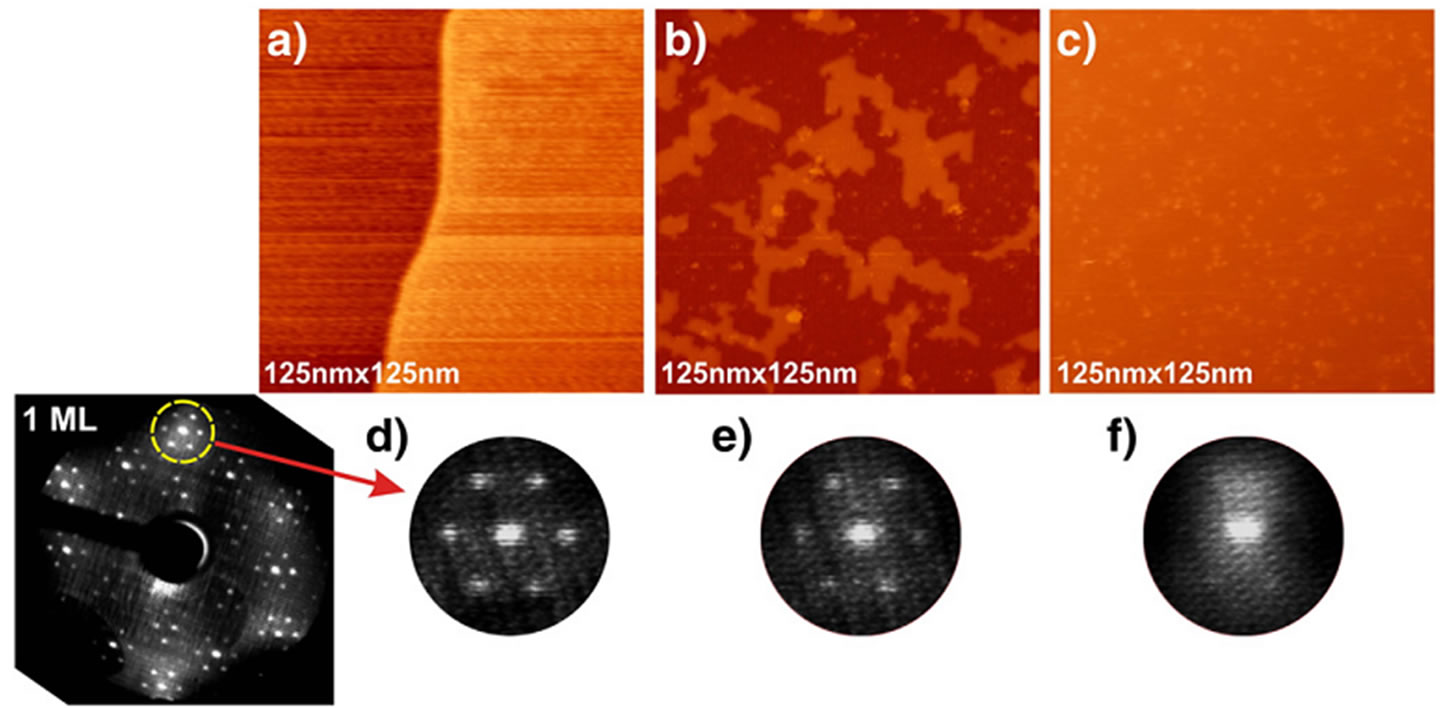
Figure 15. STM images [17] collected at V = −1 V and I = 500 pA of (a) monolayer graphene, (b) after a small hydrogen exposure, and (c) after a large hydrogen exposure. (d) Selected part of the LEED patern collected at E = 107 eV from monolayer graphene, (e) after a small hydrogen exposure, and (f) after a large hydrogen exposure.
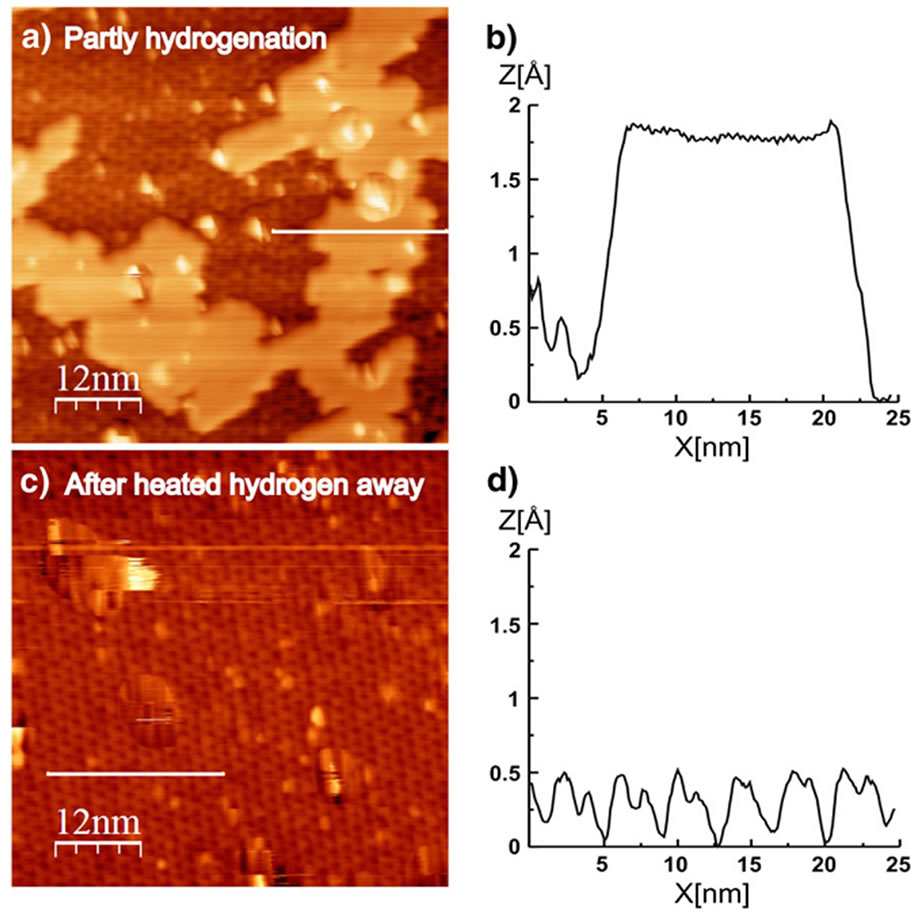
Figure 16. STM images [17] of (a) an island created by the hydrogen exposure (V = −1 V, I = 500 pA), (b) line profile across the iland, (c) a dehydrogenated sample showing mainly (6√3 × 6√3) R30˚ structure from the buffer layer (V = −2 V, I = 100 pA), and (d) line profile across the (6√3 × 6√3) R30˚ structure.
nanoblisters were visible on the HOPG surface, the graphite surface was atomically flat, and covered with some etch-pits of nearly circular shapes, one or two layers thick (Figure 20(b)). This implies that after release of the captured hydrogen gas, the blisters become empty of hydrogen, and the HOPG surface restores to a flat surface morphology under the action of corresponding forces.
According to [15], nanoblisters found on the HOPG surface after atomic hydrogen exposure are simply monolayer graphite (graphene) blisters, containing hydrogen gas in molecular form (Figure 21). As suggested, atomic hydrogen intercalates between layers in the graphite net through holes in graphene hexagons, because of the small diameter of atomic hydrogen, compared to the hole’s size, and is then converted to a H2 gas form which is captured inside the graphene blisters, due to the relatively large kinetic diameter of hydrogen molecules. However, such interpretation is in contradiction with that noted in Section 1 (Introduction) results [8,32], that it is almost impossible for a hydrogen atom to pass through the sixmembered ring of graphene at room temperature. It is reasonable to assume (as it’s been done in the previous Sections) that in HOPG [15] samples atomic hydrogen passes into the graphite near-surface closed nano-regions (the graphene nanoblisters) through defects (perhaps, mainly through triple junctions of the grain and/or subgrain boundary network) in the surface graphene layer. It is also expedient to note that in Figure 20(b), one can imagine some grain boundary network decorated by the etch-pits.
The average blister has a radius of ~25 nm and a height ~4 nm. Approximating the nanoblister to be a semi-ellipse form, results in the blister area 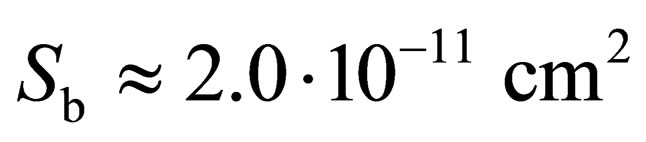 and its volume
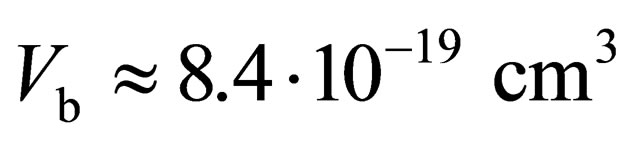 . The amount of retained hydrogen in this sample becomes Q » 2.8∙1014 H2/cm2 and the number of hydrogen molecules captured inside the blister becomes
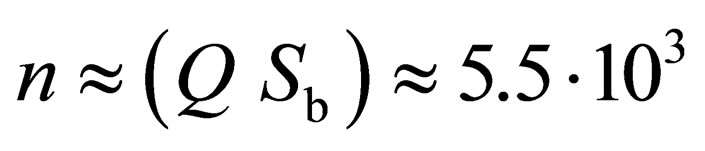 . Thus, within the ideal gas approximation, and accuracy of one order of the magnitude, the internal pressure of molecular hydrogen in a single nanoblister at near-room temperature (T » 300 K) becomes
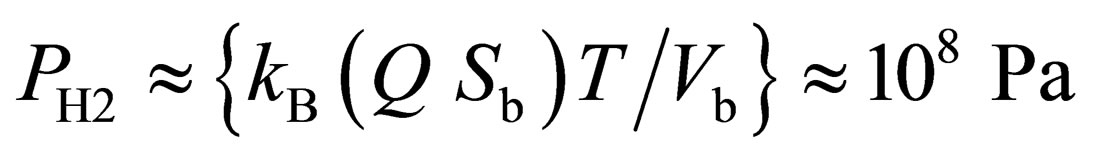 . The hydrogen molecular gas density in the blisters (at T » 300 K and PH2 » 1∙108 Pa) can be estimated as
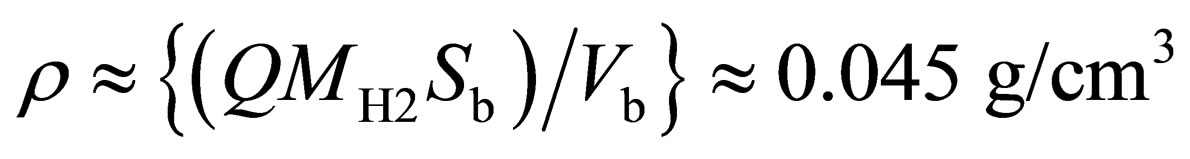 where MH2 is the hydrogen molecule mass. It agrees with
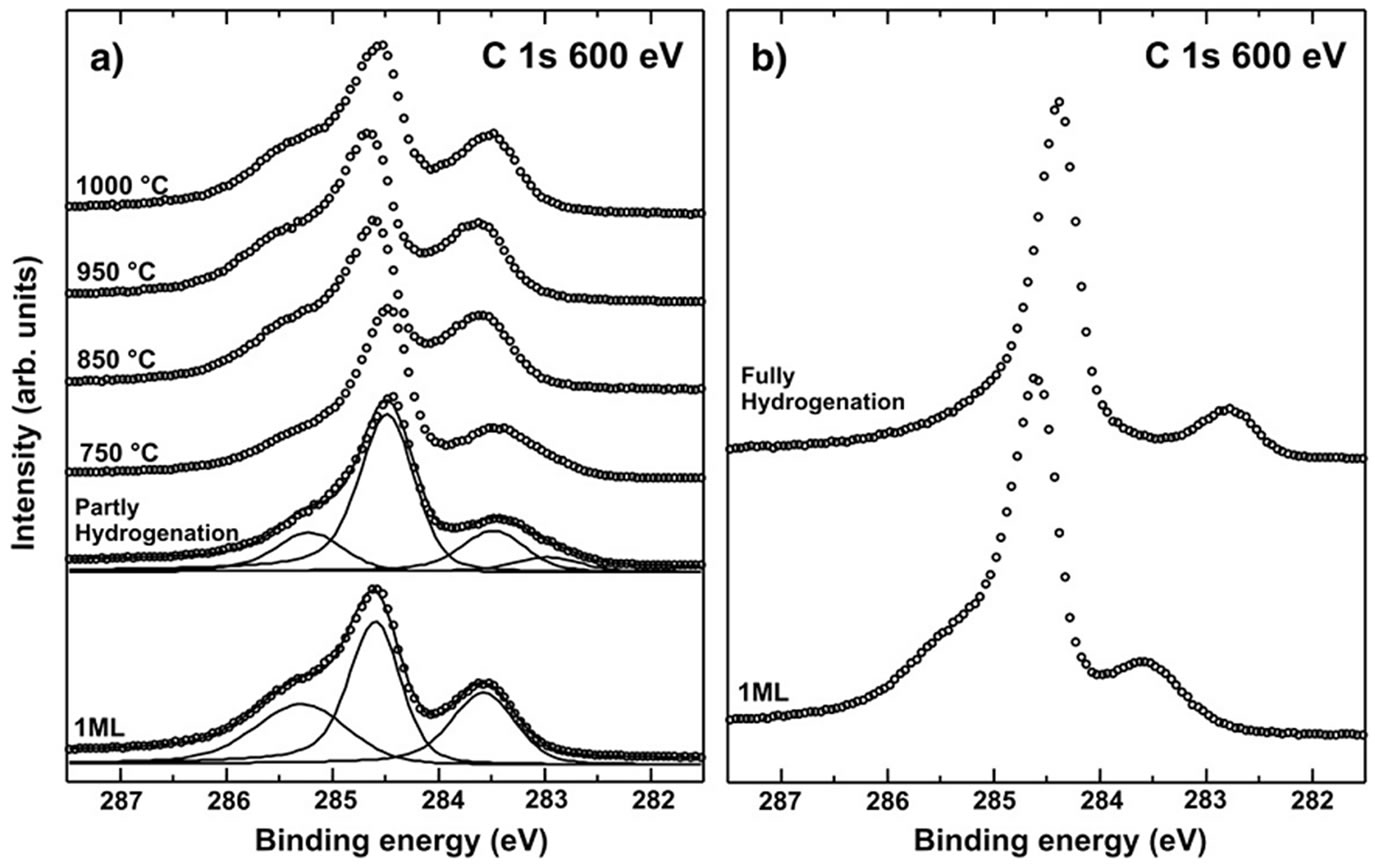
Figure 17. Normalized C 1 s core level spectra of monolayer graphene [17] before and after hydrogenation and subsequent annealing at 1023, 1123, 1223, and 1273 K. (b) Fully hydrogenated graphene along with monolayer graphene before hydrogenation. The spectra were acquired at a photon energy of 600 eV.

Figure 18. Normolized Si 2p core level spectra of monolayer grapheme [17] before and after hydrogenation and subsequent annealing at 1023, 1123, 1223, and 1273 K. The spectra were acquired at a photon energy of 140 eV.
data [60] considered in [18-21], on the hydrogen (protium) isotherm of 300 K. These results can be quantitatively described, with an accuracy of one order of magnitude, with the thermodynamic approach [44,46], by using the condition of the thermo-elastic equilibrium for the reaction of ( ), as follows [18]:
 (15)
(15)
where  is related to the blister “wall” back pressure (caused by
 )—the so called surface pressure [44] −PH » 1∙10-4 Pa is the atomic hydrogen pressure corresponding to the atomic flux [15],
  is the standard pressure [44,46],
  is the experimental value [45] of the dissociation energy (enthalpy) of one molecule of gaseous hydrogen (at room temperatures),
  is the dissociation entropy [45],
  is the apparent volume change, rb » 30 nm is the radius of curvature of nanoblisters (at the nanoblister edge, Figure 21(b)), NA is the Avogadro number, and T ≈ 300 K. The quantity of (
 ) is related to the work of the nanoblister surface increasing with an intercalation of 1 molecule of H2.
The value of the tensile stresses  (caused by
 ) in the graphene nanoblister “walls” with a thickness of db and a radius of curvature rb can be evaluated from another condition (equation) of the thermo-elastic equilibrium of the system in question, which is related to Equation (15), as follows [44,18]:
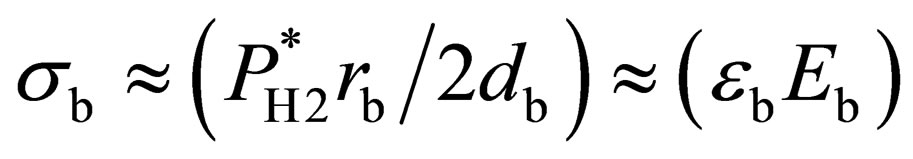 (16)
(16)
where  is a degree of elastic deformation of the graphene nanoblister walls, and Eb is the Young’s modulus of the graphene nanoblister walls. By substituting the first part of Equation (16), the quantities of
 , rb » 30 nm and db » 0.15 nm result in the value of
![]() .
.
The degree of elastic deformation of the graphene nanoblister walls, apparently reaches  (Figure 21(b)). Hence, with Hooke’s law of approximation,
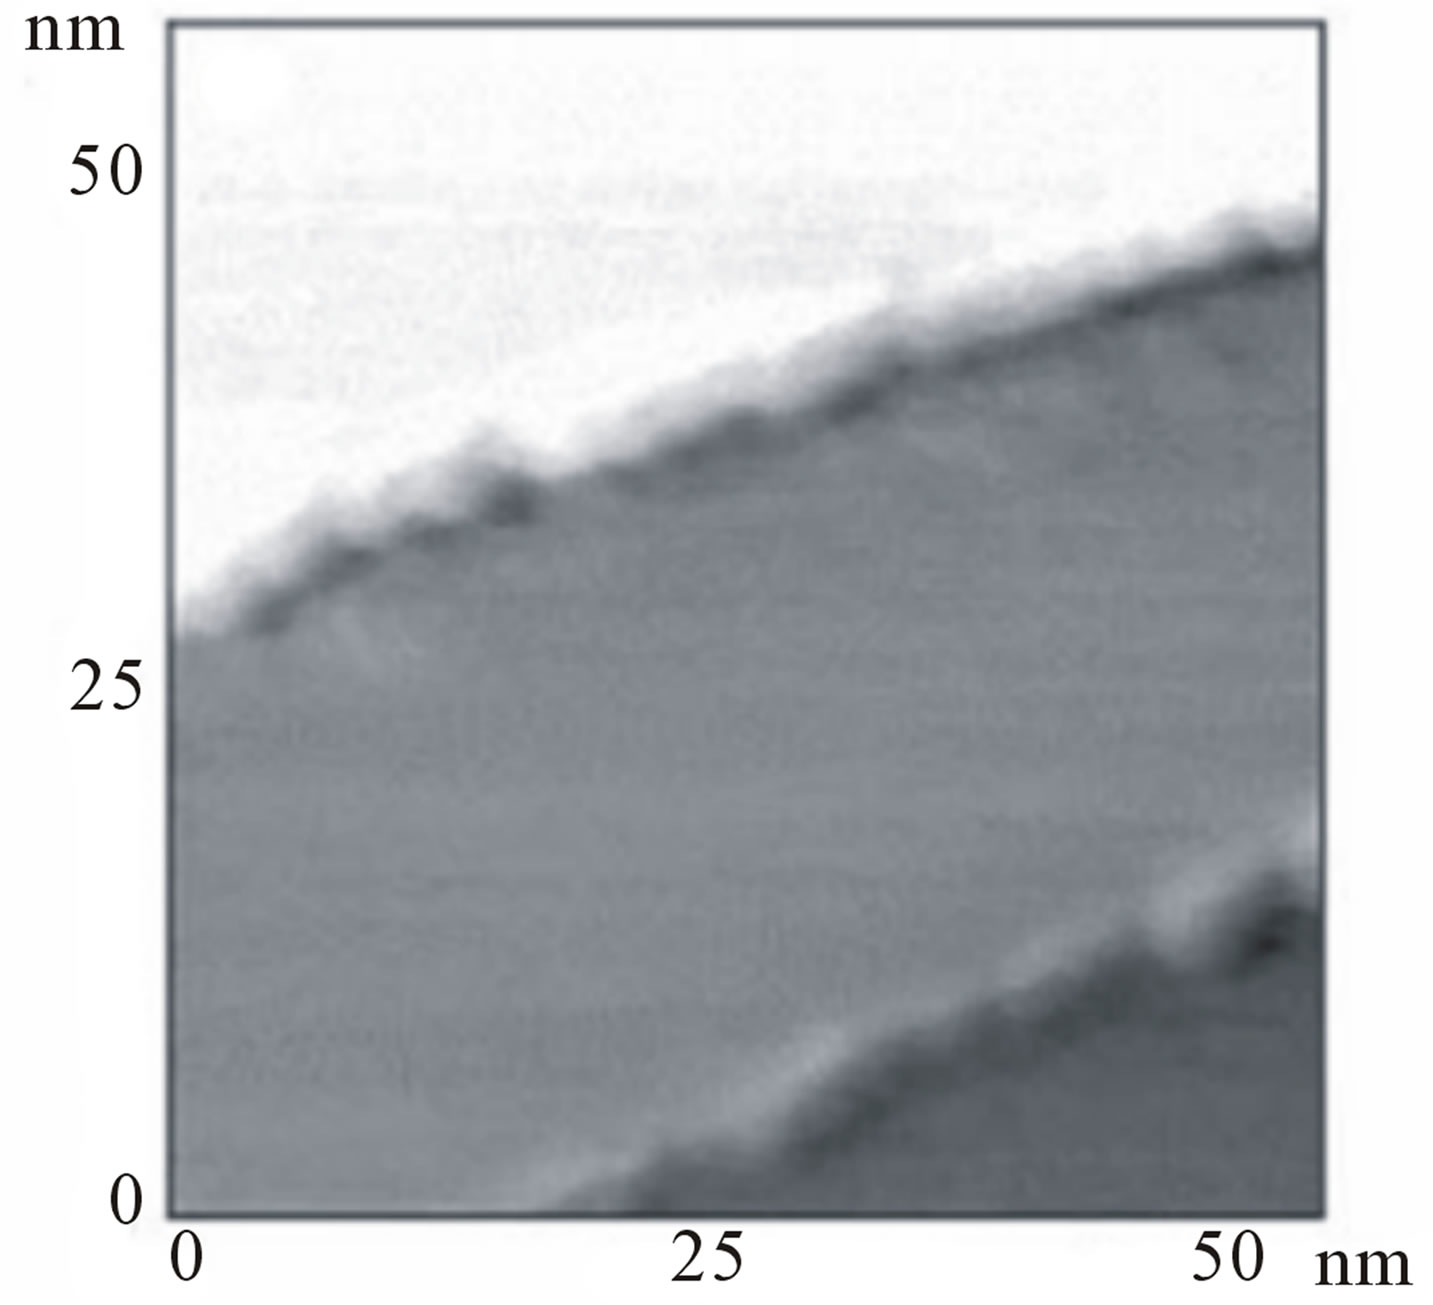 (a)
(a)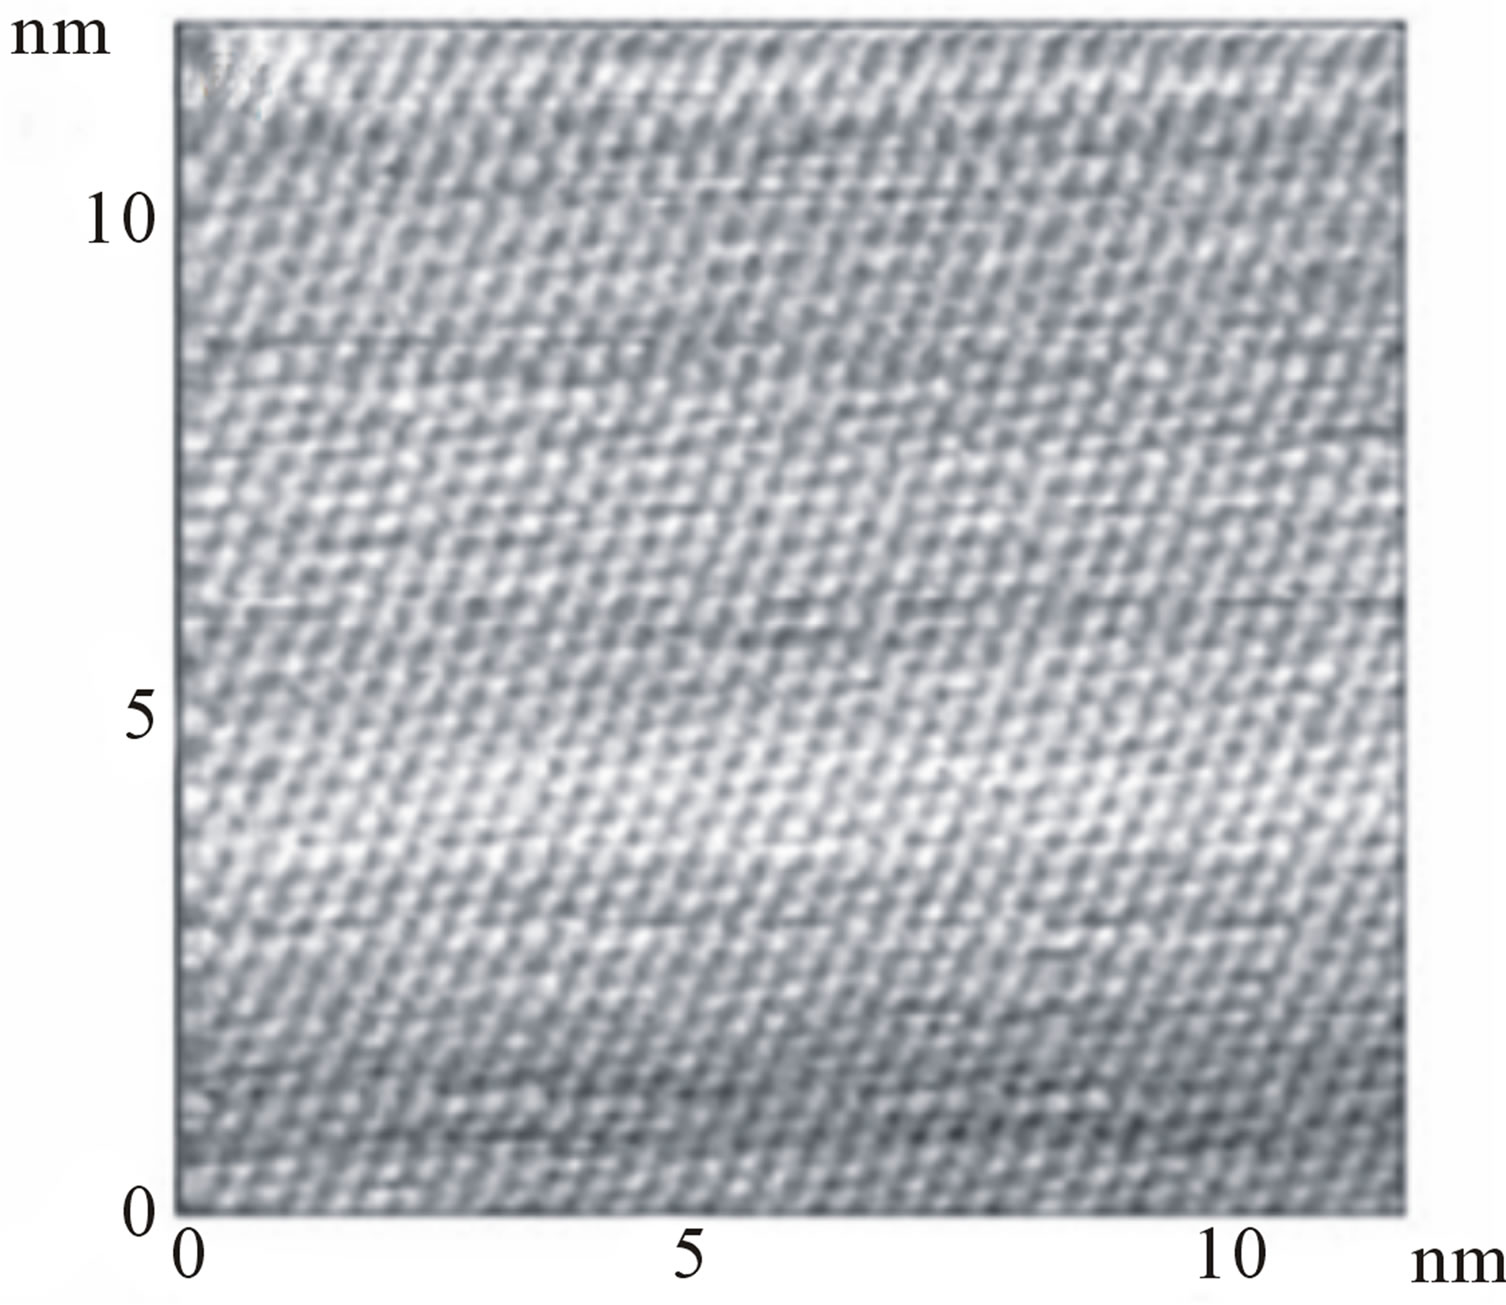 (b)
(b)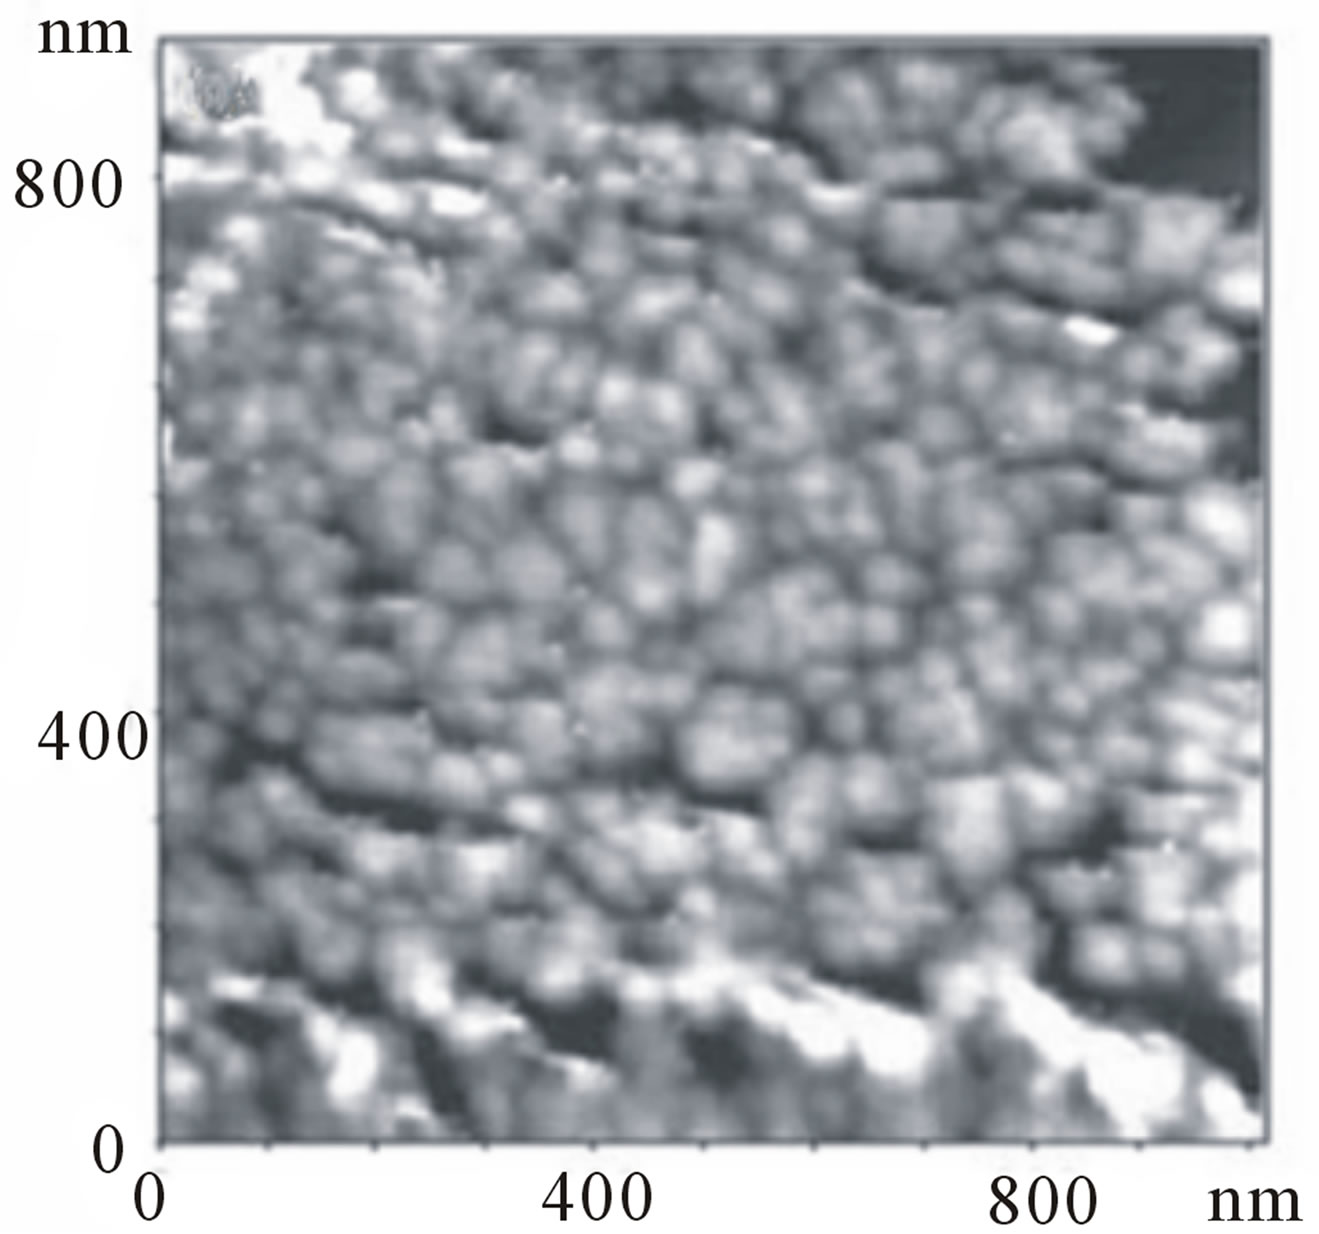 (c)
(c)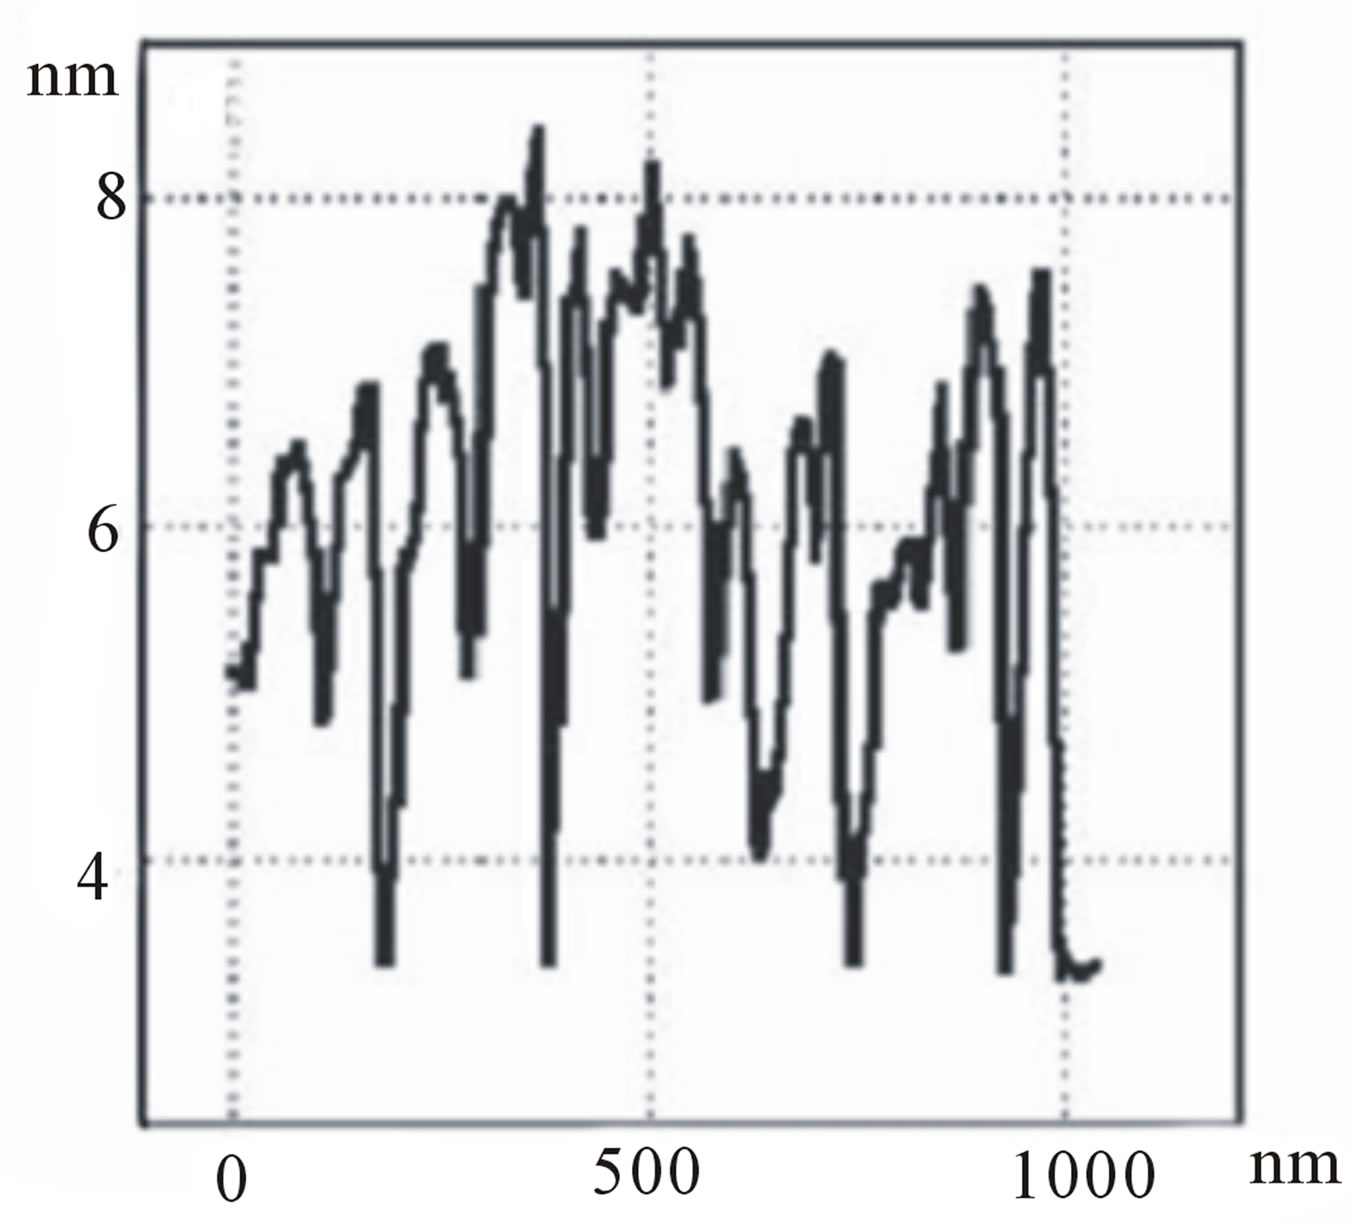 (d)
(d)
Figure 19. STM images of the untreated HOPG sample [15] (under ambient conditions) taken from areas of (a) 60.8 × 60.8 nm and (b) 10.9 × 10.9 nm (high resolution image of the square in image (a)). (c) AFM image (area of 1 × 1 nm) of the HOPG sample subjected to atomic hydrogen dose (D) of 1.8∙1016 H0/cm2. (d) Surface height profile obtained from the AFM image reported in (c). The STM tunnel Vbias and current are 50 - 100 mV and 1 - 1.5 mA, respectively.
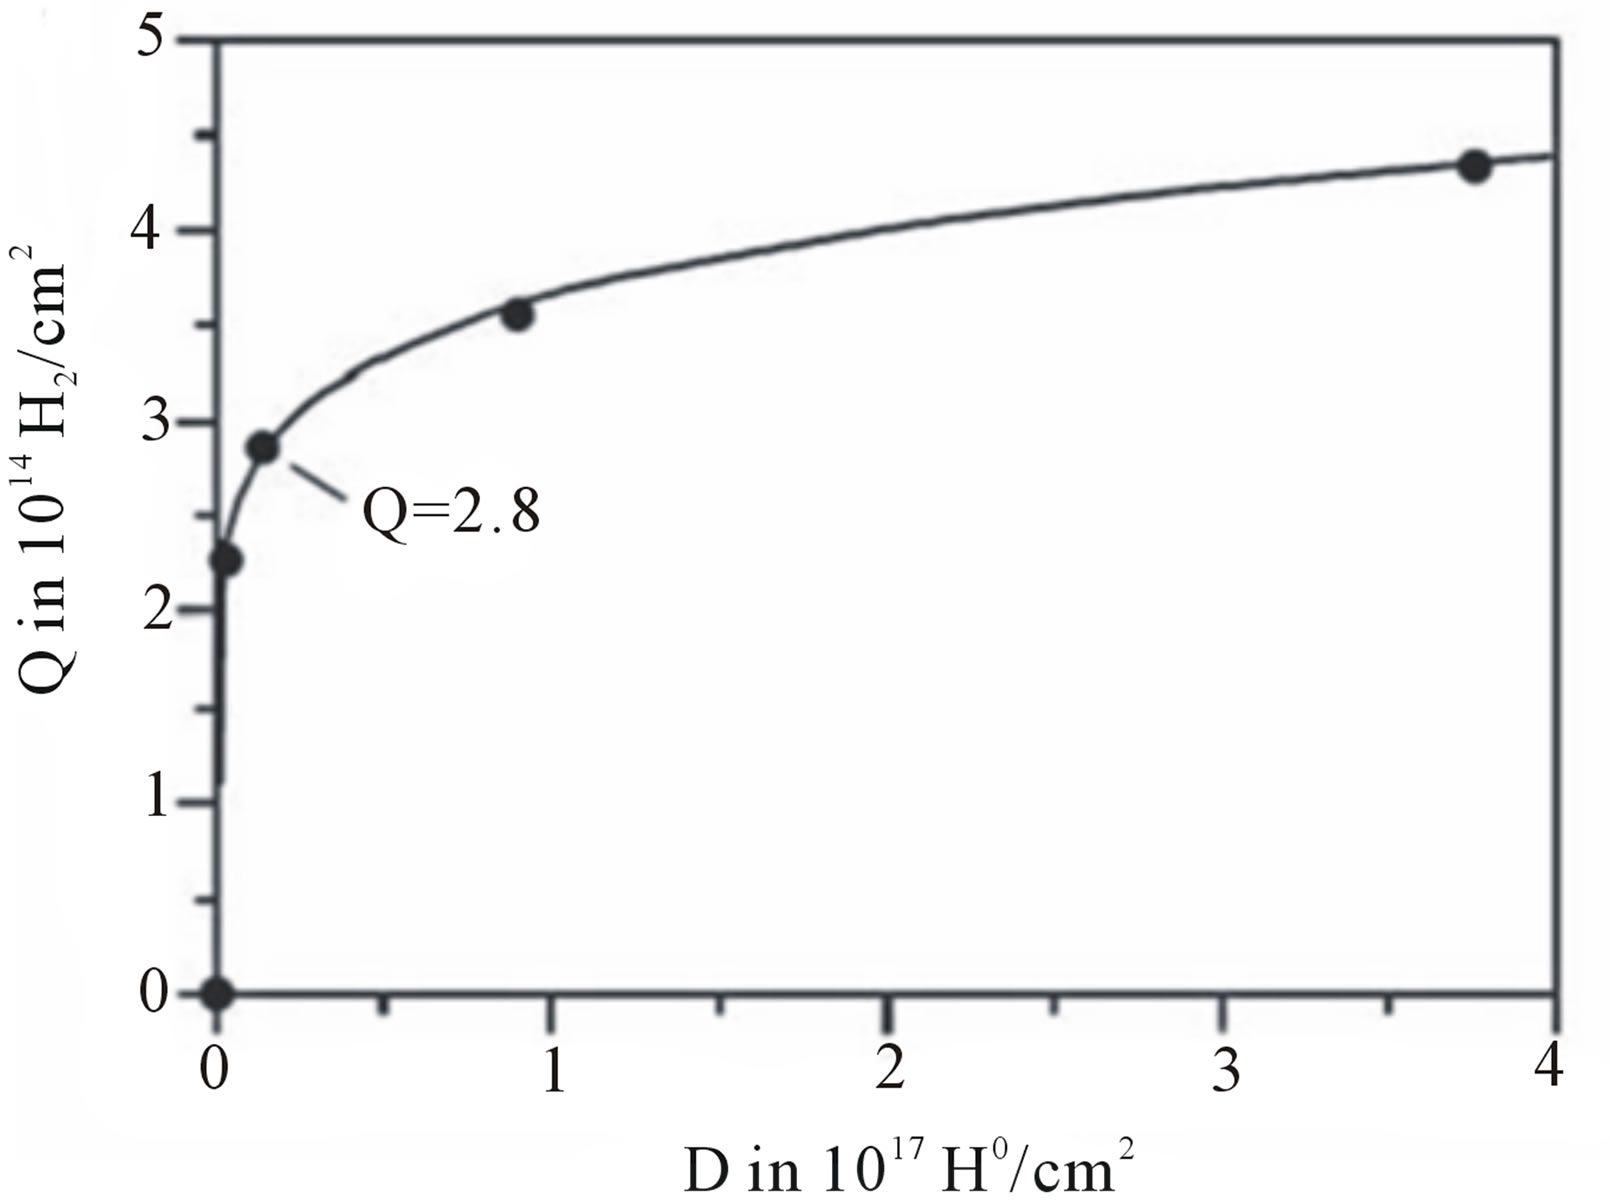 (a)
(a)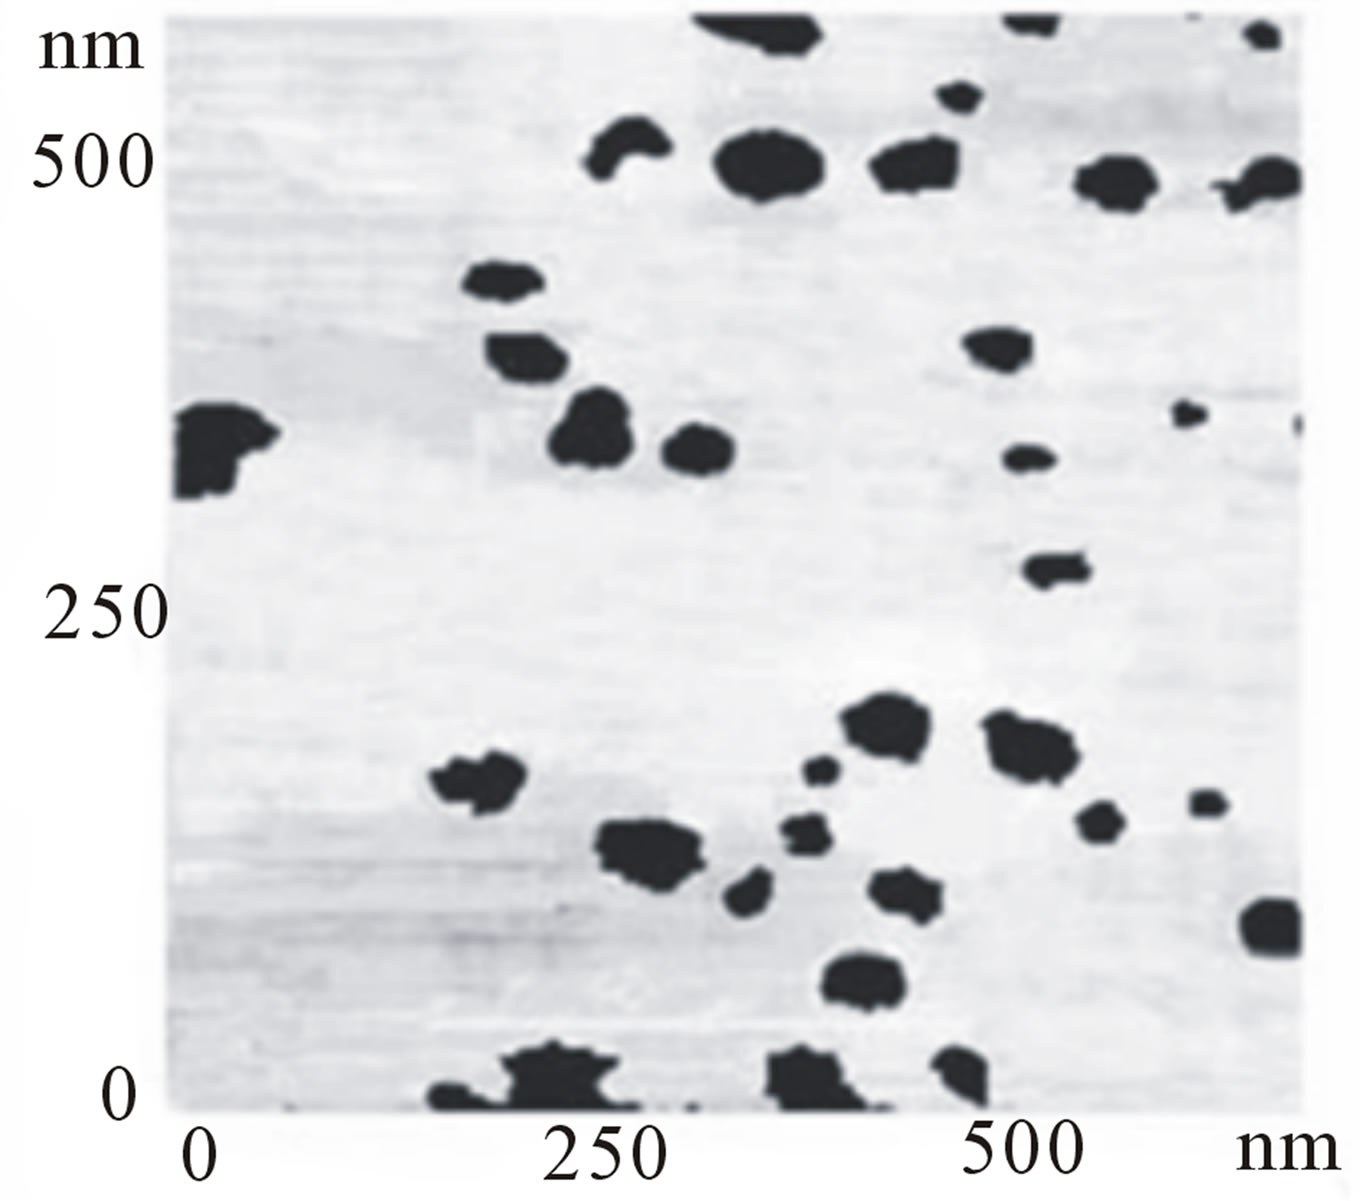 (b)
(b)
Figure 20. (a) Hydrogen storage efficiency of HOPG samples [15], desorbed molecular hydrogen (Q) versus dose (D) of atomic hydrogen exposure. (b) STM image for 600 × 600 nm area of the HOPG sample subjected to atomic hydrogen dose of 1.8∙1016 H0/cm2, followed by hydrogen thermal desorption.
using the second part of Equation (16), one can estimate, with the accuracy of one-two orders of the magnitude, the value of the Young’s modulus of the graphene nanoblister walls: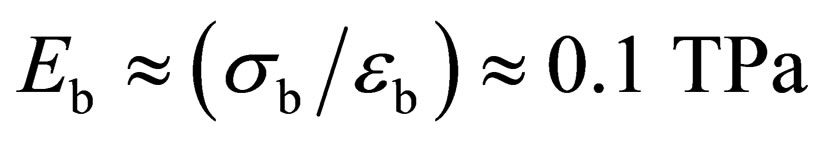 . It is close (within the errors) to the experimental value [48] of the Young’s modulus of graphene (Egraphene = 1.0 TPa).
The experimental data [15,59] on the thermal desorption of hydrogen from graphene nanoblisters in pyrolytic
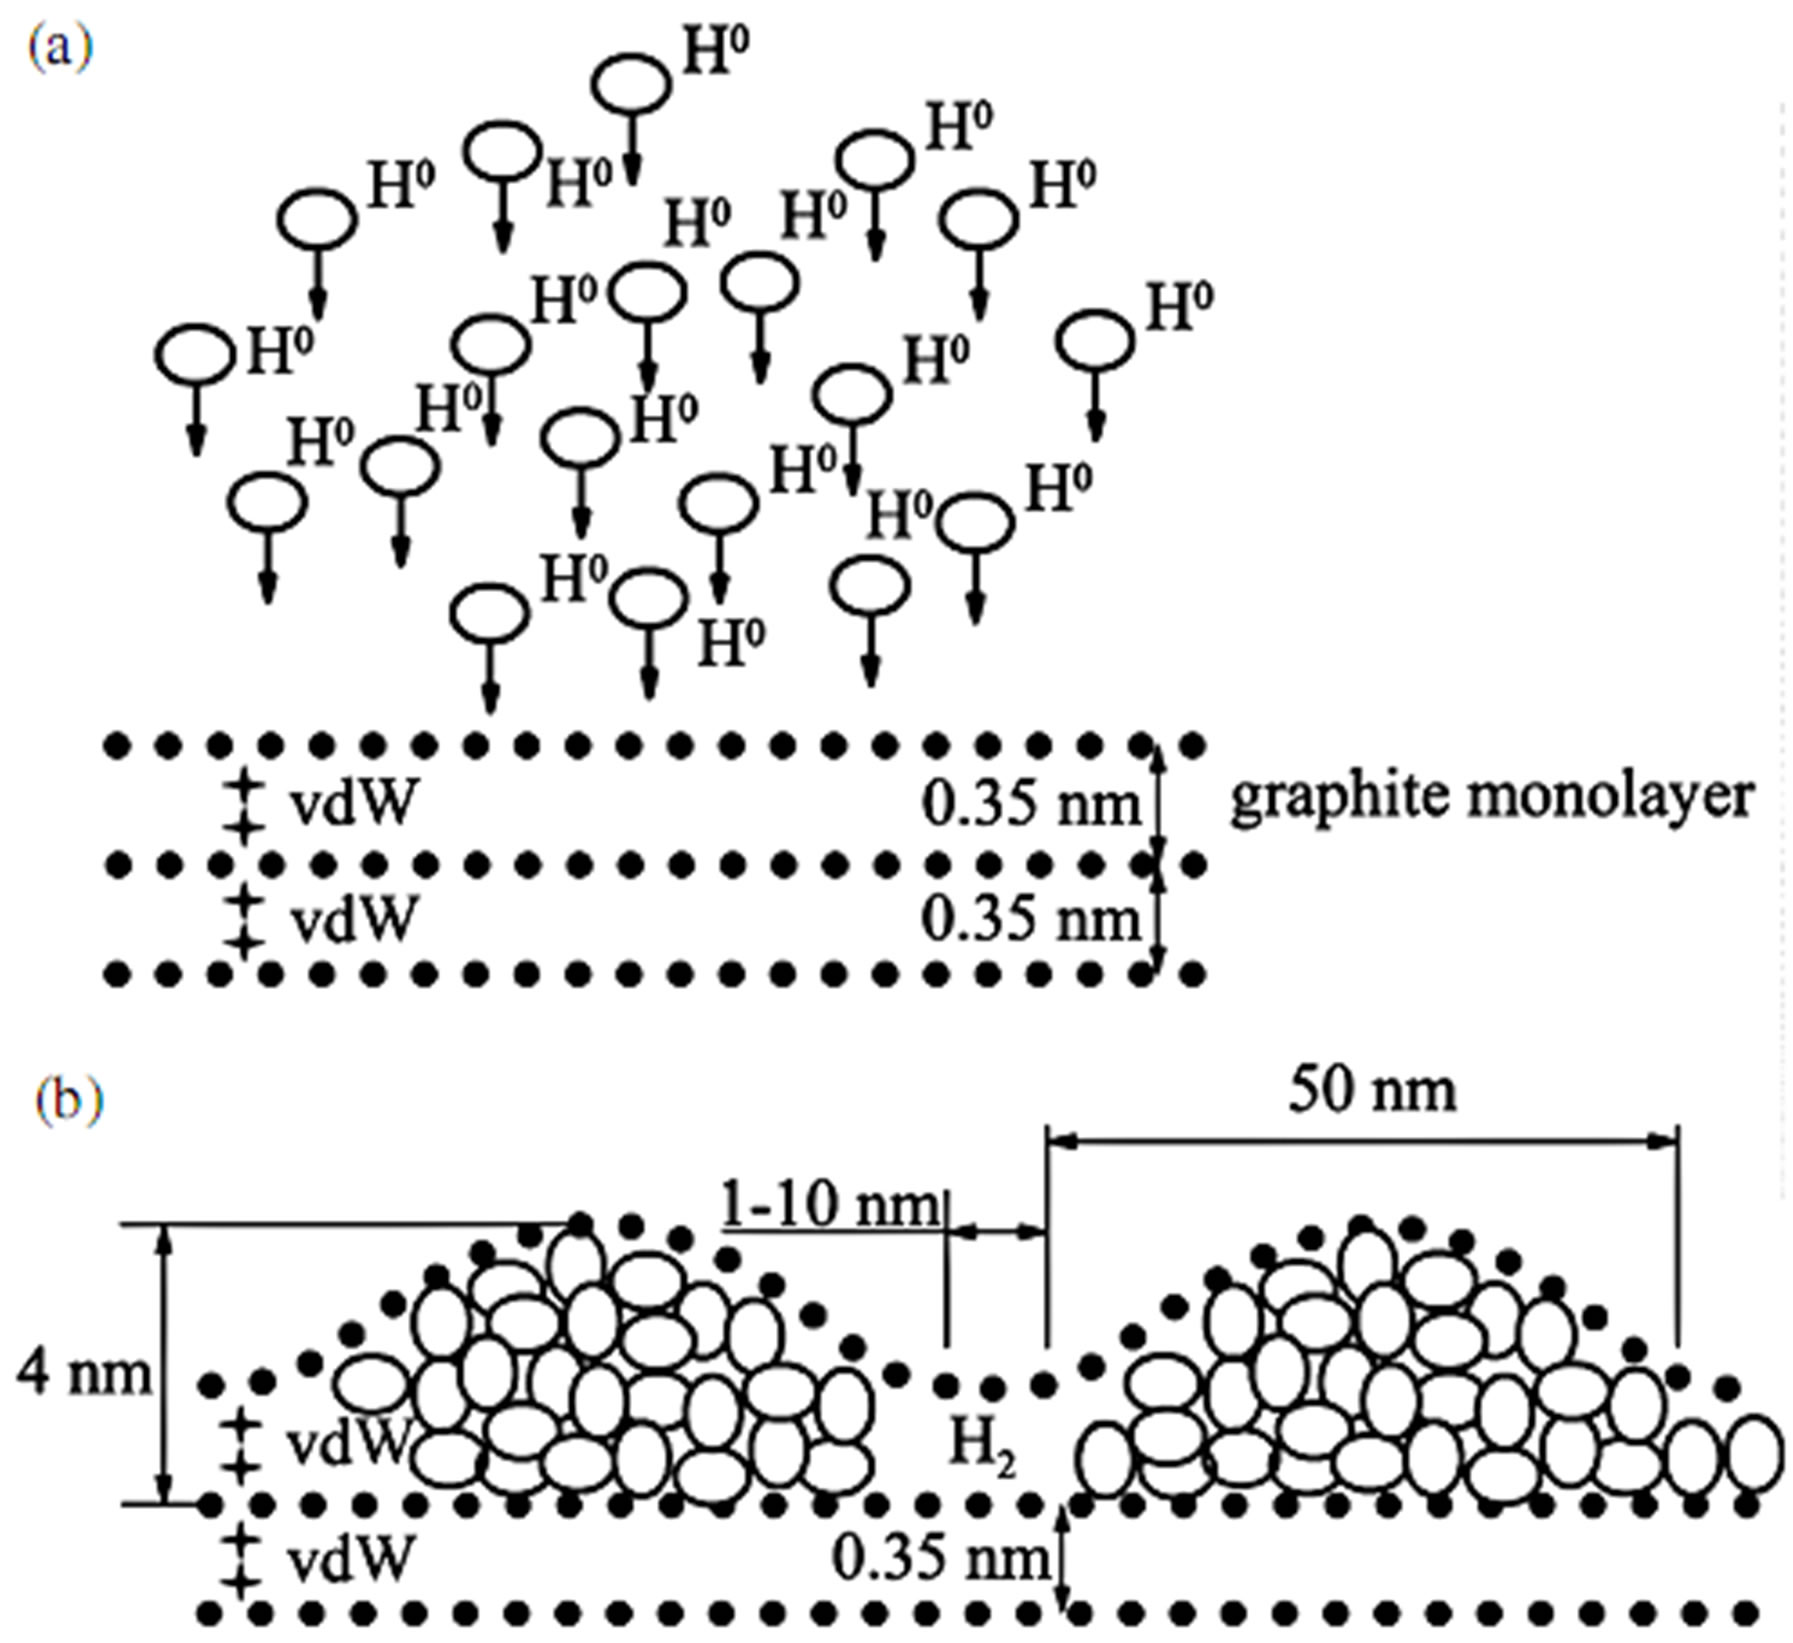
Figure 21. Model showing the hydrogen accumulation (intercalation) in HOPG, with forming blister-like nanostructures. (a) Pre-atomic hydrogen interaction step. (b) H2, captured inside graphene blisters, after the interaction step. Sizes are not drawn exactly in scale [15].
graphite can be approximated by three thermodesorption (TDS) peaks, i.e., # I with Tmax # I » 1123 K, # II with Tmax # II » 1523 K, and # III with Tmax # III » 1273 K. But their treatment, with using the above mentioned methods [14], is difficult due to some uncertainty relating to the zero level of the Jdes quantity. Nevertheless, TDS peak # I can be characterized by the activation desorption energy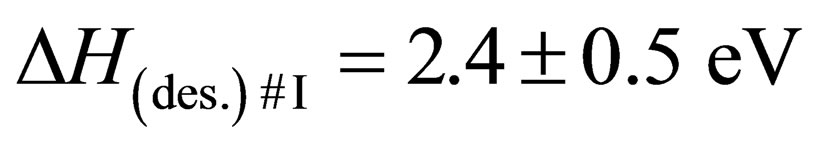 , and by the per-exponential factor of the reaction rate constant of
 ![]() (Table 3). Analyses have shown that TDS peak I is related to TDS peak (process) III in [14,18-21], for which the apparent diffusion activation energy is Qapp.III = (2.6 ± 0.3) eV and D0app.III » 3∙10−3 cm2/s.
(Table 3). Analyses have shown that TDS peak I is related to TDS peak (process) III in [14,18-21], for which the apparent diffusion activation energy is Qapp.III = (2.6 ± 0.3) eV and D0app.III » 3∙10−3 cm2/s.
Hence, one can obtain (with accuracy of one-two orders of the magnitude) a reasonable value of the diffusion characteristic size of
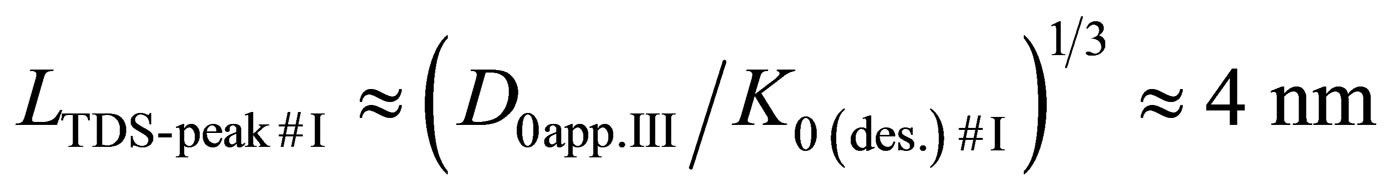 which is related to the separating distance between the grapheme nanoblisters (Figure 21(b)) or (within the errors) to the separation distance between etch-pits (Figure 20(b)) in the HOPG specimens [15,59]. Thus, TDS peak (process) I is related to TDS peak (process) III in [14, 18-21], which is related to model “F*” (Figure 4) considered in Item 2.4. Model “F*” is characterized by the quantity
 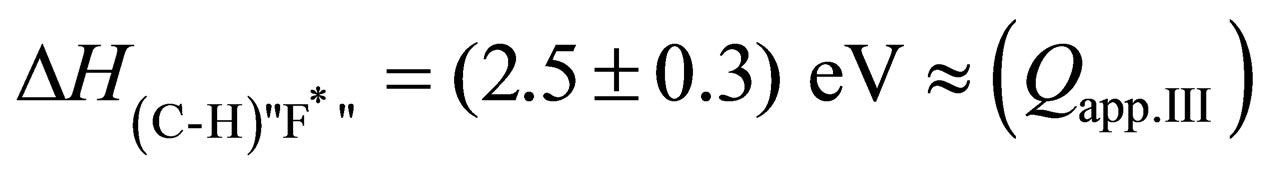 that coincides with the similar quantities for graphanes (Table 1) [14,18-21].
Finally, it is reasonable to assume that the inner surfaces “walls” in the graphene nanoblisters in HOPG are hydrogenated, and that the graphene “walls” situation is related to some hydrogenated graphenes (Table 1). Obviously, such hydrogenation of the inner graphene surfaces in the nanoblisters occurs under action of the gaseous molecular hydrogen of a high pressure  intercalated into the stressed (expanded) hydrogenated graphene nanoblister “walls” possessing of a high Young’s modulus [15,59].
As considered in the next Section, a similar (to some extent) situation may occur in hydrogenated graphite nanofibers (GNFs).
4. A Possibility of Intercalation of Solid H2 into Hydrogenated Graphite Nanofibers Relevant to the Hydrogen On-Board Storage Problem
The possibility of intercalation of solid H2 into hydrogenated graphite nanofibers (considered in [18-21]) is based on the following facts:
1) According to the data from Figures 22 and 23 (from [60]), a solid molecular hydrogen (or deuterium) of density of 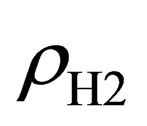 = 0.3 - 0.5 g/cm3 (H2) can exist at 300 K, and an external pressure of P = 30 - 50 GPa.
2) As seen from data in Figures 19-21 and Equations (15) and (16), the external surface pressure of P =  = 30 - 50 GPa at T » 300 K may be provided at the expense of the association energy of atomic hydrogen
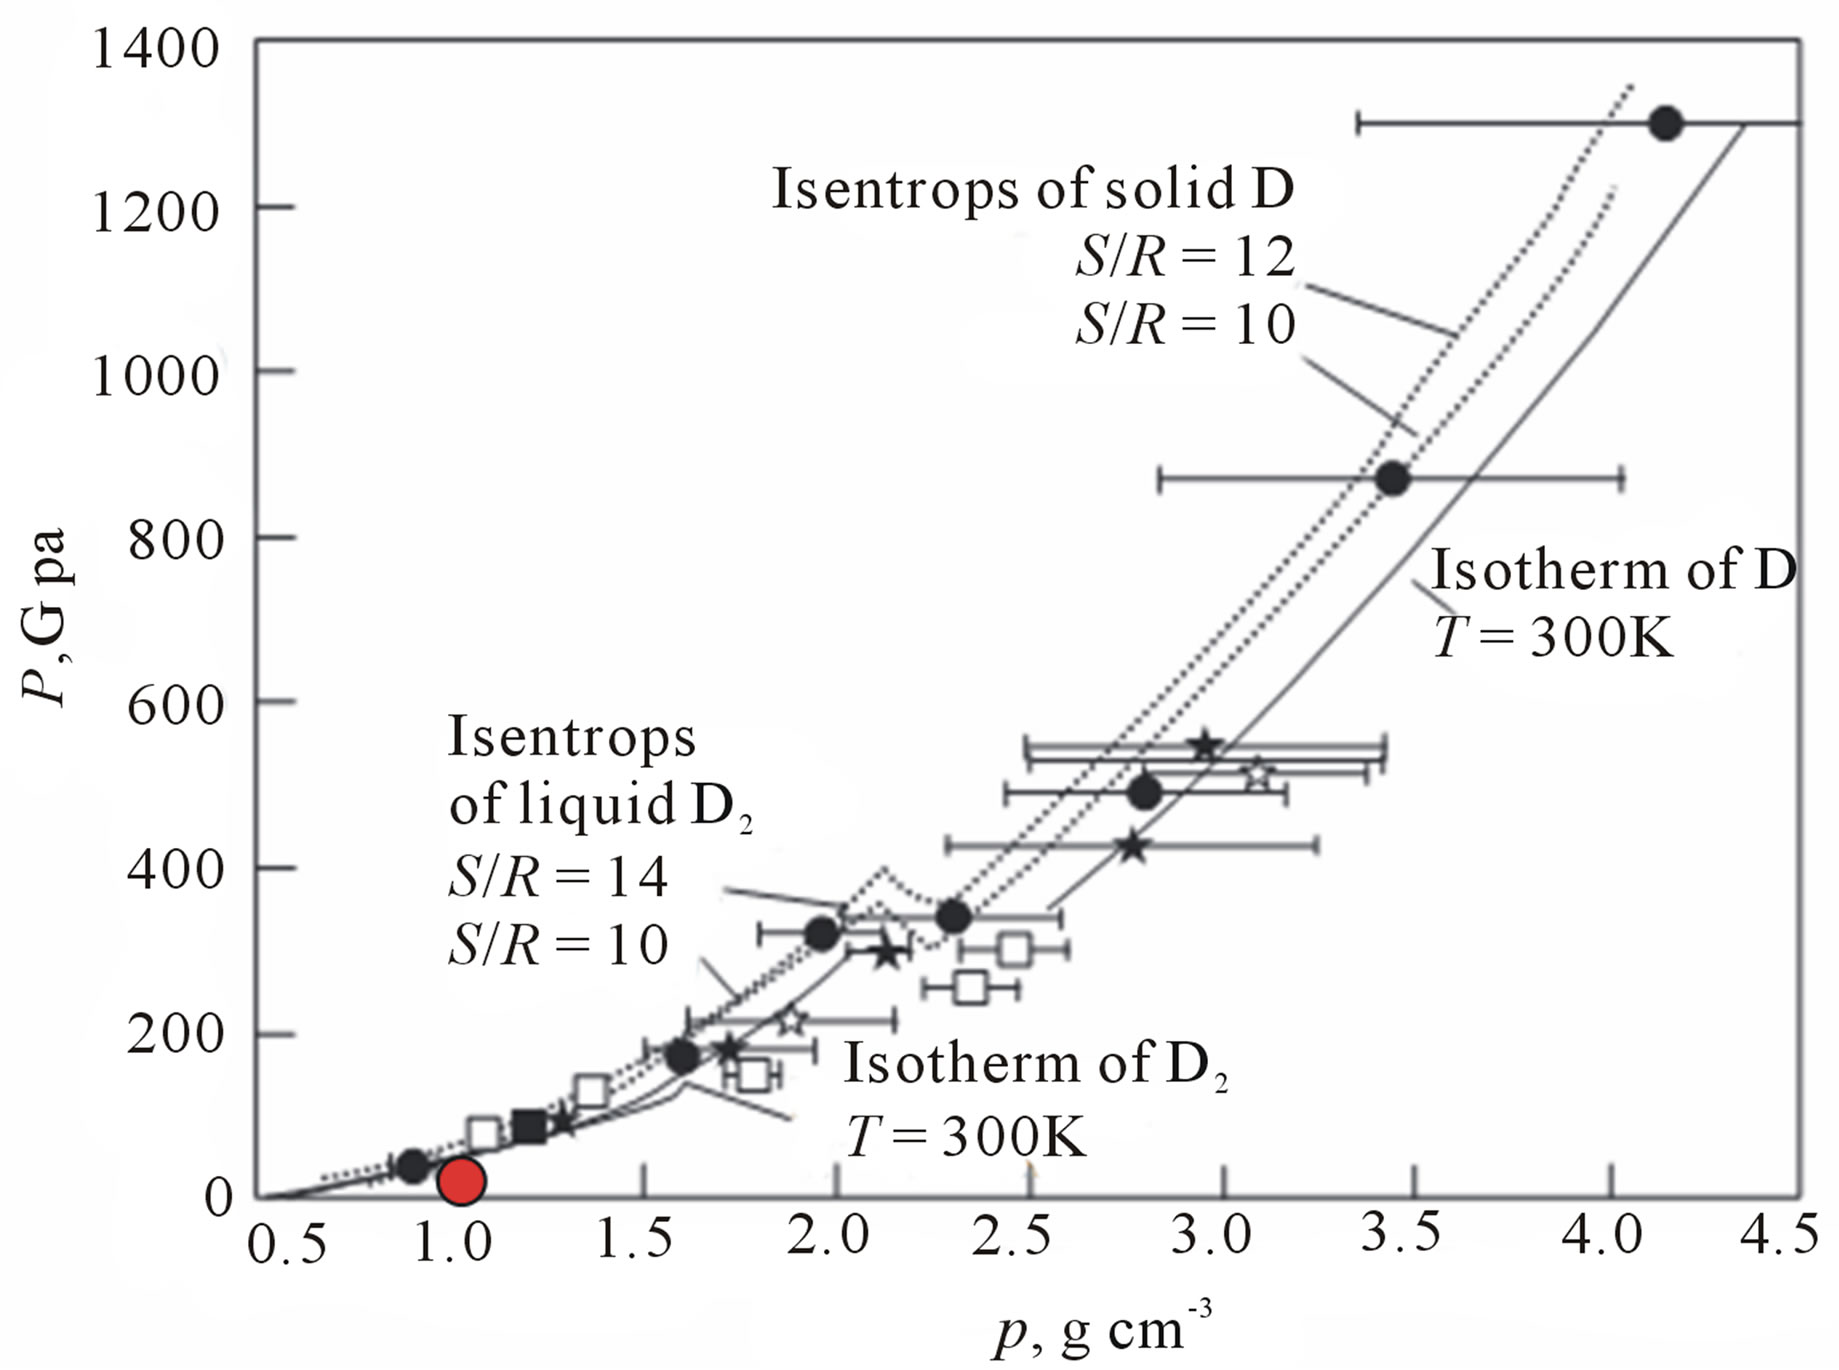
Figure 22. Isentropes (at entropies S/R = 10, 12 and 14, in units of the gas constant R) and isotherms (at T = 300 K) of molecular and atomic deuterium [60]. The symbols show the experimental data, and curves fit calculated dependences. The density (ρ) of protium was increased by a factor of two (for the scale reasons). Thickened portion of the curve is an experimental isotherm of solid form of molecular hydrogen (H2). The additional red circle corresponds to a value of the twinned density ρ » 1 g/cm3 of solid H2 (at T » 300 K) and a near-megabar value of the external compression pressure P » 50 GPa [18].
Figure 23. Phase diagram [60], adiabats, and isentropes of deuterium calculated with the equation of state: 1 and 2 are a single and a doubled adiabat, ●—the experimental data, 3—melting curve, thickened portion of the curve—the experimental data. The additional red circle corresponds to a value of temperature T » 300 K and a near-megabar value of the external compression pressure P » 50 GPa [18].
( ), into some closed hydrogenated (in gaseous atomic hydrogen with the corresponding pressure PH) graphene nanostructures possessing of a high Young’s modulus (Egraphene £ 1 TPa).
2) As shown in [18], the treatment of the data (Figure 24 from [61]) on hydrogenation of graphite nanofibers (GNFs) results in the experimental value of the hydrogen density

(or ![]() (H2-C-system)) of the intercalated high-purity reversible hydrogen (~17 mass. % H2) corresponding to the state of solid molecular hydrogen at a surface pressure of P =
(H2-C-system)) of the intercalated high-purity reversible hydrogen (~17 mass. % H2) corresponding to the state of solid molecular hydrogen at a surface pressure of P =  » 50 GPa and T » 300 K, according to data from Figures 22 and 23 [61, 62].
3) Substituting in Equation (16) the quantities of ![]() » 5×10¹⁰ Pa,
» 5×10¹⁰ Pa,  » 0.1 (Figure 24), the largest possible value of
  » 1012 Pa, the largest possible value of the tensile stresses (
 » 1011 Pa) in the edge graphene “walls” (of a thickness of db and a radius of curvature of rb) of the slit-like closed nanopores of the lens shape, one can obtain the quantity of
 . It is reasonable to assume
 ; hence, a reasonable value follows of db » 5 nm. A similar result can be obtained, supposing the quantity of
  » 1011 Pa (as it is for the hydrogenated grapheme nanoblisters in HOPG [15], Section 3.7).
4) As noted in [18-21], a definite residual plastic deformation of the hydrogenated graphite (graphene) nanoregions is observed in Figure 24. Such plastic deformation of the nanoregins during hydrogenation of GNFs, may be accompanied with some mass transfer resulting in such thickness ( ) of the walls.
5) A very important role of the spillover effect [63-69]
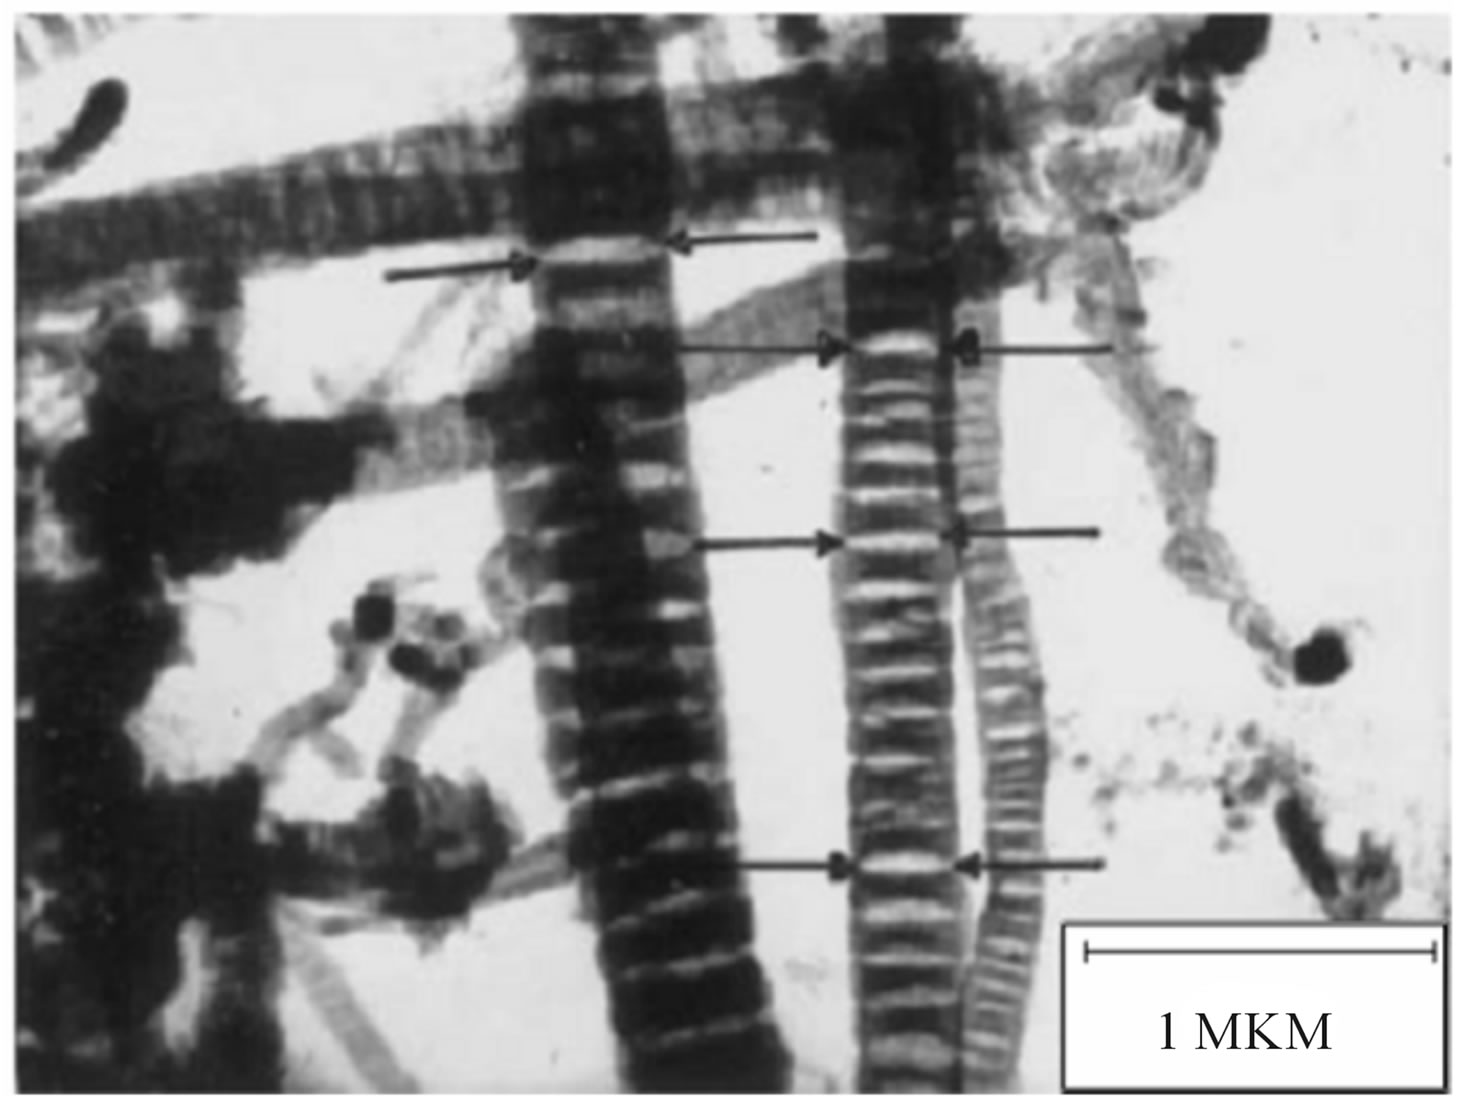
Figure 24. Micrographs of hydrogenated graphite nanofibers (GNFs) after release from them (at ~300 K for ~10 min [61,62]) of intercalated (obviously, reversible) high-purity hydrogen (~17 mass.%—the gravimetrical reversible hydrogen capacity [61]). The arrows in the picture indicate some of the slit-like closed nanopores of the lens shape (between hydrogenated graphite (graphene) nano-regions), where the intercalated reversible high-purity hydrogen was localized. Dehydrogenation of the hydrogenated graphite (graphene) nano-regions, relevance to the covalent bonded “non-reversible” hydrogen in them, occurs during thermodesorption annealing at elevated temperatures. Two TDS peaks (I, II) were observed [61,62]; peak I is related to TDS peak III in [14,18-21], (Table 3) [61].
is the relevance to hydrogenation of GNFs [18-21,61, 62].
5) The related data presented in [70-73], and Figure 25 allows us reasonably to assume a break-through character of results [18-21], relevant for solving of the current problem [74,75] of the hydrogen on-board storage.
5. Conclusions
1) Consideration of some of the most cited works [3-9, 17,25,51-59,62] and the least non-cited works [18-21,61] on the thermodynamic stability of a number of hydrogenated grapheme layers systems (Tables 1-3) has shown expediency of further related (mainly experimental) studies for the determination of a complete and compatible set of thermodynamic characteristics of such systems.
2) It confirms that the alternative viewpoint of the experimental graphane (a free-standing membrane) may have a more complex hydrogen bonding than the one suggested by theory [3], and that the epitaxial graphene may be a different material, rather than the theoretical graphane (Table 1) [3,5].
3) A thermodynamic probability of existence of hydrogenated graphenes-graphanes* [18-21] is in possessing of a very high binding (cohesive) energy, in comparison with the theoretical graphane [3] (Table 1).
4) It has been reasonably assumed (in the light of [70- 73] and Figure 25) a break-through character of analyticcal results [18-21] on the solid hydrogen intercalated in hydrogenated graphite nanofibers (Figure 24), relevant
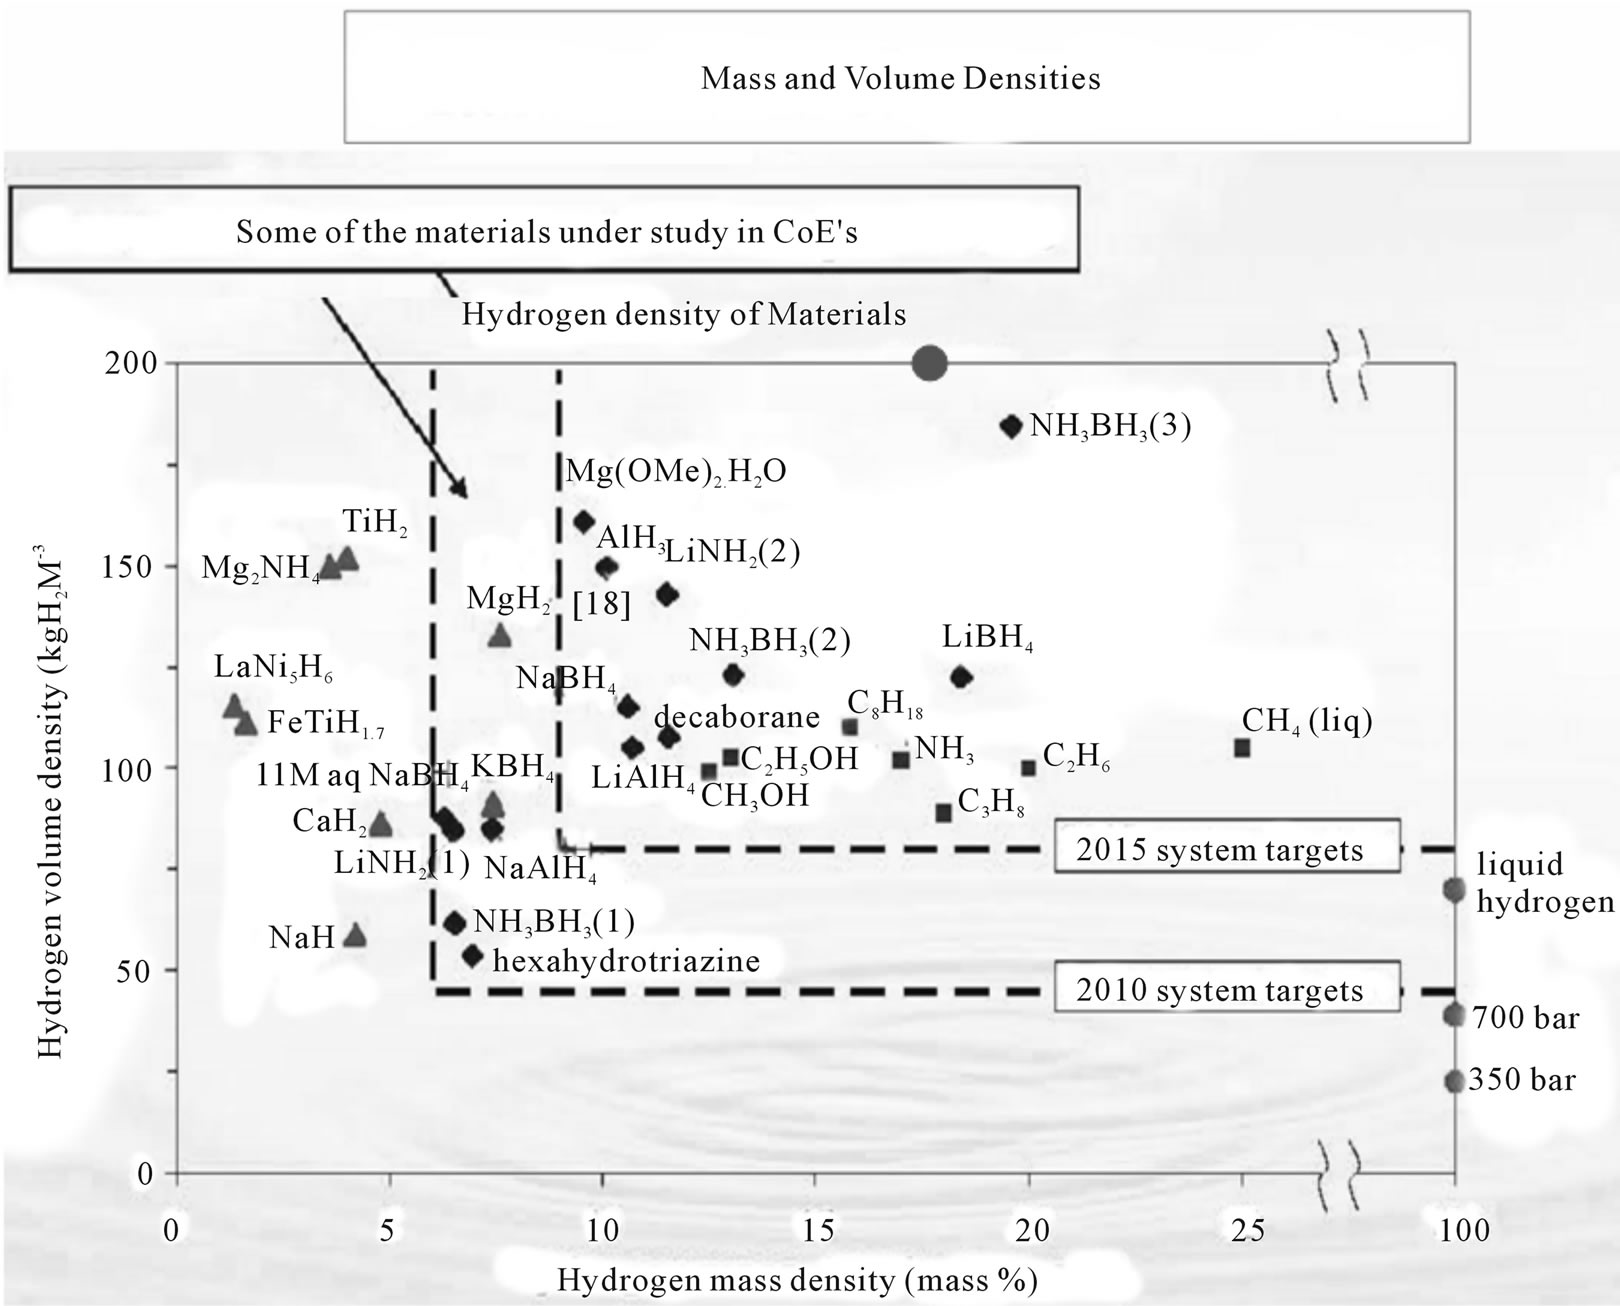
Figure 25. It is shown [71] (in the face of known achievements) U.S. DOE targets [74], relevant to gravimetric and volumetric hydrogen on-board storage densities for 2010 (6.0 mass.% H2, 45 kg(H2)/m3(system)) and for 2015 (9.0 mass.% H2, 81 kg(H2)/m3(systems)). The additional red circle is related to the solid hydrogen intercalated into the hydrogenated GNFs (Figure 24).
for solving the current problem [74,75] of hydrogen onboard storage.
5) A constructive open discussion on the considered thermodynamic aspects of the hydrogenated graphene layer systems seems expedient, relevant to the promotion of further developments.
6. Acknowledgments
The authors are grateful to H.G. Xiang, M.-H. Whangbo, D.C. Elias, C. Casiraghi, A. Eckmann, N. Tombros, B.J. Van Wees, A. Castellanos-Gomez, R. Bisson, T. Yu, L. Hornekaer and Z. Waqar for helpful discussions, and valuable completing and/or reading of the related parts of the paper.
REFERENCES
- A. K. Geim and K. S. Novoselov, “The Rise Of Graphene,” Nature Materials, Vol. 6, No. 3, 2007, pp. 183- 191.
- V. Palerno, “Not a Molecule, Not a Polymer, Not a Substrate…The Many Faces of Graphene as a Chemical Platform,” Chemical Communications, Vol. 49, No. 28, 2013, pp. 2848-2857.
- J. O. Sofo, A. S. Chaudhari and G. D. Barber, “Graphane: A Two-Dimensional Hydrocarbon,” Physical Review B, Vol. 75, No. 15, 2007, Article ID: 153401. doi:10.1103/PhysRevB.75.153401
- L. A. Openov and A. I. Podlivaev, “Thermal Desorption of Hydrogen from Graphane,” Technical Physics Letters, Vol. 36, No. 1, 2010, pp. 31-33. doi:10.1134/S1063785010010104
- D. C. Elias, R. R. Nair, T. M. G. Mohiuddin, S. V. Morozov, P. Blake, M. P. Halsall, A. C. Ferrari, D. W. Boukhvalov, M. I. Katsnelson, A. K. Geim and K. S. Novoselov, “Control of Graphene’s Properties by Reversible Hydrogenation: Evidence for Graphane,” Science, Vol. 323, No. 5914, 2009, pp. 610-626. doi:10.1126/science.1167130
- L. A. Openov and A. I. Podlivaev, “Thermal Stability of Single-Side Hydrogenated Graphene,” Technical Physics, Vol. 57, No. 11, 2012, pp. 1603-1605. doi:10.1134/S1063784212110175
- B. S. Pujari, S. Gusarov, M. Brett and A. Kovalenko, “Single-Side-Hydrogenated Graphene: Density Functional Theory Predictions,” Physical Review B, Vol. 84, No. 4, 2011, Article ID: 041402. doi:10.1103/PhysRevB.84.041402
- H. J. Xiang, E. J. Kan, S.-H. Wei, X. G. Gong and M.-H. Whangbo, “Thermodynamically Stable Single-Side Hydrogenated Grapheme,” Physical Review B, Vol. 82, No. 16, 2010, Article ID: 165425. doi:10.1103/PhysRevB.82.165425
- A. I. Podlivaev and L. A. Openov, “On Thermal Stability of Graphone,” Semiconductors, Vol. 45, No. 7, 2011, pp. 958-961. doi:10.1134/S1063782611070177
- A. Nikitin, X. Li, Z. Zhang, H. Ogasawara, H. Dai and A. Nilsson, “Hydrogen Storage in Carbon Nanotubes through the Formation of Stable C-H Bonds,” Nano Letters, Vol. 8, No. 1, 2008, pp. 162-167. doi:10.1021/nl072325k
- A. Nikitin, L.-A. Näslund, Z. Zhang and A. Nillson, “C-H Bond Formation at the Graphite Surface Studied with Core Level Spectroscopy,” Surface Science, Vol. 602, No. 14, 2008, pp. 2575-2580. doi:10.1016/j.susc.2008.06.012
- C. W. Bauschlicher Jr. and C. R. So, “High Coverages of Hydrogen on (10.0), (9.0) and (5.5) Carbon Nanotubes,” Nano Letters, Vol. 2, No. 4, 2002, pp. 337-341. doi:10.1021/nl020283o
- S. M. Pimenova, S. V. Melkhanova, V. P. Kolesov and A. S. Lobach, “The Enthalpy of Formation and C-H Bond Enthalpy Hydrofullerene C60H36,” The Journal of Physical Chemistry B, Vol. 106, No. 9, 2002, pp. 2127-2130. doi:10.1021/jp012258x
- Y. S. Nechaev, “Carbon Nanomaterials, Relevance to the Hydrogen Storage Problem,” Journal of Nano Research, Vol. 12, 2010, pp. 1-44. doi:10.4028/www.scientific.net/JNanoR.12.1
- Z. Waqar, “Hydrogen Accumulation in Graphite and Etching of Graphite on Hydrogen Desorption,” Journal of Materials Science, Vol. 42, No. 4, 2007, pp. 1169-1176. doi:10.1007/s10853-006-1453-1
- Y. S. Nechaev, O. K. Alexeeva and A. Oechsner, “Analytical Review on the Hydrogen Multilayer Intercalation in Carbonaceous Nanostructures: Relevance for Development of Super-Adsorbents for Fuel-Cell-Powered Vehicles,” Journal of Nanoscience and Nanotechnology, Vol. 9, No. 6, 2009, pp. 3949-3958. doi:10.1166/jnn.2009.NS95
- S. Watcharinyanon, C. Virojanadara, J. R. Osiecki, A. A. Zakharov, R. Yakimova, R. I. G. Uhrberg and L. I. Johansson, “Hydrogen Intercalation of Graphene Grown on 6H-SiC(0001),” Surface Science, Vol. 605, No. 17-18, 2011, pp. 1662-1668. doi:10.1016/j.susc.2010.12.018
- Y. S. Nechaev, “Solid Hydrogen in Multigraphane Nanostructures,” International Scientific Journal, Vol. 1, No. 1, 2012, pp. 38-60.
- Y. S. Nechaev, “On the Solid Hydrogen Intercalation in Multilayer Graphane-Like Nanostructures, Relevance to the Storage Applications,” Journal of Nano Research, Vol. 15, 2011, pp. 75-93. doi:10.4028/www.scientific.net/JNanoR.15.75
- Y. S. Nechaev, “On the Solid Hydrogen Carrier Intercalation in Graphane-Like Regions in Carbon-Based Nanostructures,” International Journal of Hydrogen Energy, Vol. 36, No. 15, 2011, pp. 9023-9031. doi:10.1016/j.ijhydene.2011.04.073
- Y. S. Nechaev, “The High-Density Hydrogen Carrier Intercalation in Graphane-Like Nanostructures, Relevance to Its On-Board Storage in Fuel-Cell-Powered Vehicles,” The Open Fuel Cell Journal, Vol. 4, 2011, pp. 16-29. doi:10.2174/1875932701104010016
- H. Xiang, E. Kan, S.-H. Wei, M.-H. Whangbo and J. Yang, “‘Narrow’ Graphene Nanoribbons Made Easier by Partial Hydrogenation,” Nano Letters, Vol. 9, No. 12, 2009, pp. 4025-4030. doi:10.1021/nl902198u
- S. Lebegue, M. Klintenberg, O. Eriksson and M. I. Katsnelson, “Accurate Electronic Band Gap of Pure and Functionalized Graphane from GW Calculations,” Physical Review B-Condensed Matter Material Physics, Vol. 79, No. 24, 2009, Article ID: 245117.
- J. Zhou, Q. Wang, Q. Sun, X. S. Chen, Y. Kawazoe and P. Jena, “Ferromagnetism in Semihydrogenated Graphene Sheet,” Nano Letters, Vol. 9, No. 11, 2009, pp. 3867- 3870. doi:10.1021/nl9020733
- A. A. Dzhurakhalov and F. M. Peeters, “Structure and Ener-getics of Hydrogen Chemisorbed on a Single Graphene Layer to Produce Graphane,” Carbon, Vol. 49, No. 10, 2011, pp. 3258-3266. doi:10.1016/j.carbon.2011.03.052
- P. Ruffieux, O. Gröning, M. Bielmann, P. Mauron, L. Schlapbach and P. Gröning, “Hydrogen Adsorption on sp2-Bonded Carbon: Influence of the Local Curvature,” Physical Review B, Vol. 66, No. 24, 2002, Article ID: 245416.
- X. Sha and B. Jackson, “First-Principles Study of the Structural and Energetic Properties of H Atoms on Graphite (0001) Surface,” Surface Science, Vol. 496, No. 3, 2002, pp. 318-330.
- M. H. F. Sluiter and Y. Kawazoe, “Cluster Expansion Method for Adsorption: Application to Hydrogen Chemisorption on Graphene,” Physical Review B, Vol. 68, No. , 2003, Article ID: 085410.
- O. V. Yazyev and L. Helm, “Defect-Induced Magnetism in Graphene,” Physical Review B, Vol. 75, No. 12, 2007, Article ID: 125408. doi:10.1103/PhysRevB.75.125408
- P. O. Lehtinen, A. S. Foster, Y. Ma, A. V. Krasheninnikov and R. M. Nieminen, “Irradiation-Induced Magnetism in Graphite: A Density Functional Study,” Physical Review Letters, Vol. 93, No. 18, 2004, Article ID: 187202. doi:10.1103/PhysRevLett.93.187202
- D. W. Boukhvalov, M. I. Katsnelson and A. I. Lichtenstein, “Hydrogen on Graphene: Total Energy, Structural Distortions and Magnetism from First-Principles Calculations,” Physical Review B, Vol. 77, No. 3, 2008, Article ID: 035427. doi:10.1103/PhysRevB.77.035427
- D. Jiang, V. R. Cooper and S. Dai, “Porous Graphene as the Ultimate Membrane for Gas Separation,” Nano Letters, Vol. 9, No. 12, 2009, pp. 4019-4024. doi:10.1021/nl9021946
- W. H. Brito, R. Kagimura and R. H. Miwa, “HydrogenAted Grain Boundaries in Graphene,” Applied Physics Letters, Vol. 98, No. 21, 2011, Article ID: 213107. doi:10.1063/1.3592578
- L. Tapasztó,
 P. Nemes-Incze, G. Dobrik, K. Jae-Yoo, C. Hwang and L. P. Biró, “Mapping the Electronic Properties of Individual Graphene Grain Boundaries,” Applied Physics Letters, Vol. 100, No. 5, 2012, Article ID: 053114. doi:10.1063/1.3681375
 - F. Banhart, J. Kotakoski andA. V. Krasheninnikov, “Structural Defects in Graphene,” ACS Nano, Vol. 5, No. 1, 2011, pp. 26-41. doi:10.1021/nn102598m
- O. V. Yazyev and S. G. Louie, “Topological Defects in Graphene: Dislocations And Grain Boundaries,” Physical Review B-Condensed Matter and Materials Physics, Vol. 81, No. 19, 2010, Article ID: 195420. doi:10.1103/PhysRevB.81.195420
- K. Kim, Z. Lee, W. Regan, C. Kisielowski, M. F. Crommie and A. Zettl, “Grain Boundary Mapping in Polycrystalline Graphene,” ACS Nano, Vol. 5, No. 3, 2011, pp. 2142-2146. doi:10.1021/nn1033423
- J. C. Koepke, J. D. Wood, D. Estrada, Z.-Y. Ong, K. T. He, E. Pop and J. W. Lyding, “Atomic-Scale Evidence for Potential Barriers and Strong Carrier Scattering at Graphene Grain Boundaries: A Scanning Tunneling Microscopy Study,” ACS Nano, Vol. 7, No. 1, 2013, pp. 75-86. doi:10.1021/nn302064p
- J. Zhang and J. Zhao, “Structures and Electronic Properties of Symmetric and Nonsymmetric Graphene Grain Boundaries,” Carbon, Vol. 55, 2013, pp. 151-159. doi:10.1016/j.carbon.2012.12.021
- B. I. Yakobson and F. Ding, “Observational Geology of Graphene, at the Nanoscale,” ACS Nano, Vol. 5, No. 3, 2011, pp. 1569-1574. doi:10.1021/nn200832y
- E. Cockayne, G. M. Rutter, N. P. Guisinger, J. N. Crain, P. N. First and J. A. Stroscio, “Grain Boundary Loops in Graphene,” Physical Review B-Condensed Matter and Materials Physics, Vol. 83, No. 19, 2011, Article ID: 195425.
- J. Zhang, J. Zhao and J. Lu, “Intrinsic Strength and Failure Behaviours of Graphene Grain Boundaries,” ACS Nano, Vol. 6, No. 3, 2012, pp. 2704-2711. doi:10.1021/nn3001356
- P. Sessi, J. R. Guest, M. Bode and N. P. Guisinger, “Patterning Graphene at the Nanometer Scale via Hydrogen Desorption,” Nano Letters, Vol. 9, No. 12, 2009, pp. 4343-4347. doi:10.1021/nl902605t
- I. P. Bazarov, “Thermodynamics,” Vysshaya Shkola, Moscow, 1976.
- M. K. Karapet’yants and M. L. Karapet’yants, “Osnovnye Termodinamicheskie Konstanty Neorganicheskikh i Organicheskikh Veshchestv,” (“Fundamental Thermodynamic Constants of Inorganic and Organic Substances”) Khimiya, Moscow, 1968.
- A. A. Zhukhovitskii and L. A. Shvartsman, “Physical Chemistry,” Metallurgiya, Moscow, 1987.
- L. Xie, X. Wang, J. Lu, Z. Ni, Z. Luo, H. Mao, R. Wang, Y. Wang, H. Huang, D. Qi, R. Liu, T. Yu, Z. Shen, T. Wu, H. Peng, B. Özyilmaz, K. Loh, A. T. S. Wee, Ariando and W. Chen, “Room Temperature Ferromagnetism in Partially Hydrogenated Epitaxial Graphene,” Applied Physics Letters, Vol. 98, No. 19, 2011, Article ID: 193113. doi:10.1063/1.3589970
- C. Lee, X. Wei, J. W. Kysar and J. Hone, “Measurement of the Elastic Properties and Intrinsic Strength of Monolayer Graphene,” Science, Vol. 321, No. 5887, 2008, pp. 385-388. doi:10.1126/science.1157996
- A. Eckmann, A. Felten, A. Mishchenko, L. Britnell, R. Krupke, K. S. Novoselov and C. Casiraghi, “Probing the Nature of Defects in Graphene by Raman Spectroscopy,” Nano Letters, Vol. 12, No. 8, 2012, pp. 3925- 3930. doi:10.1021/nl300901a
- F. H. Yang and R. T. Yang, “Ab Initio Molecular Orbital Study of Adsorption of Atomic Hydrogen on Graphite: Insight into Hydrogen Storage in Carbon Nanotubes,” Carbon, Vol. 40, No. 3, 2002, pp. 437-444. doi:10.1016/S0008-6223(01)00199-3
- M. Wojtaszek, N. Tombros, A. Garreta, P. H. M. Van Loosdrecht and B. J. Van Wees, “A Road to Hydrogenating Graphene by a Reactive Ion Etching Plasma,” Journal of Applied Physics, Vol. 110, No. 6, 2011, Article ID: 063715. doi:10.1063/1.3638696
- A. Castellanos-Gomez, M. Wojtaszek, Arramel, N. Tombros and B. J. Van Wees, “Reversible Hydrogenation and Bandgap Opening of Graphene and Graphite Surfaces Probed by Scanning Tunneling Spectroscopy,” Small, Vol. 8, No. 10, 2012, pp. 1607-1613. doi:10.1002/smll.201101908
- A. Castellanos-Gomez, Arramel, M. Wojtaszek, R. H. M. Smit, N. Tombros, N. Agraït, B. J. Van Wees and G. Rubio-Bollinger, “Electronic Inhomogeneities in Graphene: The Role of the Substrate Interaction and Chemical Doping,” Boletin Grupo Español Carbón, Vol. 25, No. 9 , 2012, pp. 18-22.
- A. Castellanos-Gomez, R. H. M. Smit, N. Agraït and G. Rubio-Bollinger, “Spatially Resolved Electronic Inhomogeneities of Graphene Due to Subsurface Charges,” Carbon, Vol. 50, No. 3, 2012, pp. 932-938. doi:10.1016/j.carbon.2011.09.055
- F. C. Bocquet, R. Bisson, J.-M. Themlin, J.-M. Layet and T. Angot, “Reversible Hydrogenation of Deuterium-Intercalated Quasi-Free-Standing Graphene on SiC(0001),” Physical Review B-Condensed Matter and Materials Physics, Vol. 85, No. 20, 2012, Article ID: 201401. doi:10.1103/PhysRevB.85.201401
- Z. Luo, T. Yu, K.-J. Kim, Z. Ni, Y. You, S. Lim, Z. Shen, S. Wang and J. Lin, “Thickness-Dependent Reversible Hydrogenation of Graphene Layers,” ACS Nano, Vol. 3, No. 7, 2009, pp. 1781-1788. doi:10.1021/nn900371t
- L. Hornekaer, Ž. Šljivančanin, W. Xu, R. Otero, E. Rauls, I. Stensgaard, E. Lægsgaard, B. Hammer and F. Besenbacher, “Metastable Structures and Recombination Pathways for Atomic Hydrogen on the Graphite (0001) Surface,” Physical Review Letters, Vol. 96, No. 15, 2006, Article ID: 156104. doi:10.1103/PhysRevLett.96.156104
- R. Balog, B. Jørgensen, J. Wells, E. Lægsgaard, P. Hofmann, F. Besenbacher and L. Hornekær, “Atomic HydroGen Adsorbate Structures on Graphene,” Journal of the American Chemical Society, Vol. 131, No. 25, 2009, pp. 8744-8745. doi:10.1021/ja902714h
- Z. Waqar, Z. Klusek, E. Denisov, T. Kompaniets, I. Makarenko, A. Titkov and A. Saleem, “Effect of Atomic Hydrogen Sorption and Desorption on Topography and Electronic Properties of Pyrolytic Graphite,” Electrochemical Society Proceedings, Vol. 16, No. 5, 2000, pp. 254- 265.
- [61] R. F. Trunin, V. D. Urlin and A. B. Medvedev, “Dynamic Compression of Hydrogen Isotopes at Megabar Pressures,” Physics-Uspekhi, Vol. 53, No. 6, 2010, pp. 605- 622. doi:10.3367/UFNe.0180.201006d.0605
- [62] B. K. Gupta, R. S. Tiwari and O. N. Srivastava, “Studies on Synthesis and Hydrogenation Behavior of Graphitic Nanofibers Prepared through Palladium Catalyst Assisted Thermal Cracking of Acetylene,” Journal of Alloys and Compounds, Vol. 381, No. 1-2, 2004, pp. 301-308. doi:10.1016/j.jallcom.2004.03.094
- [63] C. Park, P. E. Anderson, A. Chambers, C. D. Tan, R. Hidalgo and N. M. Rodriguez, “Further Studies of the Interaction of Hydrogen with Graphite Nanofibers,” The Journal of Physical Chemistry B, Vol. 103, No. 48, 1999, pp. 10572-10581. doi:10.1021/jp990500i
- [64] Y. Lin, F. Ding and B. I. Yakobson, “Hydrogen Storage by Spillver on Graphene as a Phase Nucleation Process,” Physical Review B-Condensed Matter and Materials Physics, Vol. 78, No. 4, 2008, Article ID: 041402.
- [65] A. K. Singh, M. A. Ribas and B. I. Yakobson, “H-Spillover through the Catalist Saturation: An Ab Initio Thermodynamics Study,” ACS Nano, Vol. 3, No. 7, 2009, pp. 1657-1662. doi:10.1021/nn9004044
- [66] L. Wang and R. T. Yang, “New Sorbents for Hydrogen Storage by Hydrohen Spillover—A Review,” Energy and Environmental Science, Vol. 1, 2008, pp. 268-279. doi:10.1039/b807957a
- [67] L. Wang and R. T. Yang, “Hydrogen Storage on CarbonBased Adsorbents and Storage at Ambient Temperature by Hydrogen Spllover,” Catalysis Reviews: Science and Engineering, Vol. 52, No. 4, 2010, pp. 411-461. doi:10.1080/01614940.2010.520265
- [68] Y. Gao, N. Zhao, J. Li, E. Liu, C. He and C. Shi, “Hydrogen Spillover Storage on Ca-Decorated Graphene,” International Journal of Hydrogen Energy, Vol. 37, No. 16, 2012, pp. 11835-11841. doi:10.1016/j.ijhydene.2012.05.029
- [69] L. Wang and R. T. Yang, “Molecular Hydrogen and Spiltover Hydrogen Storage on High Surface Area Carbon Sorbents,” Carbon, Vol. 50, No. 9, 2012, pp. 3134-3140. doi:10.1016/j.carbon.2011.09.049
- [70] S. S. Han, H. Jung, D. H. Jung, S.-H. Choi and N. Park, “Stability of Hydrogenation States of Graphene and Conditions for Hydrogen Spillover,” Physical Review B-Condensed Matter and Materials Physics, Vol. 85, No. 15, 2012, Article ID: 155408.
- [71] A. Zuettel, “Hydrogen—The Future Energy Carrier,” Materials of International Hydrogen Research Showcase 2011,” Birmingham, 13-15 April 2011, pp. 1-38. http://www.uk-shec.org.uk/uk-shec/showcase/ShowcasePresentations.html
- [72] D. Fruchart, “Large Scale Development of Metal Hydrides for Stationary and Nomad Hydrogen Storage Units. Which Are Potential Partners to Built Innovative Solutions for Sustainable and Clean Energy Systems?” Materials of International Hydrogen Research Showcase 2011, Birmingham, 13-15 April 2011, pp. 1-38. http://www.uk-shec.org.uk/uk-shec/showcase/ShowcasePresentations.html
- [73] E. Akiba, “Hydrogen Related R&D and Hydrogen Storage Materials in Japan,” Materials of International Hydrogen Research Showcase 2011, Birmingham, 13-15 April 2011, pp. 1-50. http://www.uk-shec.org.uk/uk-shec/showcase/ShowcasePresentations.html
- [74] J. W. Kim, “Current Status of R&D on Hydrogen Production and Storage in Korea,” Materials of International Hydrogen Research Showcase 2011,” Birmingham, 13-15 April 2011, pp. 1-45. http://www.uk-shec.org.uk/uk-shec/showcase/ShowcasePresentations.html.
- [75] S. Satyapal, J. Petrovic, C. Read, G. Thomas and G. Ordaz, “The U.S. Department of Energy’s National Hydrogen Storage Project: Progress towards Meeting Hydrogen-Powered Vehicle Requirements,” Catalysis Today, Vol. 120, No. 3-4, 2007, pp. 246-257. doi:10.1016/j.cattod.2006.09.022
- [76] DOE, “Targets for Onboard Hydrogen Storage Systems for Light-Duty Vehicles,” 2012. wwwl.eere.energy.gov/hydrogenandfuelcells/storage/pdfs/ targets_onboard_hydro_storage.pdf
NOTES
*Corresponding author.