Advances in Materials Physics and Chemistry
Vol.3 No.1A(2013), Article ID:30330,5 pages DOI:10.4236/ampc.2013.31A004
A Study of γ-Fe2O3 Nanoparticles Modified Using ZnCl2 during Synthesis*
School of Physical Science & Technology, Southwest University, Chongqing, China
Email: #aizhong@swu.edu.cn
Copyright © 2013 Longlong Chen, Jian Li. This is an open access article distributed under the Creative Commons Attribution License, which permits unrestricted use, distribution, and reproduction in any medium, provided the original work is properly cited.
Received January 11, 2013; revised February 26, 2013; accepted April 3, 2013
Keywords: Composite Nanoparticle; Spinel Structure; X-Ray Diffraction; Scherrer Equation
ABSTRACT
Surface modification of γ-Fe2O3 nanoparticles synthesized by a chemically induced transition has been attempted by adding ZnCl2 during synthesis. The structure of the modified particles was studied using X-ray diffraction (XRD) and transmission electron microscopy (TEM). The experimental results showed that ZnFe2O4 grew epitaxially on the γ- Fe2O3 crystallites to form composite nanoparticles with the spinel structure, on which FeCl3 might be adsorbed. The apparent grain size dc estimated by XRD using the Scherrer equation was larger rather than smaller than the average particle size ádñ measured by TEM. This paradox can be explained by the effect of absorption in the coating heterolayer.
1. Introduction
The interest in nanomaterials has grown because of their distinct optical, magnetic, electronic, mechanical, and chemical properties compared with those of the bulk materials. Magnetic nanoparticles with a size less than 100 nm represent an important class of artificial-nanostructure materials; they allow investigations of fundamental aspects of magnetic ordering phenomena and could lead to new technological applications [1]. Studies of magnetic nanoparticles have focused on the development of novel synthetic methods [2]. In previous work, we presented a method to prepare magnetic nanoparticles using a chemically induced transition, which involved treating a hydroxide precursor with an FeCl2 solution [3-5].
A nanocomposite is a material composed of two or more phases, one of which has a grain size of less than 100 nm. The resulting combination of different physical or chemical properties may give rise to completely new materials [6,7]. Magnetic nanocomposites have applications ranging from ferrofluids to separation science and technology [8]. Much research has shown that composite nanoparticles can be prepared by surface modification of particles, either during synthesis or in a postsynthesis step [9]. Such composite nanoparticles can be described in terms of a core-shell model [10].
X-ray diffraction (XRD) is a useful technique for characterizing the physicochemical makeup of unknown solids. For ferrite nanoparticles with the spinel structure, the average size dc of the grains in a sample can be estimated from the (311) peak using the Scherrer equation as
 (1)
(1)
where k is a constant (equal to 0.89), λ is the wavelength of the X-rays, θ is the Bragg diffraction angle of the (311) plane, and β is the full width at half-maximum (FWHM) of the (311) diffraction peak [11,12]. Generally, the average grain size given by XRD is less than the average size obtained from transmission electron microscopy (TEM), which is termed the physical size. However, oriented attachment may occur, in which a relatively large crystalline structure is formed by the attachment of crystalline primary particles [13], so that there may be some agglomeration of the nanoparticles in such a way that the particle size obtained from XRD is larger than the physical size obtained from TEM [12]. In the work presented here, γ-Fe2O3/ZnFe2O4 magnetic composite nanoparticles prepared by surface modification were studied, and a new explanation is proposed for the fact that the particle size estimated using XRD is larger than the physical size measured by TEM.
2. Experimental
Nanoparticles were synthesized by a method based on a chemically induced transition. The method involved two steps.
1) Preparation of the precursor. An aqueous solution of FeCl3 (40 mL, 1 M) and Mg(NO3)2 (10 mL, 2 M, in 0.05 M HCl) was added to an NaOH solution (500 mL, 0.7 M). The mixture was heated and then boiled for 5 min with stirring. The red-brown precursor precipitated gradually after the heating was stopped.
2) Synthesis of the nanoparticles.
a) Unmodified nanoparticles. The precursor was added to a FeCl2 solution (400 mL, 0.25 M), which was heated at boiling point for 30 min. After the heating was stopped, the product separated gradually from solution. It was then dehydrated by aceton and dried naturely to obtain γ-Fe2O3 nanoparticles [3], which we refer to as the unmodified sample.
b) Modified nanoparticles. During the above process of nanoparticle synthesis, after the FeCl2 solution with added precursor had been heated at boiling point for 20 min, ZnCl2 solution (50 mL, 2 M) was added to perform modification. The mixture was then boiled continuously for 10 min. Particles were precipitated after the heating was stopped. Finally, nanoparticles modified by the addition of ZnCl2 were obtained after dehydrating and drying; these are referred to as the modified sample.
To characterize the modified sample, the morphology of the particles was observed using TEM at 200 kV, and the crystal structure was analyzed using XRD with Cu Kα radiation. For comparison, the unmodified particles ware also characterized by XRD.
3. Results and Analysis
TEM observation indicated that the modified particles were nearly spherical nanoparticles, as shown in Figure 1. Statistical analysis showed that the sizes of the particles fitted a log-normal distribution; the median diameter dg and standard deviation ln σg were 10.47 nm and 0.27, respectively. For spherical particles with a log-normal size distribution, the average diameter ádñ, which is just so-called physical size measured by TEM, can be calculated from [14]
 . (2)
. (2)
The average diameter of the particles was given by this equation as 10.86 nm. The results of high-resolution TEM (HRTEM) revealed that the nanoparticles were highly crystalline, and in the aggregations of the nanoparticles, the particles exhibited different crystalline orientations, as shown in Figure 2.
XRD patterns of an unmodified and a modified sample are shown in Figure 3. It is evident that the unmodified
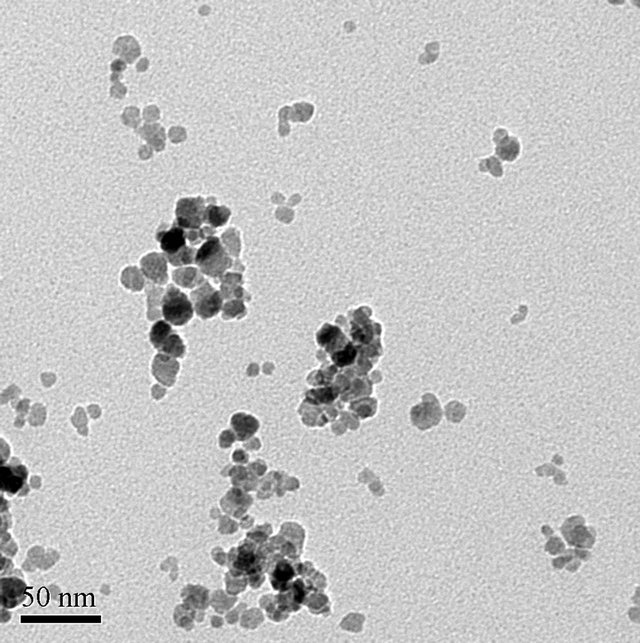
Figure 1. Typical TEM image of the modified sample.
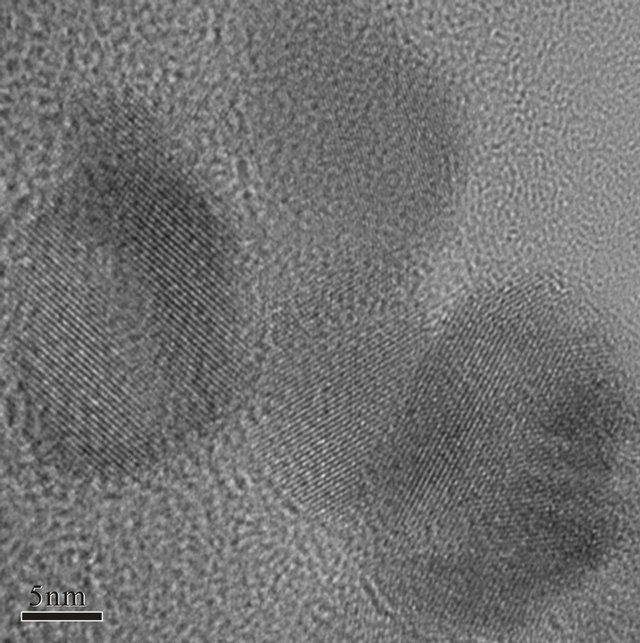
Figure 2. HRTEM image of an agglomeration in the modified sample.
particles have a ferrite-like spinel structure with the features of magnetite (PDF #39-1346), whose lattice constant is 0.8352 nm. For the modified sample, there were also clear diffraction peaks from the spinel structure, but there were no diffraction peaks corresponding to the (110) and (210) planes of γ-Fe2O3, and the peak for the (310) plane was weaker, although other peaks were stronger than in the unmodified sample. Therefore, we judged that in addition to γ-Fe2O3, there could be another phase with the spinel structure in the modified sample, for which the diffraction from the (110), (210), and (310) planes is apparently too weak to produce peaks in the XRD pattern. As a consequence, it can be inferred from the XRD results that the nanoparticles in the modified sample possess mainly the spinel structure. The diameter of the grains in the modified sample could be obtained from the
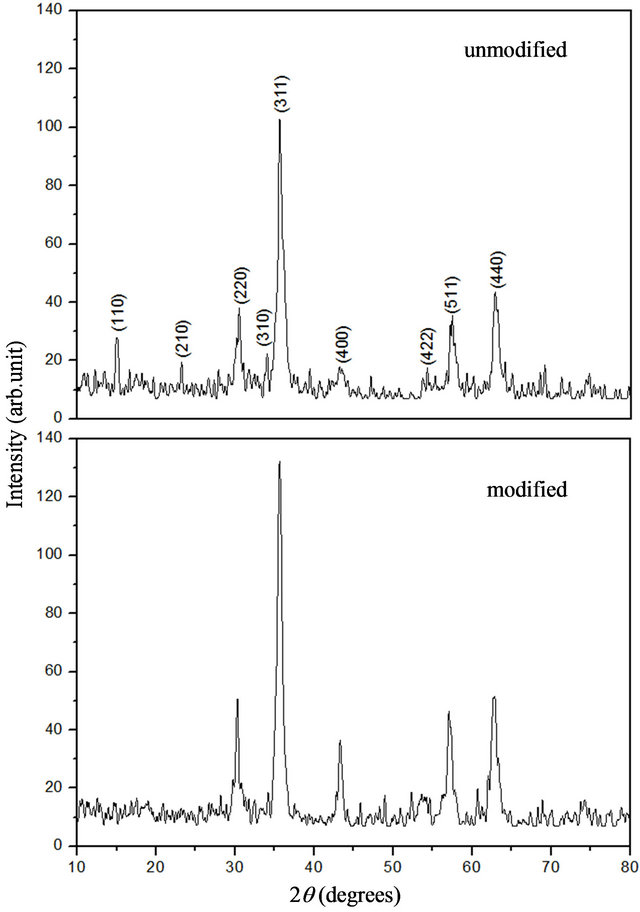
Figure 3. XRD patterns of unmodified and modified sample.
(311) peak using the Scherrer equation as dc = 13.43 nm.
4. Discussion
The XRD analysis indicates that the unmodified sample consisted of γ-Fe2O3 nanocrystallites, which could be coated with adsorbed FeCl3 [15]. During synthesis of the modified sample with ZnCl2 addition, we infer that γ- Fe2O3 crystallites were formed first. This is attributed to the precursor transforming in the FeCl2 solution, by the same process as in the formation of the unmodified nanoparticles. After ZnCl2 was added to the solution, another crystal layer with a spinel structure similar to the γ-Fe2O3 phase grew epitaxially on the γ-Fe2O3 crystallites. Unlike the unmodified sample, the modified sample did not show diffraction peaks from the (110) and (210) planes, and the peak from the (310) plane was weaker in the modified sample. So, it can be judged that the additional crystal layer is the ZnFe2O4 phase, for which diffraction lines from the (110), (210) and (310) planes are not present (PDF #22-1024), and the lattice constant is 0.8441 nm. The standard intensity data I(f) for both γ-Fe2O3 and ZnFe2O4 are listed in Table 1.
In addition, it was noticed that for the modified sample, the average size dc obtained by XRD analysis (=13.43 nm) is larger than the average size ádñ obtained from TEM (=10.47 nm). This is a similar result to that in [12], in which it was attributed to the oriented attachment of crystalline primary particles. However, the HRTEM results indicate that for the modified sample, the crystalline orientations of the nanoparticles in an agglomeration are different. Moreover, if instrumental broadening is taken into account [16], the apparent grain size becomes higher than the size dc given above. Instead, the paradox of the difference between dc and ádñ could be related to an absorption effect. We believe that the modified particles may be coated with adsorbed FeCl3. For particles coated with a different material, the X-rays diffracted by the interior can be absorbed by the coating layer, so that the diffraction peaks become weaker. For example, when α- Al2O3 nanoparticles were coated with La(OH)3, the diffraction peaks of the α-Al2O3 were very weak, and the main diffraction peaks agreed with an La(OH)3 phase [17]. This absorption effect could result in the FWHM β of the diffraction peak becoming less, so that the apparent dc of the spinel structure would become larger for γ-Fe2O3/ ZnFe2O4 nanoparticles coated with FeCl3. This can be explained as follows.
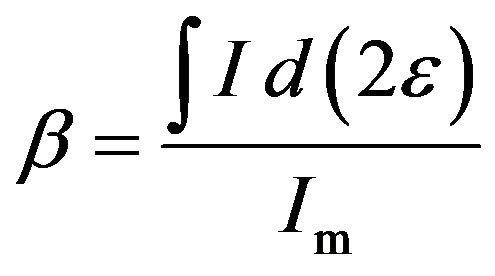
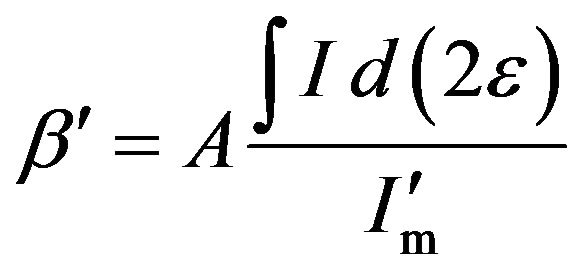
In practical applications, the FWHM β can be calculated as the ratio between the integrated intensity and the maximum intensity [18], i.e.
 (3)
(3)
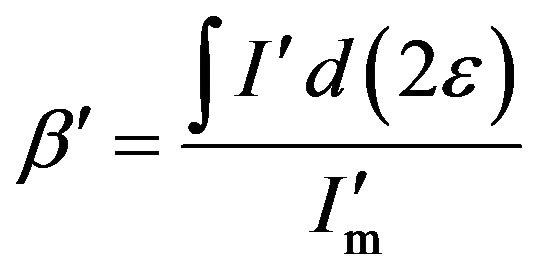
where I is the normal diffraction intensity, Im is the maximum of the intensity, and 2ε is the deviation of 2θ from the diffraction condition, as shown in Figure 4. This value of β is generally termed the integral width. When the diffraction from the grains is absorbed by a coating layer, the FWHM is written as
 (4)
(4)
where I' is the curve of the diffraction intensity and  is the maximum of the intensity with absorption effect from the coating layer. Generally, after the X-ray with intensity I0 passing through a matter of thick t, the intensity becomes It = I0e−μt, where μ is coefficient of linear absorption. Obviously, the longer the path of the X-ray going is, the weaker the It is. Thus, while absorption effect of the coating layer is considered, the curve of diffraction intensity can be described as
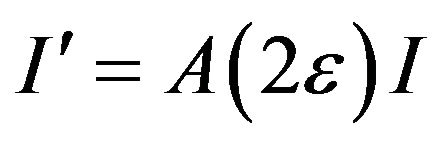 (5)
(5)
where I is the curve of diffraction intensity without the absorption effect and A(2ε) is absorbing factor in relation to 2ε. Since 2ε is very small, the A(2ε) can be looked as a
Table 1. Standard intensity data I(f) for γ-Fe2O3 (PDF #39-1346) and ZnFe2O4 (PDF #22-1012).
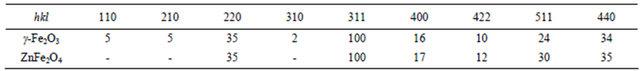
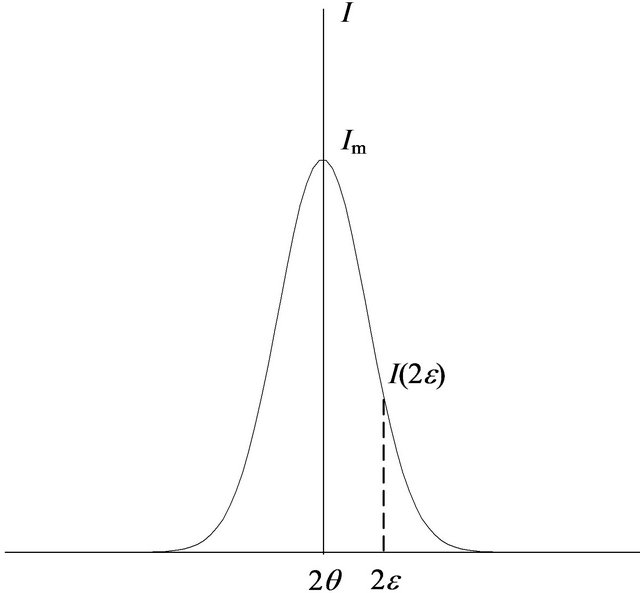
Figure 4. Schematic curve of X-ray diffraction intensity.
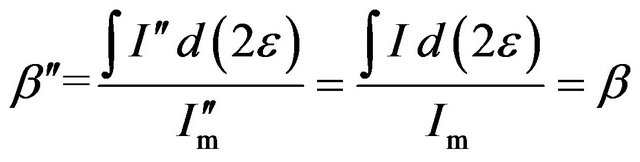
constant A less than one. Consequently, the FWHM β′ of the diffraction intensity with the absorption effect can be written as
 (6)
(6)
where  is the maximum of the diffraction intensity in the presence of the absorption effect. Obviously, if
  is regarded as Im, β′ = Aβ. Since A < 1, β′ < β. This means that in an actual XRD measurement, the curve of the diffraction intensity in the presence of an absorption effect is narrower than that for normal diffraction without an absorption effect, as shown in Figure 5. Hence, it can be said in summary that because of the effect of absorption, the grain size dc estimated using the Scherrer equation can be not only larger than the actual grain size but also larger than the physical size measured by TEM.
Also, when the volume fraction of diffracting units (in a mixture typically containing different crystallites) is less than one, the maximum of the diffraction intensity can be described by  = BIm and the curve of the intensity is given by
  = BI, where B is defined as the content factor and is less than one. So, the FWHM
  of the diffraction intensity with a volume fraction of diffracting units less than one is
 (7)
(7)
Equation (7) shows that the FWHM of the diffraction curve remains unaffected; it has a constant value β. In
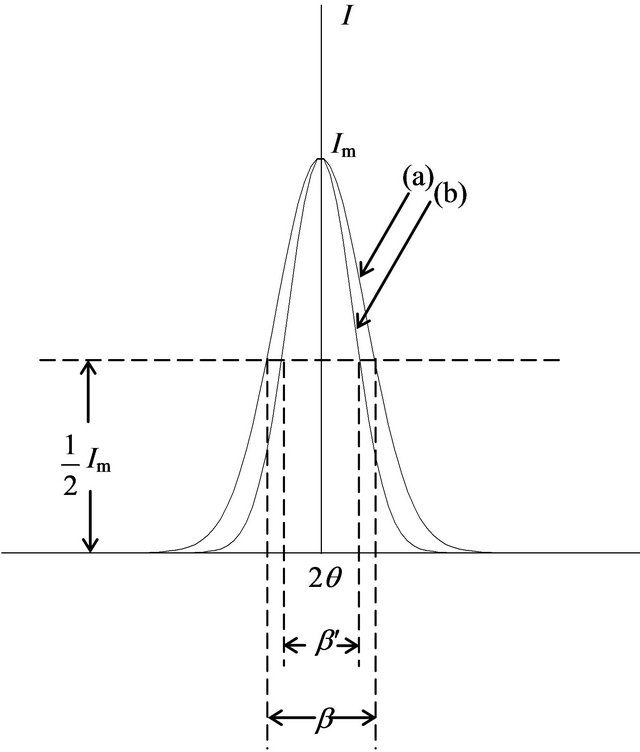
Figure 5. Comparison between intensity curves for (a) normal diffraction and (b) diffraction with absorption effect.
other word, the ratio between the integral intensity and maximum intensity is unchanged for both the diffraction with insufficient diffraction unit and normal diffraction.
5. Conclusion
X-ray diffraction is an important tool for identifying the structure of nanoparticles from the data on interplanar spacings and relative intensities that it provides. In the work presented here, the XRD results confirmed that during synthesis, ZnFe2O4 grew epitaxially on γ-Fe2O3 crystallites to form composite nanoparticles, which were then possibly coated with an FeCl3 layer. The size of the nanoparticles can be estimated from the XRD results using the Scherrer equation, and should be less than the physical size measured by TEM. However, our work shown that for nanoparticles with a coating heterolayer, the effect of absorption by the coating could weaken the XRD intensity from the interior of the particle compared with that for a bare particle without a coating layer, so that the FWHM of the diffraction peak would be reduced, making the apparent average size of the grains measured by XRD larger than the actual size. Consequently, it is possible that the apparent size of the grains obtained by XRD may be larger than the physical size given by TEM. When the volume fraction of diffracting units is less than one, both the FWHM of the diffraction peak and the apparent grain size are unchanged, and comparison with the FWHM of the unmodified nanoparticles may be used to determine whether a coating heterolayer has formed on the primary particles; that is, when β becomes smaller, a coating heterolayer has formed on the particles.
REFERENCES
- S. H. Sun, “Recent Advances in Chemical Synthesis, Self-Assembly, and Applications of FePt Nanoparticles,” Advanced Materials, Vol. 18, No. 4, 2006, pp. 393-403. doi:10.1002/adma.200501464
- J. Jiang and Y. M. Yang, “Facile Synthesis of Nanocrystalline Spinel NiFe2O4 via a Novel Soft Chemistry Route,” Materials Letters, Vol. 61, No. 21, 2007, pp. 4276-4279. doi:10.1016/j.matlet.2007.01.111
- Q. M. Zhang, J. Li, Y. Q. Lin, X. D. Liu and H. Miao, “The Preparation and Characterization of Ni-Fe Bioxide Composite Nanoparticles,” Journal of Alloys and Compounds, Vol. 508, No. 2, 2010, pp. 396-399. doi:10.1016/j.jallcom.2010.08.065
- B. C. Wen, J. Li, Y. Q. Lin, X. D. Liu, J. Fu, H. Miao and Q. M. Zhang, “A Novel Preparation Method for GammaFe2O3 Nanoparticles and Their Characterization,” Materials Chemistry and Physics, Vol. 128, No. 1-2, 2011, pp. 35-38. doi:10.1016/j.matchemphys.2011.01.012
- H. Miao, J. Li, Y. Q. Lin, X. D. Liu, Q. M. Zhang and J. Fu, “Characterization of Gamma-Fe2O3 Nanoparticles Prepared by Transformation of Alpha-FeOOH,” Chinese Science Bulletin, Vol. 56, No. 22, 2011, pp. 2383-2388. doi:10.1007/s11434-011-4559-z
- D. V. Szabó and D. Vollath, “Nanocomposites from Coated Nanoparticles,” Advanced Materials, Vol. 11, No. 15, 1999, pp. 1313-1316. doi:10.1002/(Sici)1521-4095(199910)11:15<1313::Aid-Adma1313>3.0.Co;2-2
- J. Liu, S. Z. Qiao, Q. H. Hu and G. Q. Lu, “Magnetic Nanocomposites with Mesoporous Structures: Synthesis and Applications,” Small, Vol. 7, No. 4, 2011, pp. 425- 443. doi:10.1002/smll.201001402
- Q. X. Liu, Z. H. Xu, J. A. Finch and R. Egerton, “A Novel Two-Step Silica-Coating Process for Engineering Magnetic Nanocomposites,” Chemistry of Materials, Vol. 10, No. 12, 1998, pp. 3936-3940. doi:10.1021/Cm980370a
- M. A. Willard, L. K. Kurihara, E. E. Carpenter, S. Calvin and V. G. Harris, “Chemically Prepared Magnetic Nanoparticles,” International Materials Reviews, Vol. 49, No. 3, 2004, pp. 125-170. doi:10.1179/095066004225021882
- M. Knobel, W. C. Nunes, L. M. Socolovsky, E. De Biasi, J. M. Vargas and J. C. Denardin, “Superparamagnetism and Other Magnetic Features in Granular Materials: A Review on Ideal and Real Systems,” Journal of Nanoscience and Nanotechnology, Vol. 8, No. 6, 2008, pp. 2836- 2857. doi:10.1002/chin.200943216
- T. Sato, T. Iijima, M. Seki and N. Inagaki, “Magnetic Properties of Ultrafine Ferrite Particles,” Journal of Magnetism and Magnetic Materials, Vol. 65, No. 2-3, 1987, pp. 252-256. doi:10.1016/0304-8853(87)90044-8
- S. Chakrabarti, D. Ganguli and S. Chaudhuri, “Optical Properties of Gamma-Fe2O3 Nanoparticles Dispersed on Sol-Gel Silica Spheres,” Physica E-Low-Dimensional Systems & Nanostructures, Vol. 24, No. 3-4, 2004, pp. 333- 342. doi:10.1016/j.physe.2004.06.036
- A. Naravanaswamy, H. F. Xu, N. Pradhan and X. G. Peng, “Crystalline Nanoflowers with Different Chemical Compositions and Physical Properties Grown by Limited Ligand Protection,” Angewandte Chemie-International Edition, Vol. 45, No. 32, 2006, pp. 5361-5364. doi:10.1002/anie.200601553
- C. G. Granqvist and R. A. Buhrman, “Ultrafine Metal Particles,” Journal of Applied Physics, Vol. 47, No. 5, 1976, pp. 2200-2219. doi:10.1063/1.322870
- L. L. Chen, J. Li, Y. Q. Lin, X. D. Liu and D. C. Li, “Surface Modification and Characterization of Gamma-Fe2O3 Nanoparticles Synthesized by Chemically-Induced Transition,” Materials Chemistry and Physics, submitted.
- P. Mathur, A. Thakur and M. Singh, “Effect of Nanoparticles on the Magnetic Properties of Mn-Zn Soft Ferrite,” Journal of Magnetism and Magnetic Materials, Vol. 320, No. 7, 2008, pp. 1364-1369. doi:10.1016/j.jmmm.2007.11.008
- J. Li, C. Liu and Y. Yao, “Study on Preparation of LaAlO3 Particles by Wet Chemical Method,” Journal of the Chinese Ceramic Society, Vol. 22, No. 5, 1994, pp. 504-508.
- H. P. Klug and L. E. Alexander, “X-Ray Diffraction Procedures for Polycrystalline and Amorphous Materials,” John Wiley & Sons Inc., New York, 1974, p. 299.
NOTES
*Financial support for this work was provided by the National Science Foundation of China (No. 11074205).
#Corresponding author.