Theoretical Economics Letters
Vol.05 No.05(2015), Article ID:60295,12 pages
10.4236/tel.2015.55073
Private and Public Debt Markets in Disequilibrium Theory
Frederick Betz1,2
1SUNY Korea, Incheon, South Korea
2Portland State University, Portland, OR, USA
Email: fbetz@venture2reality.com
Copyright © 2015 by author and Scientific Research Publishing Inc.
This work is licensed under the Creative Commons Attribution International License (CC BY).
http://creativecommons.org/licenses/by/4.0/


Received 10 August 2015; accepted 9 October 2015; published 15 October 2015
ABSTRACT
In disequilibrium pricing of financial markets, excesses in either public debt or private debt can trigger a financial crisis, with attendant bank panics and recessions. For example, in the Euro crisis beginning in 2010, financial contagion in the sovereign bond market has spread among five nations: Greece, Ireland, Cyprus, Portugal, and Spain. But the reasons for the contagion was initially different for the countries, due to either disequilibrium pricing in public debt markets or disequilibrium pricing in private debt markets. In previous papers, we introduced a time-independent- supply-demand model (three-dimensional model) for disequilibrium pricing in financial markets [1] and a steady-state disequilibrium systems model for the run-up of a financial crisis in a public debt market [2] . In this paper we construct a time-dependent disequilibrium systems model for the run-up of financial crises in a private debt market. We analyze the empirical case of the 2010- 12 Euro crisis in Spain (private debt crisis) and then compare this to the empirical case of the 2010-2015 Euro crisis in Greece (public debt crisis).
Keywords:
Financial Systems, Fiscal Crisis, Economic Recessions

1. Introduction
Irvin Minsky proposed a “price disequilibrium theory” for describing the dynamics of financial bubbles [3] ; and the author constructed a graphic depiction of financial transactions in capital-asset markets to depict Minsky’s disequilibrium theory [1] . In beginning and first decade of the twenty-first century, financial markets in both private-credit and public-credit experienced disequilibrium instabilities. In 2000, private-credit market instability occurred in the “dot-com bubble” of the U.S. stock market. In 2007, private-credit market instability occurred in the “mortgage-derivative bubble” of the U.S. Wall Street sector, threatening to shut down the U.S. financial system. In 2010, public-credit market instability occurred in a “sovereign-bond bubble” of the Greek bond market.
Figure 1 shows the relative debt levels of public and private debt, as percentages of GDP of the different nations in Europe and North America. Public debt is government debt, as shown in blue on the chart. Private debt is the sum of corporate and household debt as shown in green and brown on the chart.
Greece had the largest public-debt-as-percentage-of-GDP at 127% (PD/GDP), while Italy was close at 116%. The difference between Italy and Greece was tax policy. Greece had continuously run a government budget deficit, due to a reluctance to collect sufficient taxes. Martin Wolf expressed this: “What made the Greek fiscal position so bad was not that its spending was extraordinarily high by Eurozone standards, but rather that was revenue was so low, given the country’s high spending” [4] . The Greek tax policy was continually delinquent, never collecting sufficient revenue to fund its government services (in good economic times or bad). Greek governments used foreign borrowing (sovereign bonds) to fund their current expenses, covering perennial budget deficits. In 2009, Ireland at 66% (PD/GDP) and Spain at 53% (PD/GDP) and Portugal at 76% (PD/GDP) were all cases first of private debt market financial bubbles (and were not initially public debt crises).
Yet in these cases of Ireland, Portugal, and Spain, their private debt crises immediately triggered public debt crises. Martin Wolf wrote: “… once (a private sector) crisis hit, the private-sector financial deficit disappeared swiftly, whereas the fiscal deficit soared. The explanation for the latter is that government revenue fell dramatically, and crisis-driven government spending automatically rose, as the banks were rescued… When private spending collapses, as happened in Ireland and Spain, the fiscal deficit always rises more quickly than the external deficit falls …” [4] . Thus one needs to understand financial crises in both private and public debt markets to understand the Euro crisis of 2010-15.
In the financial contagion of the European sovereign bond market, contagion began with Greek bonds and next ran through Irish, Portuguese, Spanish bonds (while worrying the Italian and French bond market for a time). But the sources of the contagion differed in the different countries. In Greece, it was a financial contagion in the public debt market. In Ireland and Spain, it was contagion in private debt; and in Portugal, a contagion in both private and public debt. The contagions in the national private debt markets were due to housing booms, fueled by cheap Euro dollar credit.
2. Private Debt Market―Disequilibrium Systems Model in the Case of Spain 2010
In the Euro crisis of 2010, two different financial markets, public and private, had triggered Minsky moments in

Figure 1. Debt levels in Europe and the USA in 2009. Source: http://en.wikipedia.org/wiki/European_debt_crisis
different national financial systems. In Greece, it was in the public debt (sovereign bond market for Greek bonds) that a Minsky moment occurred; but in Spain, the Minsky moment occurred in private debt (housing market). Since 1984, private debt had risen in the Spanish housing market, until in 1999, housing prices began to climb into a “bubble” (as shown in Figure 2).
Residence ownership of houses was encouraged by the government and grew to 80% occupancy. From 2001 through 2005, variable rate interest mortgages were used and property developments increased. Over 500,000 residences were constructed in 2004, with about 300,000 purchased by Spanish citizens and 100,000 by foreign investors. When the housing bubble burst in 2007, housing sales immediately plunged 25%. Housing prices continued to decline and by 2012, had triggered a government crisis.
We next model this financial bubble (disequilibrium-price) in Spain from 2008-10 to 2012. In the Spanish private debt financial market for housing construction, interest rates and leverage were two controls on the flow of loans. Both leverage and interest rates were structural factors which could change over time. Until 2007, interest rates were low as Spanish banks borrowed in the Euro market; but interest rates in Spain jumped, after the 2007 U.S. fiscal bubble burst in U.S. mortgage-derivative market. Since structural features in a financial system change during the speculation in the market leading up to a financial bubble, a disequilibrium systems model must explicitly display a dimension-of-time for the structural change―as shown in Figure 3.
In this temporal model, a Trader obtains a Loan from a Bank with Leverage to purchase a capital asset in a Market in the time period T1. Rates on Interest and also Leverage are both necessary for the Trader to optimize profits, when the trader resells its Capital Asset purchase at the future time. The capital-asset market was in price equilibrium when traders begen speculation in the market, with the reflexive expectation that prices in the market would rose above equilibrium price. Later in the time period T2, bank financing of trader loans changed the market financing from a state of “Speculative” to that of “Ponzi” and then the global financial market collapsed in 2008. The “Minsky moment” occurred when the real estate bubble in Spain “burst” and the Spanish banks financing the real estate loans suddenly became “insolvent”.
Next the Spanish government rescued the insolvent Spanish banks, holding defaulted mortgages as collateral. Tom Burridge wrote: “Spain is to get up to 100 bn Euros in loans from Eurozone funds to try to help shore up its
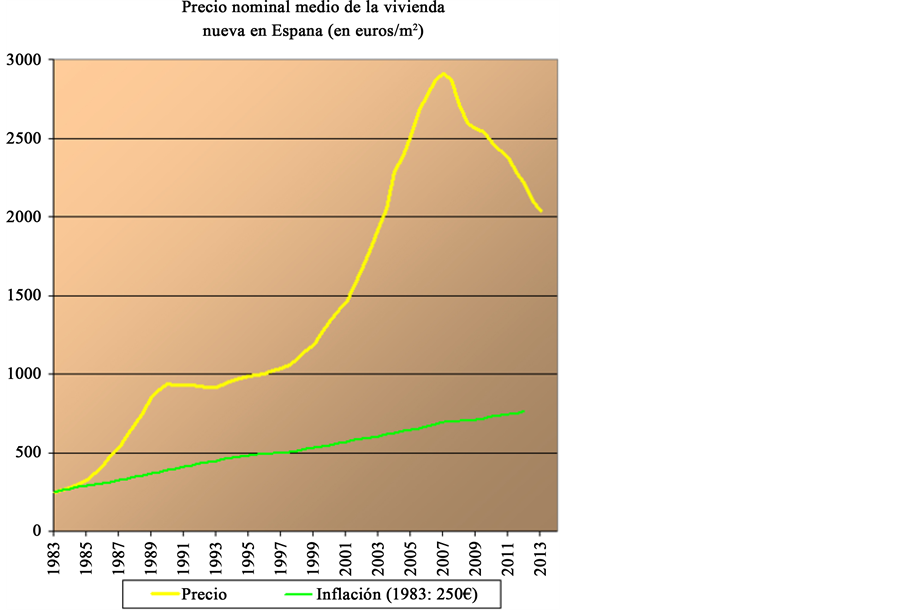
Figure 2. Spanish house prices 1984-2013. Source: http://en.wikipedia.org/wiki/Spanish_property_bubble
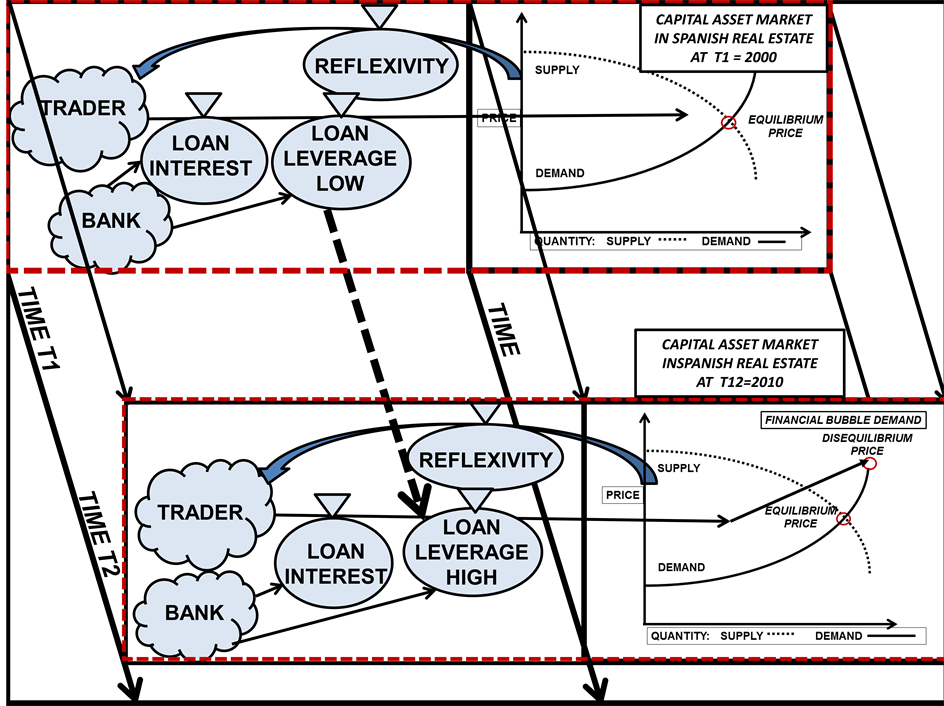
Figure 3. Spanish private debt bubble.
struggling banks. The move was agreed during emergency talks with Eurozone finance ministers… Most analysts and experts would say this is a bailout… and the money is going to be directed via the Spanish government using the Fund for Orderly Bank Restructuring (which is a bank restructuring fund in Spain). But it is a government institution, so the debt is going to be on the Spanish government's books. It is money that will be directed towards troubled Spanish banks, banks that lent heavily during the construction boom here―of course, the property market crashed and the loans turned bad” [5] .
The government rescue of the private banks was necessary because of the insolvency of the banks. Floyd Norris had written: “The Spanish banks are bleeding from loans secured by raw real estate, and from loans for construction. The pain is made worse because such lending soared during the property boom. It is those loans that are now devastating bank balance sheets, as developers who borrowed to build offices, stores and neighborhoods saw demand dry up and now cannot pay the banks back. Just when markets were focused on the risks of a Greek default and the possibility of contagion to other countries, Spain’s central bank reported this week that things were getting worse for that country’s banks―but not because they held a lot of Greek debt or bonds issued by other troubled economies… With Spain’s economy weak and home prices falling, bad loans are growing. And the central bank thinks things are getting worse… It is impossible for Spanish banks to walk away from a collapsing bubble in Spanish real estate… The Bank of Spain has created a program to force mergers of the smaller banks and to bring in better management. It has put about 11 billion Euros into the banks to recapitalize them, and is putting in another 15 billion Euros in a process… (with) an estimate is that the overall number needed is closer to 50 billion Euros” [6] .
The Spanish government provided more than 26 billion Euros to the Bank of Spain to distribute to Spanish banks. The funds were loaned to the government by the “Troika” of the European Union and the International Monetary Fund. In return, the Spanish government agreed to reforms imposed as an austerity policy by the Troika institutions. The Spanish government debt did not soar until after the private debt housing bubble burst, and the government stepped in as “lender-of-last-resort” to save the Spanish banks. We next depict the role of the central bank of Spain in this connection between the financial system and production system in Spain at the time of the crisis in a time-explicit disequilibrium-systems model, Figure 4.
The difference between this systems disequilibrium model (Figure 4) and that of the preceding Figure 3 is the intervention of the Spanish Central Bank―as the “lender-of-last-resort” to prevent bank runs in Spanish banks. But this “Bagehot role” of the central bank rescuing the private banks then increased public debt of the Spanish government. Figure 5 compares Spanish public debt to average European public debt. The Spanish government debt was low, compared to the average government debt of EU countries―up until the time of saving the Spanish banks in 2008. The Spanish government debt rose to Eurozone averages.
3. Private Debt Market―Disequilibrium Systems Financial Model and Economic Recession in the Case of Spain 2010
Next the fiscal crisis in Spain triggered an economic crisis―a severe recession in the Spanish economy. This was again classical economic system behavior―a fiscal crisis triggered an economic crisis. We next connect the fiscal crisis in Spain to the economic crisis which followed, modeling the connection in a systems dynamics model of a society, as composed of the different subsystems: economic, cultural, political, and technological. Therein, one can display the interaction (between the financial system at the time of a financial bubble and the production system) by showing the models of the financial system upon a topological plane separate from models of the production system on a different model plane [7] . This is depicted in Figure 6, where commodity markets are placed upon a production plane and financial markets are placed upon a financial plane.
In the production sub-system of a national economy, individual businesses, firms, produce goods within the
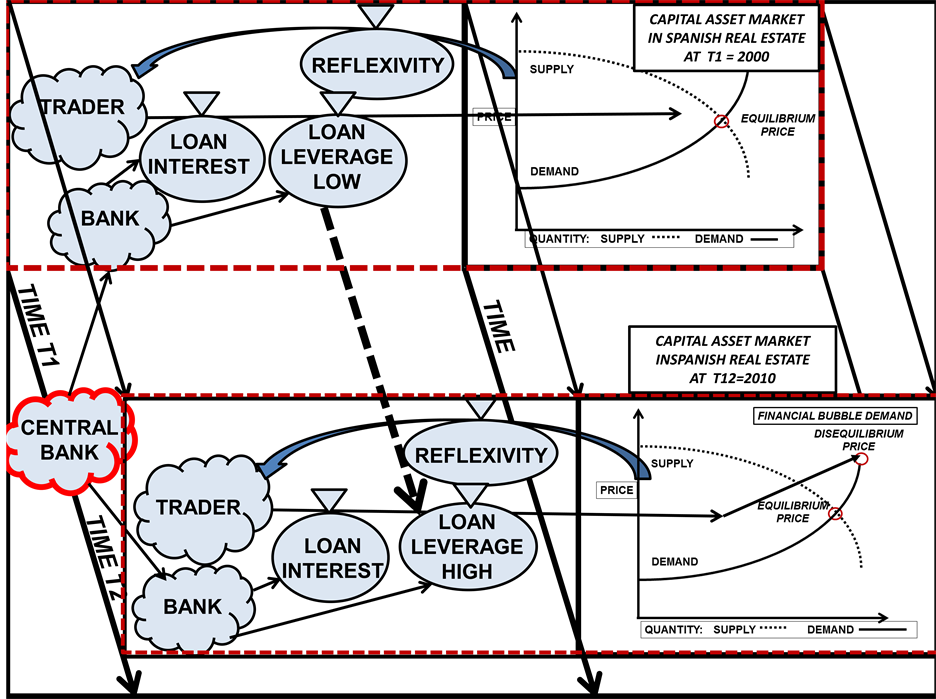
Figure 4. Spanish private debt bubble with Spanish central bank intervention.

Figure 5. Spanish debt compared to Eurozone average debt source: http://en.wikipedia.org/wiki/European_debt_crisis

Figure 6. Economic system plane of a societal model.
industrial framework of an “industrial value chain”. The firm can be modeled as a value-adding system; and the industrial context as an industrial value chain. All the firms and their industrial value chains operate in the production of commodities under an equilibrium pricing of supply-demand. Thus commodity products have a single economic value of “consumption”―which is priced in equilibrium of supply and demand.
In contrast, in the financial sub-system of a national economy, the buying-and-selling (trading) of capital assets need to be modeled in a time-dependent transactional process. Central to the profitability of capital asset trades is the “leverage” in the loans―with higher leverage creating larger profits in the liquidity of an asset (and also higher risk). The time dependence in the financial market allows “leverage” in financial transactions to increase over time with liquidity at higher and higher prices―a financial bubble.
The reason for topological separation of the models commodity and financial markets is that their dynamics are quite different: price equilibrium in commodity markets but price disequilibrium in financial markets. And a fiscal crisis in the financial system triggers an economic recession in the production plane. This occurs as bank failures stop the credit system of a nation; and business declines with unemployment rising. Banks provide the daily accounts and credit lines upon which businesses operate―manufacturing, services, and retail businesses. When bank accounts are frozen, the monetary system (currency and credit) stops and the economy seizes up. Businesses need daily credit lines with banks to operate on a daily schedule. Thus the monetary system is one of the societal sub-systems (in addition to energy sub-systems) which need to operate on a daily (and even hourly) basis for a modern economy to run continuously.
In Spain in 2011, this connection between financial and production systems was direct and swift. Spain’s financial system plane (with its sudden property-bubble/bank-failures) and Spain’s production system plane connected (with an immediate Spanish economic-recession). Unemployment in Spain jumped to 36% in 2008 and, even as late as 2012, ran at 24%. This connection is described in the disequilibrium systems model of Figure 7.
In the Financial Sector, a price-disequilibrium systems model depicts the flow of loans from banks to traders (construction businesses and home owners) to develop, sell, and own residences. The reflexivity (market per-
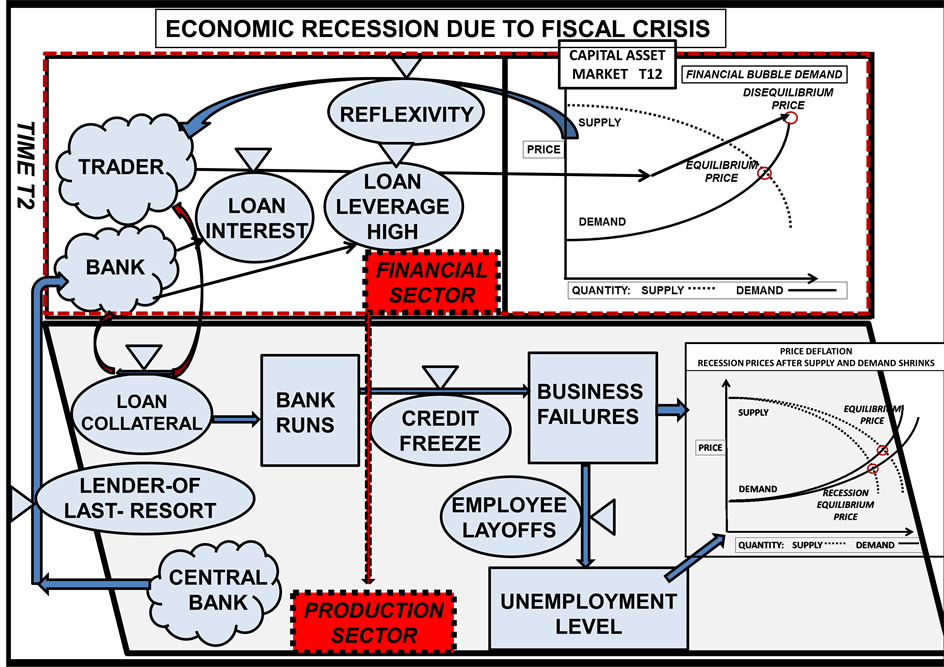
Figure 7. Economic recession due to fiscal crisis.
ception) was that housing prices would rise over time. And prices in the housing market did rise above an equilibrium price because new home construction was continually anticipating expanding demand. Thus in the growing home market, financial expectations (reflexivity) anticipated ever higher prices―driving the market from a price equilibrium to disequilibrium economic condition.
In the Production Sector, the loan collateral held by the banks in their funding of financial market speculation became worthless (unsellable) with the collapse of the housing market. Instantly, the banks became illiquid (and some insolvent). Bank runs began by depositors withdrawing their accounts. The illiquid/insolvent banks freeze their accounts, and credit ceases in the economy. Businesses and employees are unable to access their bank accounts and credit lines stop working.
In providing construction loans and residence purchase mortgages as collateral the Spanish banks held highly- leveraged loans, with liens on the titles to the properties. When the housing bubble burst, the collateral could not be sold, and the Spanish banks became insolvent. They thus held long-term loans but funded by short-term borrowing from foreign banks and investors. Borrow short and lend long―is a basic way for banks to become insolvent. Thus from illiquid collateral, bank runs occurred on the insolvent banks. Insolvent, the banks could make no further loans and the credit market in Spain froze. Businesses operating daily upon credit lines with banks could no longer obtain cash and closed down production levels, laying off workers. Unemployed labor could not purchase commodities, so that prices in the commodity markets in Spain declined to recession/de- pression levels. And Spain was in a depression, with high unemployment, lowered production, and a financial crisis.
It was in May 2012 when the recession deepened, and the Spanish government began “bailing-out” banks. David Jolly had reported: “Spanish retail sales fell in April by a record 9.8 percent from a year earlier, the 22nd consecutive monthly decline, the government statistics institute said in Madrid. In a separate report, the Bank of Spain forecast that the economy would continue contracting throughout the first half of 2012, after shrinking by 0.3 percent in the first three months of the year. Spain, with the highest jobless rate in Europe, is struggling to fix its financial sector, which was battered by the collapse of the credit bubble. The country has again become the subject of concern after Bankia, a real estate lender that the government is nationalizing, said Friday that it needed a total bailout of 23.5 billion Euros, or $29.4 billion… The Spanish economy is shrinking as the central government and the regional authorities cut spending to meet budget targets. Making matters worse, the housing sector continues to decline and sales to other European countries, which have helped to sustain exporters, are likely to weaken as the bloc’s economy stagnates. The banking sector’s troubles could make it harder for even healthy companies to get credit” [8] .
As “lender-of-last-resort”, the central bank of Spain moved to “bail out” the failing banks; and then the interest rate on Spanish sovereign bonds jumped higher. In June 2012, David Jolly reported: “Government borrowing costs spiked to euro-era highs for Spain on Thursday, and Italy had to pay high rates again to complete a bond auction, as pressure mounted for a unified European response to the region’s financial problems. The yield, or interest rate, on Spain’s 10-year bonds reached 7 percent, the level that has set off full international bailouts of some other euro zone members, after Moody’s Investors Service downgraded the nation’s credit rating late Wednesday… Italy’s Prime Minister, Mario Monti, said Thursday that more steps needed to be taken at a European level to protect the euro union from the onslaught of the financial markets. It was an assessment shared by the new French president, François Hollande, who appeared with Mr. Monti at a news conference after they met for two hours in Rome” [9] .
In July 2012, Raphael Minder and Stephen Castle reported: “Struggling to meet euro zone financial targets, Prime Minister Mariano Rajoy of Spain introduced his latest package of tough austerity measures Wednesday, including a rise in the sales tax, reversing his previous stance. The package, Mr. Rajoy’s fourth set of budget measures in seven months, is intended to reduce the budget deficit by ?5 billion, or $80 billion, over two and a half years. It follows a decision by European Union finance ministers Tuesday to relax Spain’s deficit target for this year to 6.3 percent of gross domestic product, rather than the 5.3 percent target that was set only four months ago. But the finance ministers also said they expected Madrid to continue showing progress on its deficit cutting. The new austerity plan came as Finland’s prime minister, Jyrki Katainen, issued a warning Wednesday that the euro’s predicament was as perilous as at any time in the past two years. “This situation is dangerous, very dangerous,” he said in an interview with Finland’s biggest daily, HelsinginSanomat. One of the main elements of the new round of Spanish austerity measures is a rise in the value-added tax to 21 percent from 18 percent” [10] .
In 2012, the austerity pressure on Spanish people was heavy and many exported savings and/or also left Spain. In September 2012, Landon Thomas reported: “After working six years as a senior executive for a multinational payroll-processing company in Barcelona, Spain, Mr. Vildosola is cutting his professional and financial ties with his troubled homeland. He has moved his family to a village near Cambridge, England, where he will take the reins at a small software company, and he has transferred his savings from Spanish banks to British banks. “The macro situation in Spain is getting worse and worse”, Mr. Vildosola, 38, said last week just hours before boarding a plane to London with his wife and two small children. “There is just too much risk. Spain is going to be next after Greece, and I just don’t want to end up holding devalued pesetas”. Mr. Vildosola is among many who worry that Spain’s economic tailspin could eventually force the country’s withdrawal from the euro and a return to its former currency, the peseta. That dire outcome is still considered a long shot, even if Spain might eventually require a Greek-style bailout. But there is no doubt that many of those in a position to do so are taking their money―and in some cases themselves―out of Spain” [11] .
4. Public Debt Market―Disequilibrium Systems Model in the Case of Greece 2010
In the case of Greece, financial contagion was due to government borrowing for funding current operations― covering an operational annual budget deficit. It was simply (and continually) bad fiscal policy. In a previous paper [2] , the disequilibrium systems model for Greece was described and now is shown again in Figure 8.
In this public debt bubble, Greek governments had issued new sovereign bonds each year to fund annual budget deficits. Over time, this continual funding of budget deficits built up the national debt of the country. The Greek national debt as a percentage of GDP (%ND/GDP) rose to about the Eurozone average of 50% ND/GDP in 1985 to 100% in 1993 and then (after 2007) jumped to 180% in the crisis year of 2011. Then Greece needed to annually roll-over 20% (ND/GDP), with its 80% of sovereign debt held by foreigners. This need 1) for annual roll-over mostly to foreigners along with 2) the need to annually continue to add debt to cover budget deficits― spooked the bond market―“market reflexivity”. From 2009 to 2012, interest rates on new Greek bonds demanded by the market jumped from 3.7% to 177.37%. The Greek government was bankupt in 2010―despa- rately needing an EU “bail out”.
Time is implicit within this systems dynamics models as the flows are continual between sources (e.g. tax
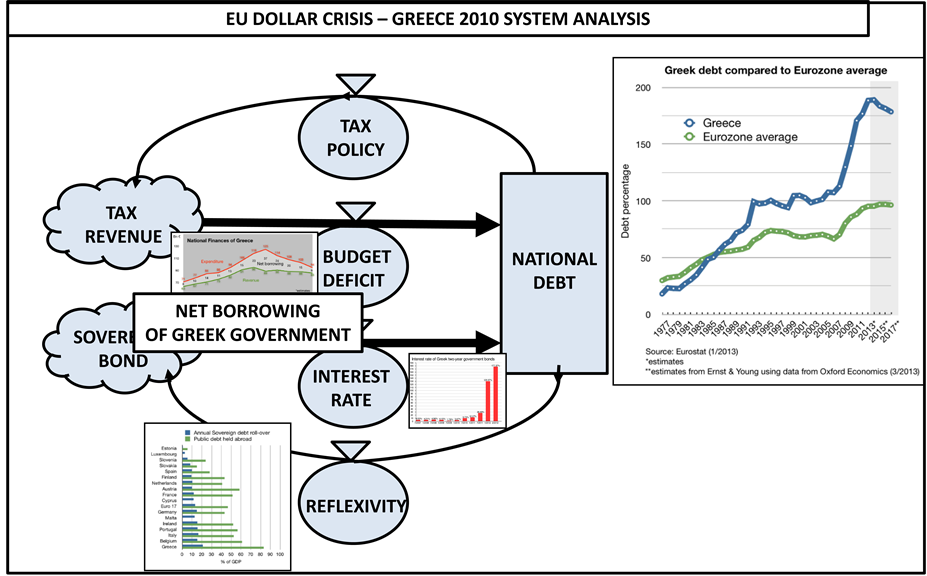
Figure 8. Disequilibrium systems model of Greek fiscal policy
sources and bond sources) and stock (e.g. national debt) of the system. Such flows are determined by the institutional structure of the system, adjusted by the structural rate controls (e.g. budget deficit, interest rate, reflexivity, tax policy). If the institutional structure does not alter, then a systems dynamics model is a “stasis” model (constant flow model). Thus the dimension of time did not appear explicitly in this disequilibrium system model of Greek fiscal policy, because there were no structural changes to the Greek system over the period of time leading to the fiscal crisis in 2010. But then ‘market reflexivity’ (perceptions by bond traders on the likelihood of a Greek debt default) changed! Then bond traders would no longer purchase Greek sovereign bonds at reasonable interest rates. The market would no longer buy them, and interest rates on new Greek bonds jumped―a “Minsky moment”. At the time of the fiscal crisis in 2009, the reflexivity in the bond market jumped the acceptable interest rates on new Greek bonds to bubble heights, as market doubt began about the financial stability of the Greek government―a structural change in the market, due to market reflexivity.
Afterwards, the Greek government could no longer sell sovereign bonds in the international bond market and required injections of external funds to continue government operations and a national financial system. A European “bailout” was needed to avoid Greece’s default on its debt. In May 2010, a “Troika” (the European Commission, the European Central Bank (ECB) and the International Monetary Fund (IMF)) provided to the Greek Government (then under Prime Minister Georg Papandreou) a first bailout package of 107.3 billion euro. In March 2012, the Troika provided a second bailout package of an additional 130 billion euro for the years 2012-2014. Liz Alderman wrote: “The bailouts came with conditions. Lenders imposed harsh austerity terms, requiring deep budget cuts and steep tax increases. They also required Greece to overhaul its economy by streamlining the government, ending tax evasion and making Greece an easier place to do business” [12] . The “time line” of structure in the Greek fiscal crisis from T1 (2009) to T2 (2015) unfolded as:
T1 “December 2009. Credit ratings agencies downgrade Greece on fears that it could default on its debt”. “May 2010. Europe and Greece reach a $146 billion rescue package, conditional on austerity measures. Some economists say the required cuts could kill the patient”. “October 2011. Banks agree to take a 50 percent loss on the face value of their Greek debt”. “July 2012. Stocks soar after the head of the E.C.B. says policy makers will do ''whatever it takes'' to save the euro zone”. T2 “January 2015. Greek voters choose an anti-austerity party. Alexis Tsipras becomes prime minister”. “May 2015. Greece quells fears of an imminent default on its debts, authorizing a big loan payment to the IMF It is not clear how much longer Greece can continue to scrape by”. June 2015. “Greece elevated the game of brinkmanship with its international lenders on Tuesday (June 2, as Prime Minister Alexis Tsipras announced that his government had sent creditors a new proposal, on Greece’s own terms, to unlock financial aid that the struggling nation desperately needs. But the creditors ―the European Commission, the International Monetary Fund and the European Central Bank―were moving on Tuesday toward completing their own proposal to break the months long impasse with Athens. That move came after European leaders, including Chancellor Angela Merkel of Germany, held an emergency session in Berlin on Monday night to come up with a blueprint” [13] .
Thus a structural change occurred in the systems model of the Greek fiscal system, with the addition of “bailout” funding from the ‘Troika’; and this is shown in Figure 9. One needs to add a central bank source (Greece Central Bank) to receive funds from outside Greece as the “bailout” loans from the Troika. From T1 (2009) to T2 (2015), Greek fiscal policy was on a Troika financial “life-line” (bail-out), unable to handle its debt load― while also having to begin paying back IMF loans.
Next to model the structural change from T1 to T2, we introduce an explicit time dimension (a la “Minsky”) into a disequilibrium systems-model for the Greek fiscal crisis―marking changes in Greece’s financial structures of its fiscal policy (Figure 10).
This describes a structurally-time-changed-disequilibrium systems model of a governmental fiscal system (public debt). There are two kinds of time lines in a Minsky systems dynamics model of a price-disequilibrium of a financial market. Within the systems dynamics model, the financial processes are in a stasis mode (recurrent mode), with valves (such as tax policy, budget deficit, interest rate, reflexivity) controlling the steady-state flow of finances from sources (tax revenue and sovereign bonds to a financial stock (national debt). But a second kind of time occurs when a bubble builds in the market (from T1 to T2) resulting in a “structural change” in the market system, collapse of the bubble and external banking intervention (Euro Troika) to bail-out the collapsed market.
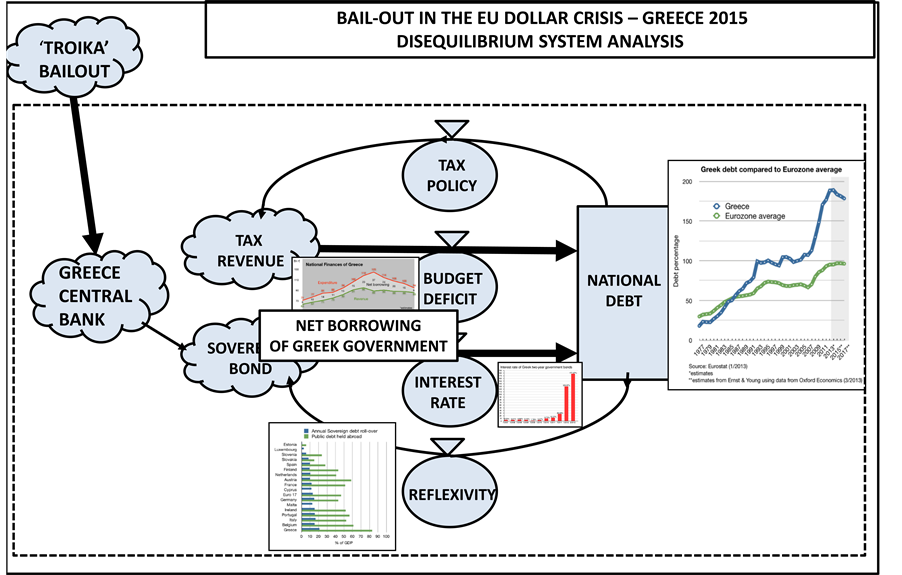
Figure 9. Troika bailout of the Greek central bank in the EU crisis.
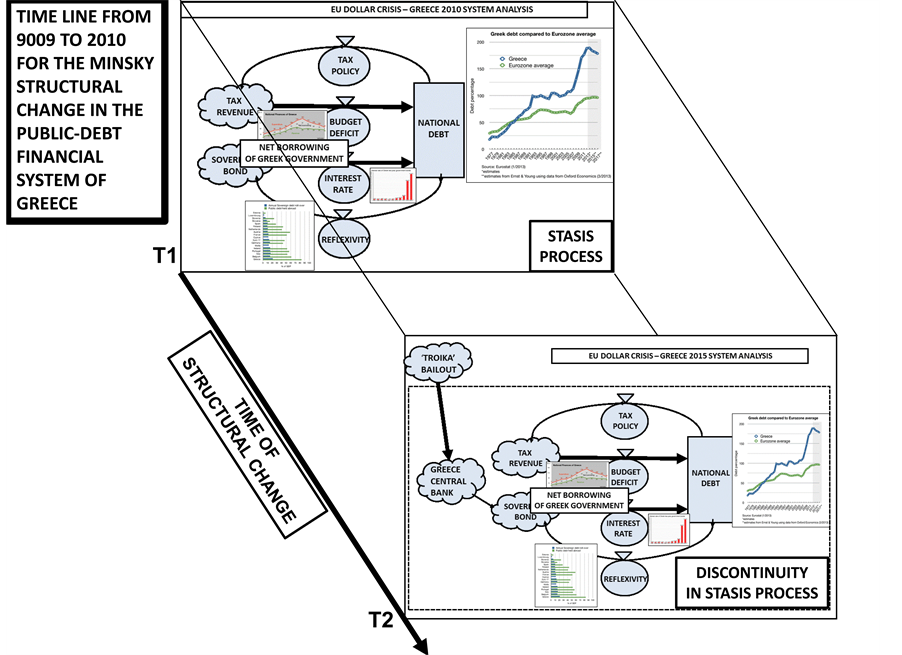
Figure 10. Time line of structural change in the Greek public debt fiscal system.
Financial markets while in stasis (steady-state operation) are inherently not stable over time when structural change occurs (e.g. change in market reflexivity). This is the Keynes/Minsky disequilibrium theory of instability in financial markets over time (time of structural change in the market)―indigenous instability in a financial market.
Structural changes in financial markets occur from either from regulatory changes (government) or from reflexivity changes (trader perceptions) about how the trading operations occur in markets of capital assets― Keynes/Minsky financial markets.
Models of national financial systems need to be embedded into an international financial system, when structural changes occur in national systems.
5. Results
In modeling different countries’ crises in the Eurozone, one observes different debt markets triggering the financial bubbles―either as public debt (sovereign bond markets) or as private debt (e.g. residential markets). Greece was a pure economic case of a public debt bubble and Spain was a pure economic case of a private debt bubble. All the other countries impacted by the Euro crisis (such as Ireland, Portugal, Italy) were cases of one or the other or a mixture of both. The importance of distinguishing the market source of a disequilibrium price crisis is that different policies are needed to solve a crisis problem, to “fix” a crisis.
In the case of Spain (with a private debt crisis) the economy could be fixed by preventing bank runs and regulating the bank system―recapitalizing the illiquid banks, and closing down the insolvent banks. The Spanish central bank was able to accomplish this with the ‘bail-out’ of European Union loans to the Spanish government. And Spain began to emerge from the 2010 crisis three years later in 2013. Raphael Minder reported: “Spain pulled out of a two-year recession in the third quarter (October 2013), with its economy growing 0.1 percent from the previous quarter, according to preliminary data released Wednesday by the Spanish central bank… The growth news will likely provide a fillip for the conservative government of Prime Minister Mariano Rajoy, which, since coming into office almost two years ago, has pushed through deeply unpopular spending cuts and tax hikes in order to comply with budgetary targets in accordance with Spain’s European partners… In the end, Spain used 41 billion Euros, or $56 billion, of the 100 billion Euros that it negotiated in a European banking rescue package” [14] .
In contrast in the case of Greece (with a public debt crisis), the Greek economy continued in crisis and depression from 2010 into 2015―still with no “fix” (despite sizable loans from the European Union). In 2015, Hugo Dixon wrote: “The debt is still huge―313 billion Euros, or about $353 billion―175 percent of the Greek gross domestic product. But the bulk, about ?84 billion, is now owed to Eurozone governments and pays low interest. What is more, Greece doesn’t have to start repaying it until 2020 and then has over 30 years to finish. The so-called present value of this debt, what it is worth today, is therefore much lower than its official face value. Unfortunately, this isn’t the full story. Greece has four other sources of borrowing: ?7 billion owed to the European Central Bank; ?0 billion owed to the International Monetary Fund; debt owed to private investors; and short-term treasury bills. The private debt isn’t an immediate problem, because most of it has also been stretched out over a long period. Nor are the treasury bills, as Athens is still able to roll them over as they come due. But the ECB and IMF debt is problematic because most of it comes due in the next five years. In fact, there is a crunch in the next few months, with over ?0 billion in repayments due by the end of September. The snag is that IMF and ECB debt cannot be rescheduled without breaching rules and treaties. This is why the focus of the current talks is about lending Greece more money, so that it can meet these obligations… The Eurozone will also be under pressure to provide yet more loans to Athens because the money left in the current bailout program won’t be sufficient to cover all the repayments due to the E.C.B. and I.M.F. What is more, the country has other needs, such as paying overdue bills to suppliers, recapitalizing Greek banks and repaying the loans it has forcibly extracted from local authorities within Greece” [15] .
6. Conclusions
The Eurodollar crises of 2009-2010 provide empirical evidence about policies for dealing with two different debt markets, private and public. Disequilibrium-systems models of how private and public financial markets can move toward price disequilibrium are useful for identifying 1) how fiscal policies can create fiscal crises and 2) how central bank policies can help or not help to solve fiscal crises.
What was particularly interesting in this comparison was that the European Union (including its European Central Bank and the IMF) was able to help solve the Spanish financial crisis but not the Greek financial crisis. This difference in “crisis solvability” depended upon the underlying fiscal models of private debt markets compared to the public debt markets. Accordingly, the two disequilibrium-systems models of financial markets in the empirical case of the Eurodollar crises suggest the following hypothesis: Central banks can solve crisis- problems of private debt but not crises of public debt. A central bank has no control over its government’s tax policy.
Cite this paper
FrederickBetz,11, (2015) Private and Public Debt Markets in Disequilibrium Theory. Theoretical Economics Letters,05,624-636. doi: 10.4236/tel.2015.55073
References
- 1. Betz, F. (2014) Disequilibrium Pricing Theory. Theoretical Economics Letters, 4, 60-67.
- 2. Betz, F. (2014) Disequilibrium Pricing—Greek Euro Crisis. Theoretical Economics Letters, 4, 897-909. http://dx.doi.org/10.4236/tel.2014.49113
- 3. Minsky, H. (1975) John Maynard Keynes. Columbia University Press (Reprinted in 2008 by McGraw Hill Education), New York City.
- 4. Wolf, M. (2014) The Shifts and the Shocks: What We’ve Learned-and Have Still to Learn-from the Financial Crisis. Penguin Press, New York City.
- 5. Burridge, T. (2012) Spanish Banks to Get up to 100bn Euros in Rescue Loans. BBCNEWS, June 12. http://www.bbc.com/news/business-18382659
- 6. Norris, F. (2011) Spain’s Banking Mess. New York Times, September 22. http://www.nytimes.com/2011/09/23/business/spains-banking-mess.html
- 7. Betz, F. (2013) Why Bank Panics Matter. Springer, New York.
- 8. Jolly, D. (2012) Spanish Data Point to Further Decline. New York Times, May 29. http://www.nytimes.com/2012/05/30/business/global/daily-euro-zone-watch.html?_r=0
- 9. Jolly, D. (2012) Spanish Cost of Borrowing Soars After Rating Cut. New York Times, June 14. http://www.nytimes.com/2012/06/15/business/global/daily-euro-zone-watch.html
- 10. Minder, R. and Stephen, C. (2012) Spain Plans New Round of Tough Austerity Measures. New York Times, July 11. http://www.nytimes.com/2012/07/12/business/global/daily-euro-zone-watch.html
- 11. Thomas, L. (2012) Fears Rising Spaniards Pull out Their Cash and Get out of Spain. New York Times, September 3. http://www.nytimes.com/2012/09/04/business/global/money-and-people-leave-spain-as-economic-gloom-deepens.html
- 12. Alderman, L. (2015) Explaining the Greek Debt Crisis. New York Times, April 8. http://www.nytimes.com/2015/04/09/business/international/explaining-the-greek-debt-crisis.html?_r=0
- 13. Alderman, L. (2015) Greece Challenges Creditors with New Proposal to Break Debt Impasse. New York Times, June 2. http://www.nytimes.com/2015/06/03/business/international/greece-debt-ecb-imf-european-commission.html?_r=0
- 14. Minder, R. (2013) Spain Emerges From Two Year Recession. New York Times, October 23. http://www.nytimes.com/2013/10/24/business/international/spain-emerges-from-two-year-recession.html
- 15. Dixon, H. (2015) Financial Engineering to Athen’s Rescue. International New York Times, June 14. http://www.nytimes.com/2015/06/15/business/international/financial-engineering-to-athenss-rescue.html?_r=0