Open Journal of Marine Science
Vol.2 No.1(2012), Article ID:17068,8 pages DOI:10.4236/ojms.2012.21004
Role of Transparent Exopolymer Particles on Phytoplankton Dynamics in a Subtropical Estuary, Cananéia-Iguape (SP, Brazil)
1Departamento de Biologia Marinha, Universidade Federal do Rio de Janeiro, Rio de Janeiro, Brazil
2Faculdade de Oceanografia, Universidade do Estado do Rio de Janeiro, Rio de Janeiro, Brazil
3Instituto Oceanográfico, Universidade de Sao Paulo, Sao Paulo, Brazil
Email: juanalba@biologia.ufrj.br
Received September 16, 2011; revised October 30, 2011; accepted November 10, 2011
Keywords: Cananéia-Iguape Estuarine Lagoon System; Phytoplankton Biomass; Carbon Flux
ABSTRACT
Transparent Exopolymer Particles (TEP) has a known crucial role in vertical fluxes of carbon in the ocean and has been intensively studied in the last decade. Nevertheless, few studies have considered horizontal fluxes of TEP. These fluxes arise prominently between estuaries and the coast, where its importance is associated to the predominant horizontal transport. This is due both to the low density of the TEP agglomerate generated in low density waters of continental origin, and to the fact that the main component of the advective transport at estuarine regions is the horizontal one. In this study, the significance of TEP in the particulate matter exchange between estuary and coast was analyzed in the estuarine lagoon system of Cananéia-Iguape (southeast coast of Brazil). TEP, total seston (TS), organic seston (OS) and chlorophyll a (Chl.a) were analyzed over complete tidal cycles, during the dry and rainy seasons both at spring and neap tides. Horizontal fluxes and net transport rates of these variables were also calculated. TEP concentrations (max. 4991 µg Xeq/L) were almost one order of magnitude higher during the rainy season. TEP horizontal transport rates as high as 1.8 g Xeq·m/s were observed at the northern inlet of the system. In terms of particulate carbon, it represents 32.7 g TEP-C m/s or 4% of the OS transport rates. Our study quantifies the advective transport of TEP and their importance in particulate matter exchange between a subtropical estuarine system and the adjacent coastal region. Our results contribute to the knowledge of exopolimer particles dynamics in subtropical estuarine systems, and their relationship to phytoplankton biomass and particulate matter.
1. Introduction
The ecological role of the carbonic exopolymers produced by phytoplankton and bacterioplankton, the Transparent Exopolymer Particles (TEP), has been recently emphasized in the biogeochemical cycle [1]. This stems from their central role in coagulation [2,3] and sedimenttation of particles [3-6]. TEP form the organic matrix of marine snow, enhancing vertical fluxes of organic matter [4,7,8] and carbon export from the surface [7,9]. These vertical fluxes has been recently studied, both in field and laboratory experiment to determine their significance in the carbon budget dynamic, [3,4,6]. In this way, loss of TEP-derived carbon through sedimentation from 7 to 490 mg TEP-C/m2·d was related for different coastal environments [1]. TEP have also been related to the termination of diatom spring blooms in temperate waters, since they increase aggregate formation [10-12].
Nevertheless, few studies were devoted to determine the significance of TEP in horizontal fluxes of particulate matter. Since TEP have been found to be abundant in all waters whether fresh or marine [1], horizontal transport rates of these particles certainly are significant for carbon fluxes in environments where this movement is the principal component of advective transport.
In this paper, horizontal fluxes and resultant transport rates of TEP, seston and phytoplankton biomass were investigated in a subtropical estuarine system to quantify the significance of TEP in particulate matter exchanges between an estuarine system and the nearly coastal region.
2. Material and Methods
2.1. Study Area
The Estuarine-Lagoon System of Cananéia-Iguape (ELSCI) is located on the southeast coast of Brazil, around 25˚S. With an extension of 10,000 ha, ELSCI is associated to a broad and relatively well-protected mangrove forest. The whole system is limited by a long barrier island, which settles two main connections to the Atlantic Ocean: Icapara Inlet, in the north, and Cananéia Inlet in the south (Figure 1), called here northern and southern inlets, respectively. The inner geomorphologic structure leads to an intricate circulation pattern, with higher freshwater discharge in the northern portion due to an artificial channel, Valo Grande (VG), which connects the Ribeira de Iguape River to the estuary. This channel releases an annual mean runoff of 435 m3/s [13] to the northern portion of the system. In the other hand, the sum of freshwater contribution to the southern portion is about 47.24 m3/s [14]. At this subtropical environment a dry/rainy season classification was used due to the small variability of other climatologic variables along the year. Even the “dry” season is not really dry but less rainy. Mean annual rainfall is 2200 mm, with maxima (mean > 200 mm·mo–1) during summer (from December to March— rainy season) and minima (mean < 100 mm·mo–1) during winter (from June to September—“dry” season) [13].
2.2. Field and Laboratory Measurements
On July 2001 and January 2002 samplings and in situ measurements were carried out at anchor stations located in Cananéia, southern (25˚03'S, 47˚55'W), and Icapara, northern (24˚40'S, 47˚26'W), inlets cross sections (Figure 1). At each station, two time-series surveys were performed over complete tidal cycles (semi-diurnal tide), at both spring and neap tides. Meteorological data were obtained from a meteorological station located in Cananéia, and freshwater discharge was monitored by DAEE (Departamento de Água e Esgoto) in Iguape. At the anchor stations, hydrographical properties and current measurements were taken hourly at every meter depth along the water column.
Temperature and salinity were measured using a CTD (SEABIRD). Nearly simultaneous current speed and direction were measured using a mini Sensor Data current meter, model SD-4. Current data were decomposed into longitudinal (U) and transversal (V) velocity components, positive U values pointing out outflow currents and negative ones inflow currents.
Total seston (TS) and organic seston (OS) were analyzed by the gravimetric method [15] after water filtration on board onto previously burned Whatman® GF/F filters, and conservation at –20˚C. Particulate organic carbon (POC) and nitrogen (NOP) samples were filtered onto precombusted WHATMAN GF/F filters and conserved in dark at –20˚C until laboratory analyze in a CHNanalyzer [16]. Phytoplankton biomass was estimated through Chlorophyll-a concentrations (Chl-a) [17], samples were filtered onto Whatman® GF/F filters and immediately stored in liquid nitrogen. Dissolved inorganic nutrients were analyzed from Whatman® GF/F filtered seawater according to [18] and [19]. For TEP analysis samples of 50 ml were fixed with buffered formaldehyde 4% and stored at 4˚C in dark. In 1 or 2 weeks, sub-samples of 15 mL - 30 mL were filtered onto polycarbonate Poretics® membrane (0.4 µm) using a constant filtration pressure (100 mm Hg). The samples were immediately stained with Alcian Blue (0.02% at pH 2.5) and the concentration of TEP was estimated following the spectrophotometric method of [20] by using the same Xantan Gum standard curve for all samples built on the same used reagent for each sampling period. Results were expressed as µg Xantan Gum equivalents/l (µg Xeq/L). TEP concentrations were also transformed from TEP (µg Xeq/L) to TEP-C (µg C/L) using the conversion factor of 0.75 introduced by [21].
Based on the assumption that both inlets are laterally homogeneous, time series of longitudinal velocity component, nutrients and seston concentrations and phytoplankton biomass were used to estimate the transport of these properties.
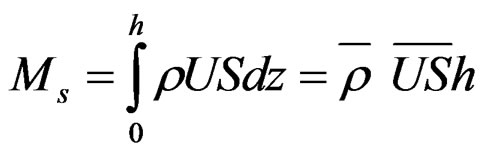
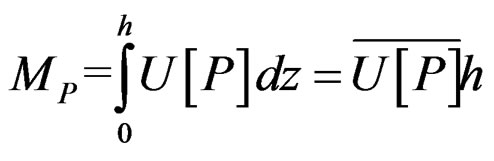
Instantaneous advective mass transport of salinity (Ms; kg/m·s) and other studied properties (Mp; “Propertyunity”/m·s) were calculated by the following expression:
 (1)
(1)
 (2)
(2)
where U is the longitudinal component of current velocity (U > 0 flow down estuary, in m/s),  is the density, S is salinity, h is depth and [P] is concentration of the property P.
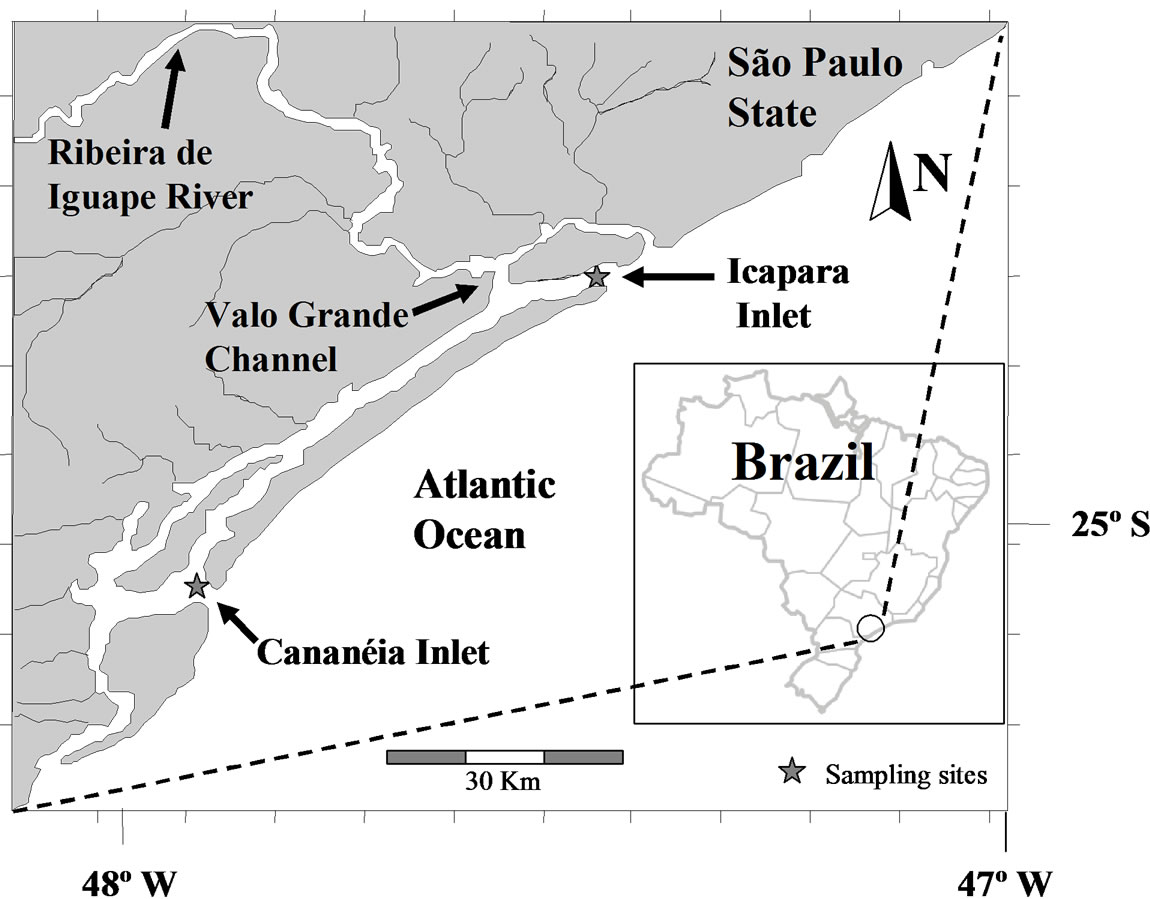
Figure 1. Estuarine-Lagoon System of Cananéia-Iguape (ELSCI) and the location of study sites: Cananéia and Icapara inlets in Sao Paulo State, Brazil.
Transport balance of salinity and of the property (Tp) was calculated by the following expression:
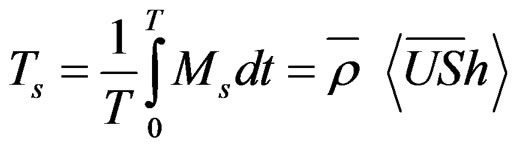
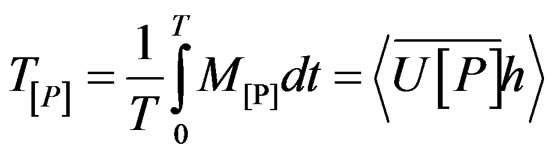
Positive transport values indicate net exportation from estuary; and negative ones, net importation to the estuary. Flux rates of each property were determined by multiplying P and U for each depth.
2.3. Statistical Analysis
Except for salinity and temperature, all data were Logtransformed to obtain a normal distribution. Tests for Normality (The Shapiro-Wilks test) and Goodness-of-Fit Tests, using Statgraphics Plus® v.3.1 software, confirmed a normal distribution for all transformed data series. Correlation coefficient of Log (TEP) and the different properties for each matrix were developed using STATISTEP and other properties. Correlation coefficient of the horizontal fluxes of TEP, OSM and Chl.a were also developed.
3. Results
3.1. Variables Distribution
In the southern inlet, inflow movements (mean negative values) were predominant in both dry and rainy seasons (Table 1) due to the barotropic component. In the northern inlet outflow movements were usually registered, due to freshwater discharge dominance. Water temperature was higher in the rainy season (between 24.8 and 27.1˚C) than in the dry season (between 19.1˚C and 20.7˚C) in both inlets (Table 1). Mean salinity values were similar during the dry and rainy surveys in the southern inlet (means between 28.8 and 26.2) with lower mean value registered at the neap tide conditions during the rainy season. In the northern inlet, mean salinities were almost the same (from 27.5 to 27.9) during dry season, but during the rainy season, a wide range was observed, between 13.6 and 23.7, with a minimum of 1.2. Concentrations of TS and OS increased during the rainy season in both inlets (Table 1). Mean TS varied between 57.7 mg/L - 80.1 mg/L to 78.3 mg/L - 215.0 mg/L during dry and rainy season respectively. Maxima TS (1.12 mg/L) and OS (1.05 mg/L) concentrations were observed in the northern inlet.
TEP concentrations were up to 10 fold higher during the rainy season in both inlets, when mean concentrations from 135.9 µg Xeq/L to 1199 µg Xeq/L were observed (see Table 1). Maximum TEP concentration (4990 µg Xeq/L) was observed in Icapara Inlet. By converting these results in carbon, mean concentrations from 0.01 mg C/L - 0.03 mg C/L (dry season) to 0.10 mg C/L to 0.90 mg C/L (rainy season), with a maximum value of 3.74 mg C/L were observed. So, TEP-C represented in average between 0.61% and 46.77 % of COP during dry and rainy season, respectively. Maximum TEP-C:POC percentage of ≈100% was observed in Icapara, northern inlet.

Table 1. Mean of longitudinal current velocity (u), temperature (T), salinity (S), total suspended matter (TSM), organic suspended matter (OSM), chorophyll-a (Chl.a), TEP and TEP-C (transformed in carbon according to Engel and Passow, 2001) for Cananéia and Icapara inlets at spring and neap tides, during July 2001 and January 2002. Mean (±SD) for both inlets are also presented for each variable.
TEP was negatively correlated with salinity in the northern inlet pointing out its inner origin under freshwater environment. Otherwise, no correlation was observed in the southern inlet (as show in Table 2). As the south area has low freshwater input, TEP generation should occur under higher salinities. Similar trend was observed between TEP and pH. TEP were always positively correlated with temperature, in both inlets, since high concentrations were observed during the rainy season (summer). TEP concentrations were also positively correlated with seston concentration in both inlets, due to the increase of seston during the rainy season. Only one positively significant correlation with Chl.a was observed, at the southern inlet.
3.2. Flux and Net Transport Rates
Figures 2-3 show the pattern of instantaneous exchanges between estuary and the adjacent coast for the different variables: salt flux rates, for both inlets, were well related with tidal variation, with inflow (negative values) during the flood tide periods and outflow during the ebb tides. Horizontal fluxes of OS, Chl.a and TEP showed higher flux rates during the rainy season, especially at neap tide conditions. Except for the neap tide during the rainy season in the northern inlet, higher inflow OS fluxes were observed in bottom waters, associated to flood tide periods. Higher outflow fluxes were registered near surface during the ebb tide periods. Chl.a and TEP fluxes followed the distribution pattern of the salinity flux in both inlets. In fact, despite of TEP concentrations were negatively correlated with salinity, TEP horizontal flux rates were positively correlated with salt ones. TEP fluxes were also positively correlated with organic suspended matter and phytoplankton biomass fluxes (Figures 2-3, and Table 3). In general, higher correlations coefficients were observed with Chl.a than with OS, except during the dry season in the northern inlet. In the southern inlet, inwellig flux rates of TEP were predominant and higher flux rates were observed associated both to surface and bottom waters (maximum of –0.3 g TEP-C/m·s). In the northern inlet, flux rates were higher than in southern one, especially during the rainy season, and maxima flux rates (up to 1.4 g TEP-C/m·s) were registered only at surface.
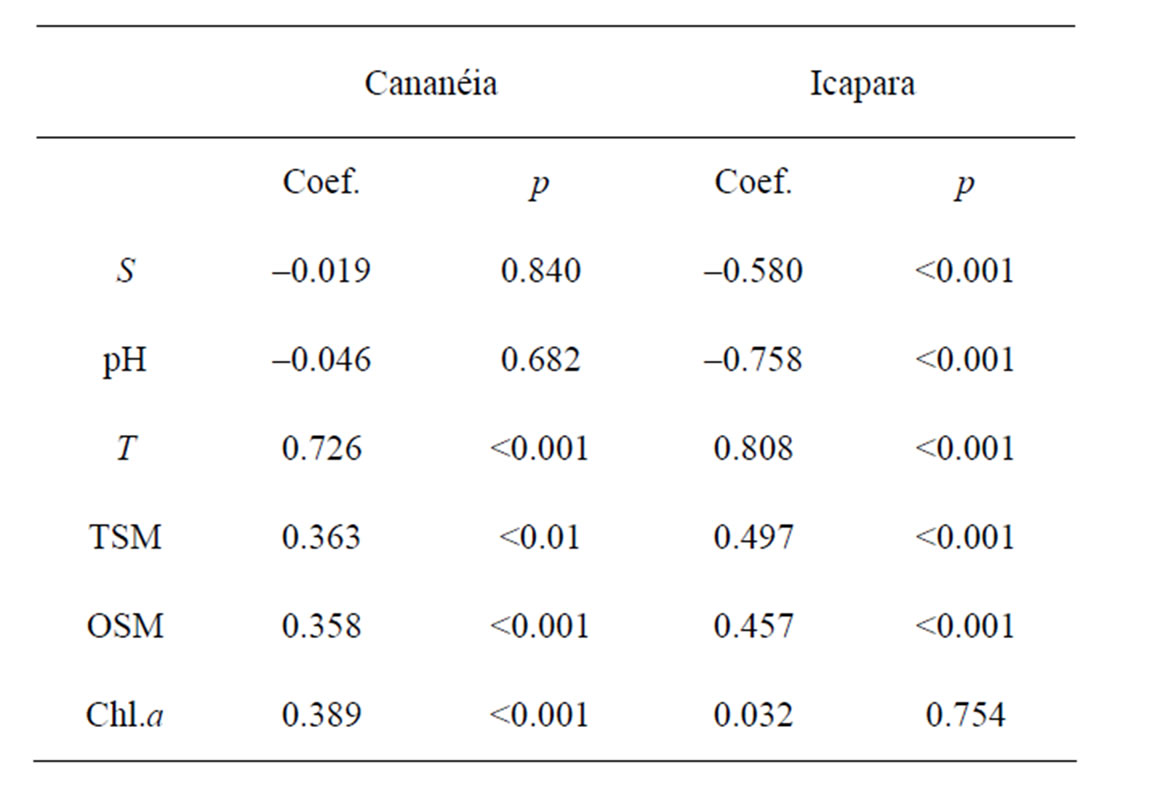
Table 2. Pearson correlation coefficient between TEP and different variables. Except for S and T all variables are log-transformed.
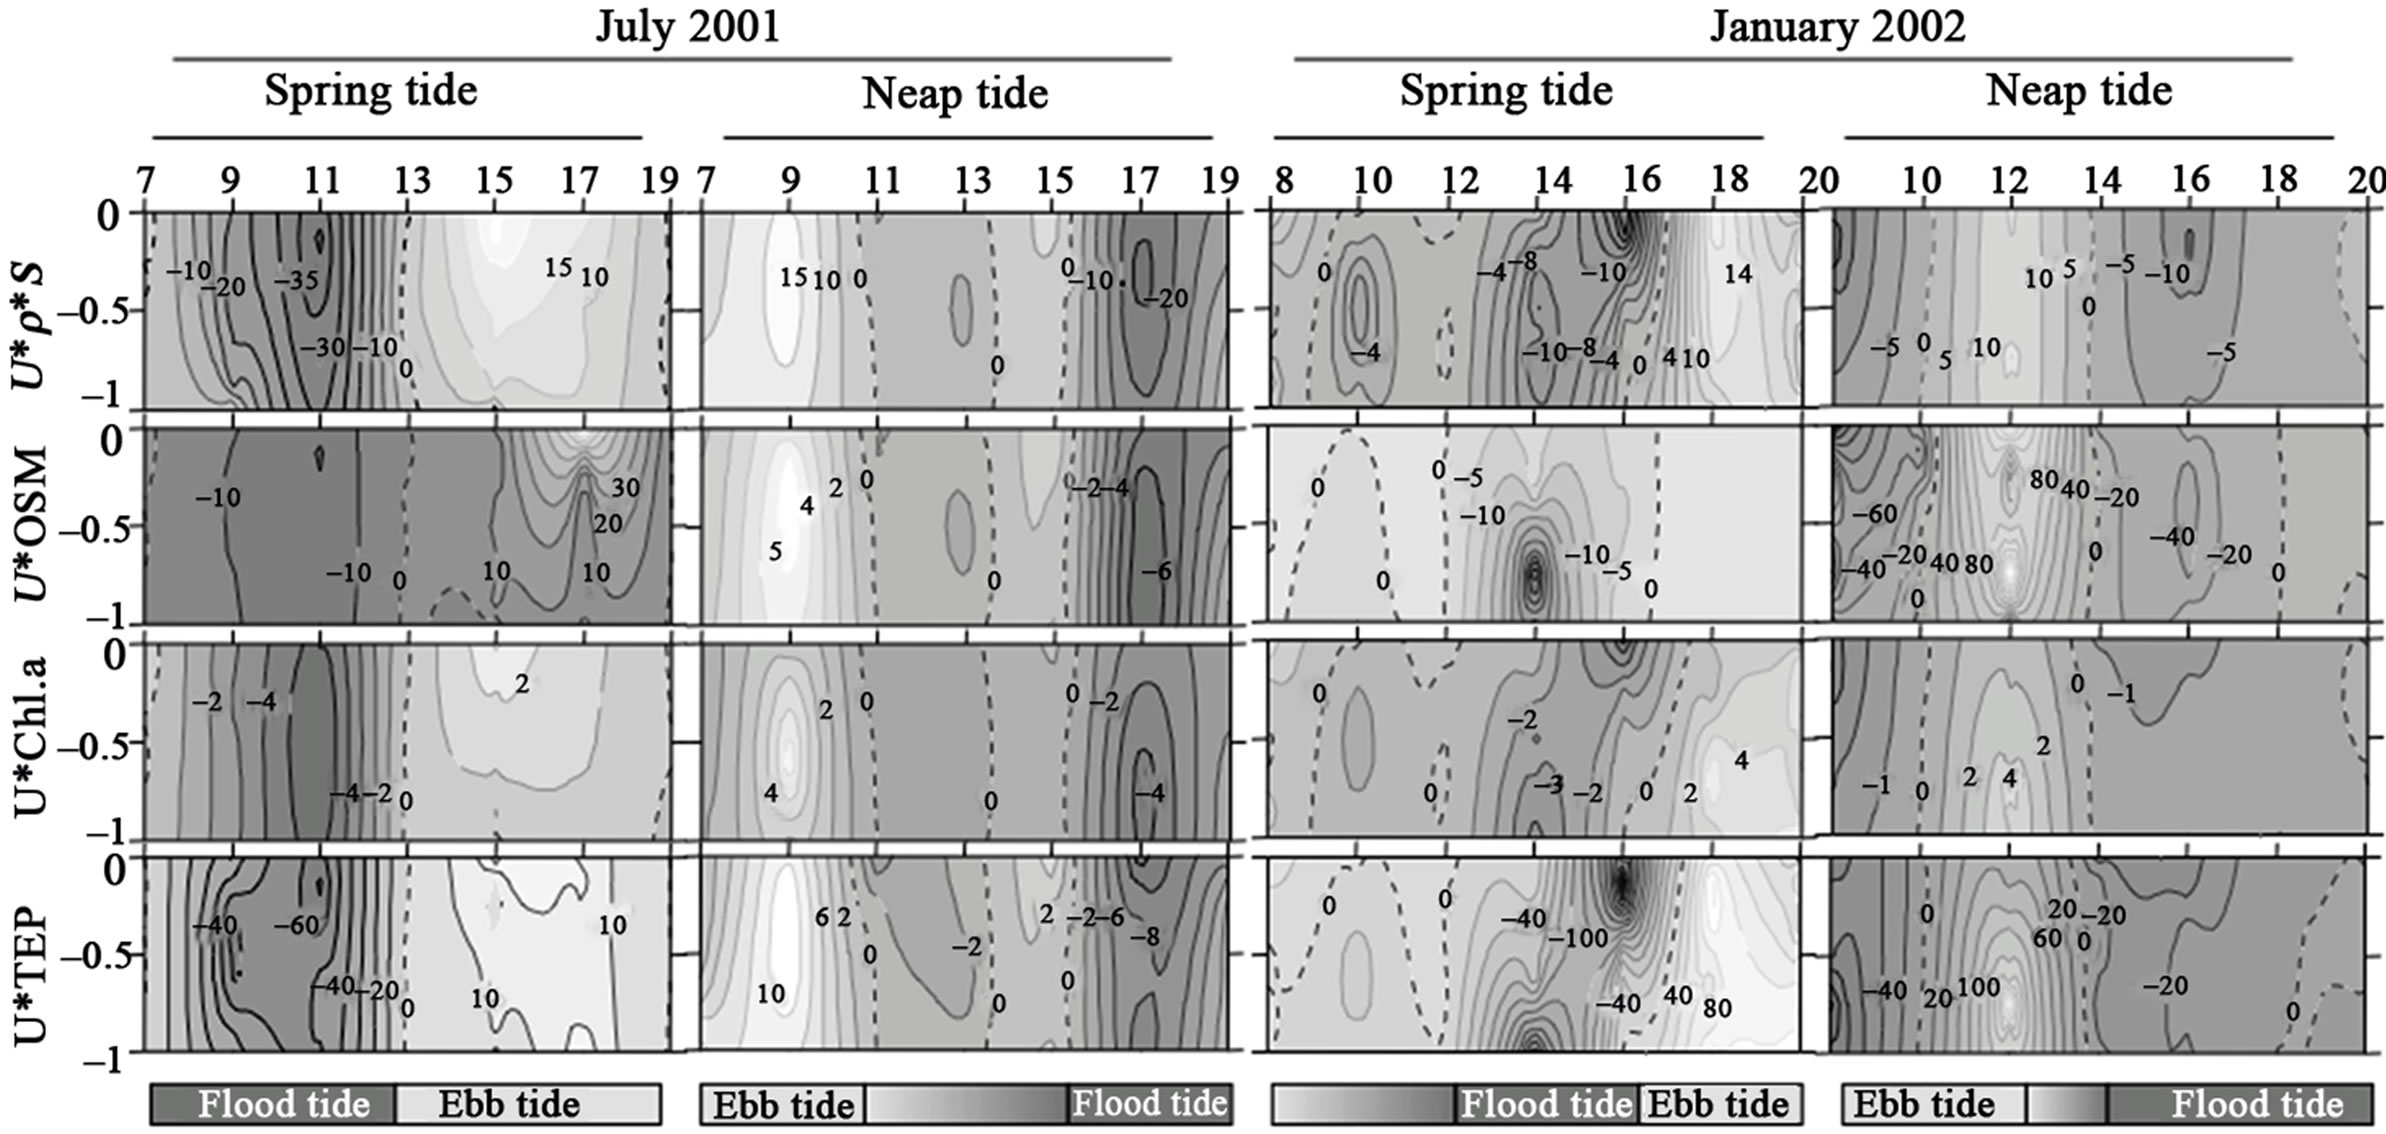
Figure 2. Temporal series of flux rates of salinity (u * ρ * S), Organic Suspended Matter (u * OSM), Chlorophyll a (u * Chl.a), and Transparent Exopolymer Particles (u * TEP) at Cananeia Inlet. Left vertical axis represent adimentional depth. Positive values (light-grey) indicate outflow (Ebb tide) and negative values (dark-grey) inflow (Flood tide).
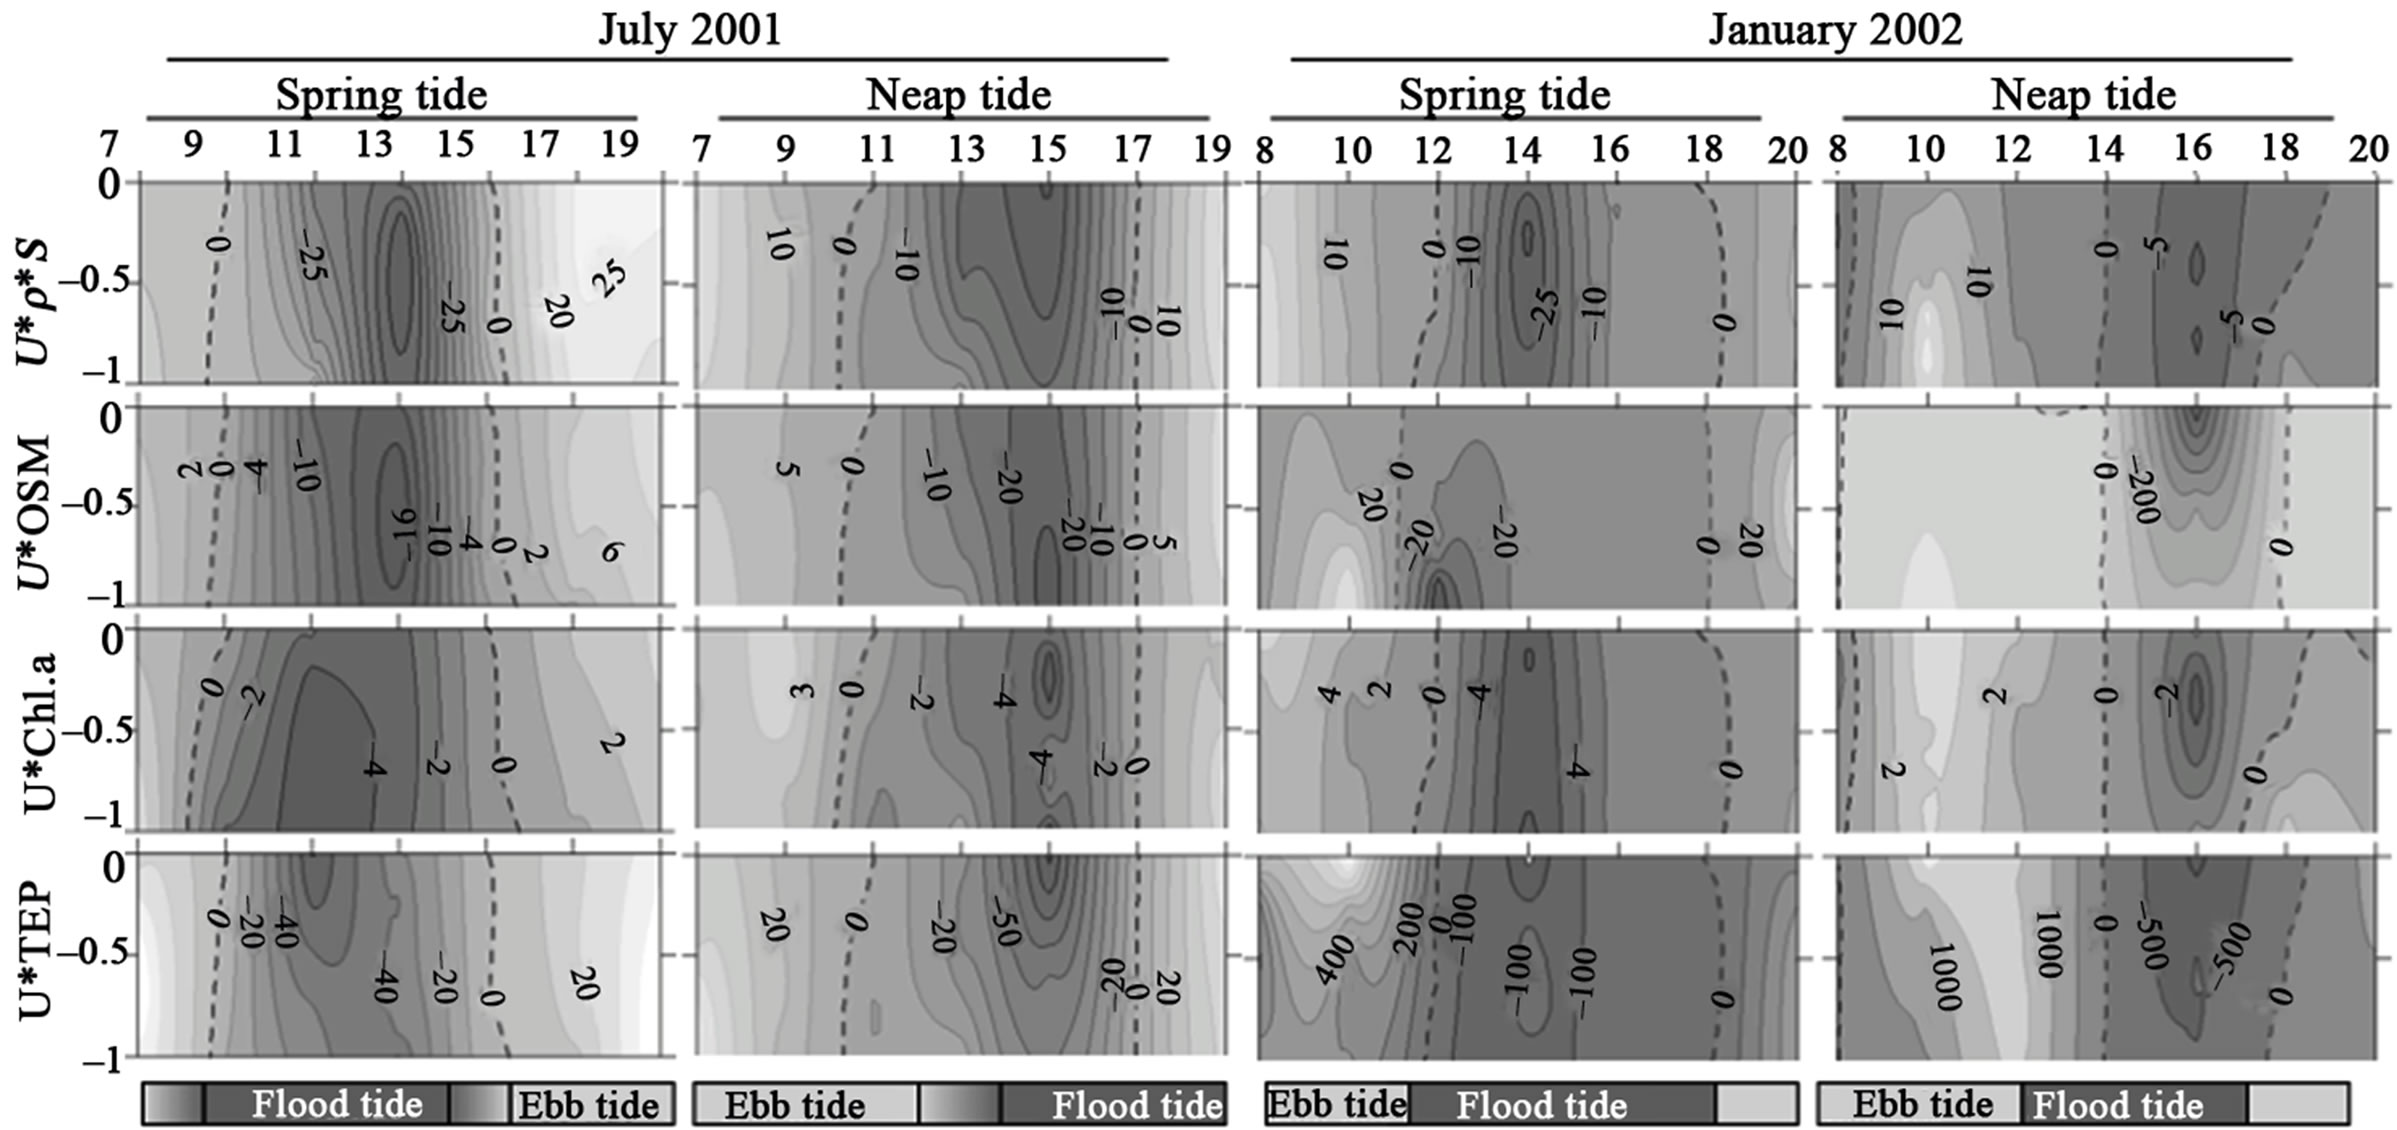
Figure 3. Temporal series of flux rates of salinity (u * ρ * S), Organic Suspended Matter (u * OSM), Chlorophyll a (u * Chl.a), and Transparent Exopolymer Particles (u * TEP) at Icapara Inlet. Left vertical axis represent adimentional depth. Positive values (light-grey) indicate outflow (Ebb tide) and negative values (dark-grey) inflow (Flood tide).
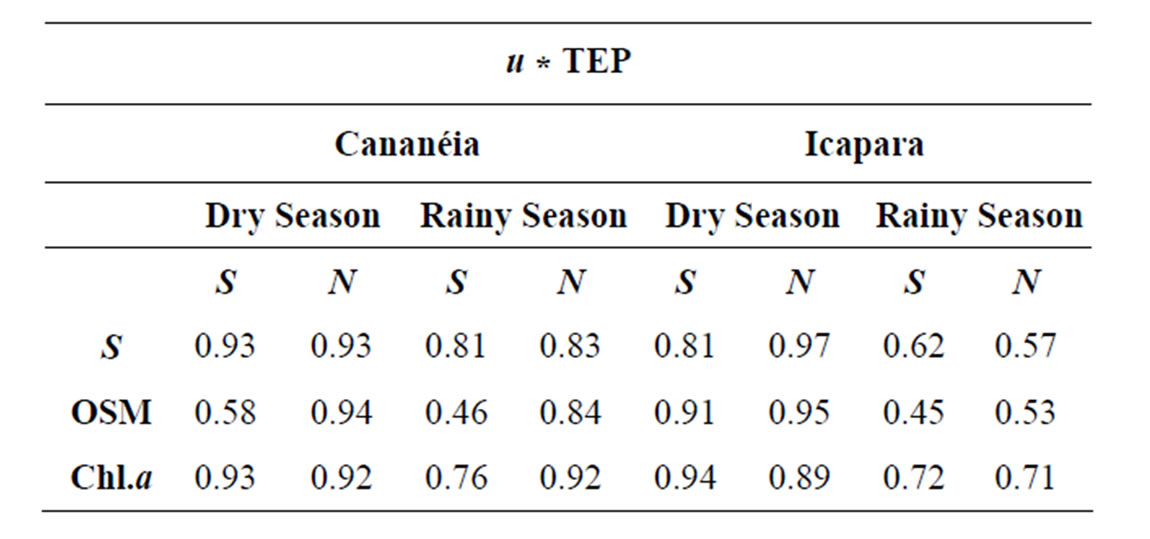
Table 3. Pearson correlation coefficient between flux rates of TEP and flux rates of S (u * dens * S) , OSM (u * OSM) and Chl.a (u * Chl.a) (N = 77; p < 0.001 for all situations: S—Spring; N—Neap).
Net transport rates of salt in the southern inlet were predominantly negative (–47.2 kg/m·s to 2.3 kg/m·s), pointing out that inwelling processes controled the dynamic of this region (Table 4). In the northern inlet inwelling of salt was observed in almost all studied situations, except at neap tide period during the rainy season, when outwelling processes were significant (12.5 kg/m·s). However, in spite of the horizontal fluxes of organic particulate matter followed similar pattern of the salt flux, net transport of OS not always had the same orientation of salt trasport. So, inwelling of OS was observed when salt transport showed outwelling predominance, and vice-versa. This phenomenum may be ascribed to the horizontal flux representations (Figures 2-3). Maxima inflow fluxes of OS were usually related to bottom water movements, which can suspend the sediments during flood tides. These sediments can remain at the water column by mixing processes and during the next ebb tide period can be outwelled. So, sometimes, net transport rates in estuarine mouths can reflect not only inwelling/outwelling dynamic, but also re-suspension and re-alocation of sediments. Net transport of OSM usually was higher in the northern (–305.9 g/m·s) than in the southern inlet (–73.0 g/m·s), and always during rainy than during dry season, in both sites. Chl.a showed higher net transport rates in the southern inlet during the dry season (–7.3 mg/m·s), and higher in the northern one during the rainy season (–29.9 mg/m·s) (Table 4). OSM and Chl.a net transport rates indicate that importation or retention of theses variables predominated in both inlets.
In terms of carbon dynamic, net transport rate of TEP as high as 1.36 g TEP-C/m·s was observed in this region (Table 4). Net TEP importation rates from –8.35 to –83.85 mg TEP-C/m·s were registered in the dry season. During the rainy season, net exportation of TEP was dominant only in the northern inlet. Transport rates of TEP during this season were up to one order of magnitude higher than during the dry one, with a net importation/exportation balance of –1.00/0.07 g TEP-C/m·s for the southern one .and only net exportation rates from 0.39 g to 1.36 g TEP-C/m·s for the northern inlet.
In terms of particulate matter dynamic, TEP flux rates represented 0.1% - 15.2% of OSM transport, with higher contribution during the rainy season in the northern inlet. In relation with phytoplankton biomass dynamic, the ratio TEP/Chl.a flux rates varied from <1.0 to 800 in southern one, and from 1.2 to >9000 in Icapara, with higher ratios during the rainy season in both inlets.
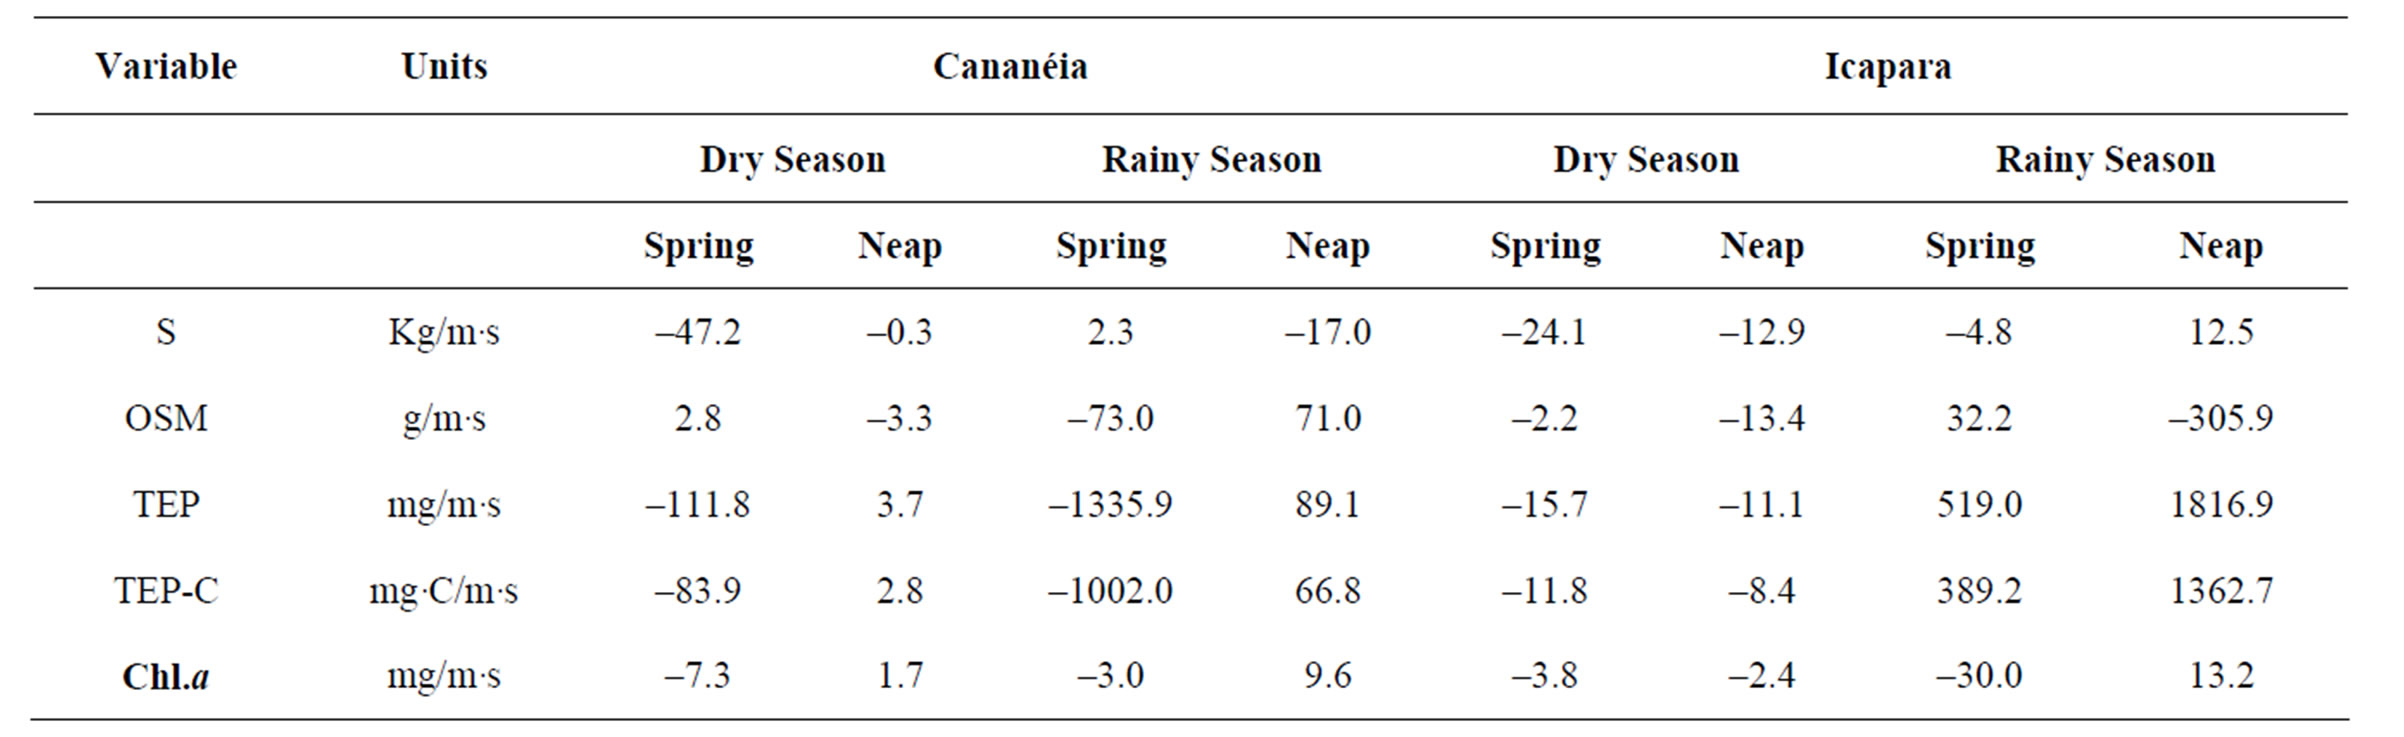
Table 4. Transport rate of salt, OSM, TEP and Chl.a.
If both inlets are considered as the unique communication ways between the estuarine system and the coastal region, and unidirectional fluxes are assumed to freshwater inputs, the total net balance between the estuary and the coastal waters can be calculate from the sum of the net transport rates for each situation. In Table 5 these net balances are represented. Results showed that the system imports or retains salt and organic seston in all studied situations. Phytoplankton biomass, represented by chlorophyll-a, and exopolymers were also imported or retained in almost 1 of our 4 observations, during the neap tide period in January 2002.
4. Discussion
The study of TEPs has been focused from different point of view since these particles were discovered. From freshwater to open ocean, and from temperate to Antarctic environments studies showed that TEP are very important in phytoplankton ecology. In this paper we attempted to identify the role of TEP in advective transport of particulate matter in estuarine systems.
It is accepted that these extracellular products are copiously released by phytoplankton during exponential growth phases or phytoplankton blooms [22], but also related to environmental growth conditions [1,23] like osmotic stress. In addition, excretion of extracellular products, like exopolymers, is also usual for a wide variety of plants, animals and microbes [1], in a wide variety of aquatic environments. So, it is expected that in estuarine systems TEP concentrations would be high, since these ecosystems present a wide variety of possible exopolymer sources and physical stress conditions. In this sense, TEP concentrations in the present study showed that estuaries can be a significant source of carbon like polymers to coastal region. In fact, the concentrations of TEP found here, up to 4990 µg Xeq·L–1, are higher than those observed in most of aquatic environments around the world presented by [1]. As pointed out by our results, these concentrations represented up to 15.24% of suspended
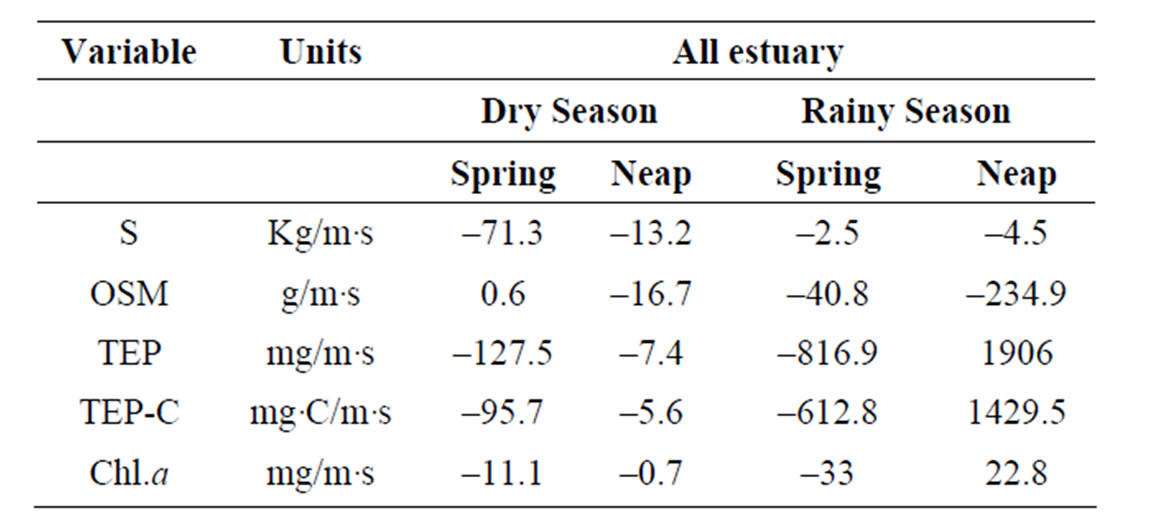
Table 5. Net balances of salt, OSM, TEP and Chl.a.
organic matter. In addiction, horizontal transport rates of TEP between estuary and coastal region were also significant, as high as 1.3 g TEP-C m–1·s–1, or 118 Kg TEP-C m–1·d–1 if a net complete cycle of 24 h is considered. In terms of organic particulate, these values indicate that TEP can contribute roughly 15% to the OSM horizontal flux, from a quantitative point of view. In the other hand, it is hard to determine the qualitative contribution of exopolymers to organic suspended matter dynamic in estuary. The positive correlation between flux rates of TEP and OSM, and the relationships between the time series distributions of both variables shows that TEP could have contributed to organic matter dynamic.
Different studies have demonstrated that TEP greatly affects particle dynamics in aquatic systems in terms of vertical fluxes [8]. Factors determining sinking velocities of aggregates include size, dry weight, porosity, and excess density of aggregates [24,25], as well as density gradients in the water [26] turbulence [23] and pH [27]. Since, estuaries are systems characterized by high-density gradients due to interaction between marine and fresh waters, and usually present high turbulence levels. It is expected that density of aggregates will be an important factor in particle dynamics, and their presence in one of the water masses, marine or freshwater, can determine if they are imported or exported from the estuary. The density of aggregates is a function of the presence of gas enclosures [28], the density of the enclosed solid matter [29,30] and the proportion of TEP in it [3]. So, the presence of TEP in aggregates is a fundamental factor to their density and to their dynamic in estuaries, as can be observed in the present paper.
In terms of phytoplanktonic biomass, the high positive correlation between TEP and Chl.a fluxes pointing out that exopolymers have also a significant role on horizontal advective transport of phytoplankton in estuaries. Aggregation driven by TEP is considered as responsible of sedimentation of phytoplankton blooms, since simultaneous sedimentation of TEP and diatoms have been observed in different studies [4,31-33]. Our results suggest that TEP can be also responsible by advective transport of phytoplankton in estuarine systems affecting their sinking velocities, their position in the water column and their inflow/outflow dynamic.
5. Conclusions
The present study showed that TEP transport rates are important in estuarine systems, contributing significantly to organic matter exchange between estuaries and coastal areas (about 15%). The main source of these exopolymers particles seems to be in the inner region of the estuarine system, probably in the density front between marine and freshwater, where high concentration of dissolved and particulate matter are registered. In this region, it is also expected a high exopolymer release due to high osmotic stress, contributing to increase the TEP-precursors densities. The positive correlation between TEP and OSM and Chl.a horizontal fluxes suggest also that TEP affects the organic matter and phytoplankton dynamics in estuarine systems.
6. Acknowledgements
We thank many people involved in this work for their valuable help during sampling. The work was supported by FAPESP (Fundação de Amparo à Pesquisa do Estado de São Paulo) through grant 2000/07162-6 and a fellowship to Barrera-Alba from the Agencia Española de Cooperación Internacional (AECI).
REFERENCES
- U. Passow, “Transparent Exopolymer Particles (TEP) in Aquatic Environments,” Progress in Oceanography, Vol. 55, No. 3-4, 2002, pp. 287-333. doi:10.1016/S0079-6611(02)00138-6
- U. Passow, W. Kozlowski and M. Vernet, “Distribution of Transparent Exopolymer Particles (TEP) during Summer at a Permanent Station in Antarctica,” Antarctic Journal of the United States, Vol. 30, 1995, pp. 265-266.
- K. Azetsu-Scott and U. Passow, “Ascending Marine Particles: Significance of Transparent Exopolymer Particles (TEP) in the Upper Ocean,” Limnology and Oceanography, Vol. 49, No. 3, 2004, pp. 741-748. doi:10.4319/lo.2004.49.3.0741
- U. Passow, R. F. Shipe, A. Murray, D. K. Pak, M. A. Brzezinski and A. L. Alldredge, “Origin of Transparent Exopolymer Particles (TEP) and Their Role in the Sedimentation of Particulate Matter,” Continental Shelf Research, Vol. 21, No. 4, 2001, pp. 327-346. doi:10.1016/S0278-4343(00)00101-1
- T. Tanaka, T. F. Thingstad, et al., “Availability of Phosphate for Phytoplankton and Bacteria and of Glucose for Bacteria at Different pCO2 Levels in a Mesocosm Study,” Biogeosciences, Vol. 5, 2008, pp. 669-678. doi:10.5194/bg-5-669-2008
- M. Allgaier, U. Riebesell, et al., “Coupling of Heterotrophic Bacteria to Phytoplankton Bloom Development at Different pCO2 Levels: A Mesocosm Study,” Biogeosciences, Vol. 5, 2008, pp. 1007-1022. doi:10.5194/bg-5-1007-2008
- S. Beauvais, M. L. Pedrotti, E. Villa and R. Lemée, “Transparent Exopolymer Particle (TEP) Dynamics in Relation to Trophic and Hydrological Conditions in the NW Mediterranean Sea,” Marine Ecology Progress Series, Vol. 262, 2003, pp. 97-109. doi:10.3354/meps262097
- I. De Vicenti, E. Ortega-Retuerta, O. Romera, R. Morales-Baquero and I. Reche, “Contribution of Transparent Exopolymer Particles to Carbon Sinking Flux in an Oligotrophic Reservoir,” Biogeochemistry, Vol. 96, No. 1-3, 2009, pp. 13-23.
- G. A. Jackson, A. M. Waite and P. W. Boyd, “Role of Algal Aggregation in Vertical Carbon Export during SOIREE and in Other Low Biomass Environments,” Geophysical Research Letters, Vol. 32, 2005, L13607.
- A. Engel, “The Role of Transparent Exopolymer Particles (TEP) in the Increase in Apparent Particle Stickiness (Alpha) during the Decline of a Diatom Bloom,” Journal of Plankton Research, Vol. 22, No. 3, 2000, pp. 485-497.
- T. Radic, I. Ivancic, D. Fuks and J. Radic, “Marine Bacterioplankton Production of Polysaccharidic and Proteinaceous Particles under Different Nutrient Regimes,” FEMS Microbiological Ecology, Vol. 58, No. 3, 2006, pp. 333-342.
- E. Bar-Zeev, I. Berman-Frank, et al., “Transparent Exopolymer Particles (TEP) Link Phytoplankton and Bacterial Production in the Gulf of Aqaba,” Aquatic Microbial Ecology, Vol. 56, No. 2-3, 2009, pp. 217-225. doi:10.3354/ame01322
- DAEE (Department of Water and Electric Energy), “Contribuições Superficiais dos rios que Deságuam No Sistema Estuarino de Iguape-Cananéia (Mar Pequeno, Mar de Cubatão e Baía do Trapandé),” Diretoria da Bacia do Ribeira e Litoral Sul/DAEE, OF/B.R.B./053/87, 1987.
- A. L. Bérgamo, “Características da Hidrografia, Circulação e Transporte de sal: Barra de Cananéia, Sul do Mar de Cananéia e Baía de Trapandé. São Paulo: Instituto Oceanográfico—Universidade de São Paulo,” Dissertação de mestrado em Oceanografia Física, 2000.
- APHA (American Public Health Association, Inc.), “Standard Methods for the Examination of Water and Wastewater,” 16th Edition, US Government Printing Office, Washington DC, 1985.
- D. C. Gordon Jr., “Examination of Methods of Particulate Organic Carbon Analysis,” Deep-Sea Research, Vol. 16, 1969, pp. 661-665.
- S. W. Jeffrey and G. F. Humphrey, “New Espectrofotometric Equations for Determining Chlorophylls a, b, c1 and c2 in Higher Plants, Algal and Natural Phytoplankton,” Bhiochemie und Physiologie der Pflanzen, Vol. 167, 1975, pp. 191-194.
- A. Aminot and M. Chaussepied, “Manuel des Analyses Chimiques en Milieu Marin,” CNEXO, Brest, 1983.
- K. Grasshoff, M. Ehrhardt and K. Kremling, “Methods of Seawater Analysis,” 2nd Edition, Verlag Chemie, Wienhien, 1983.
- U. Passow and A. L. Alldredge, “A Dye-Binding Assay for the Spectrophotometric Measurement of Transparent Exopolymer Particles (TEP),” Limnology and Oceanography, Vol. 40, No. 7, 1995, pp. 1326-1335. doi:10.4319/lo.1995.40.7.1326
- A. Engel and U. Passow, “Carbon and Nitrogen Content of Transparent Exopolymer Particles (TEP) in Relation to Their Alcian Blue Adsorption,” Marine Ecology Progress Series, Vol. 219, 2001, pp. 1-10. doi:10.3354/meps219001
- U. Passow, “Production of TEP by Phytoplankton and Bacteria,” Journal of Phycology, Vol. 236, 2002, pp. 1- 12.
- S. Beauvais, M. L. Pedrotti, et al., “Effects of Turbulence on TEP Dynamics under Contrasting Nutrient Conditions: Implications for Aggregation and Sedimentation Processes,” Marine Ecology Progress Series, Vol. 323, 2006, pp. 47-57. doi:10.3354/meps323047
- A. L. Alldredge and C. C. Gotschalk, “In Situ Settling Behavior of Marine Snow,” Limnology and Oceanography, Vol. 33, No. 3, 1988, pp. 339-351. doi:10.4319/lo.1988.33.3.0339
- C. L. De La Rocha and U. Passow, “Factors Influencing the Sinking of POC and the Efficiency of the Biological Carbon Pump,” Deep Sea Research Part II, Vol. 54, No. 5-7, 2007, pp. 639-658.
- A. L. Alldredge and K. M. Crocker, “Why Do Sinking Mucilage Aggregates Accumulate in the Water Column?” The Science of Total Environment, Vol. 165, No. 1-3, 1995, pp. 15-22. doi:10.1016/0048-9697(95)04539-D
- X. Mari, “Does Ocean Acidification Induce an Upward Flux of Marine Aggregates?” Biogeosciences, Vol. 5, 2008, pp. 1023-1031. doi:10.5194/bg-5-1023-2008
- U. Riebesell and D. A. Wolf-Gladrow, “The Relationship between Physical Aggregation of Phytoplankton and Particle Flux: A Numerical Model,” Deep-Sea Research I, Vol. 39, No. 7-8, 1992, pp. 1085-1102. doi:10.1016/0198-0149(92)90058-2
- V. L. Asper, “Measuring the Flux and Sinking Speed of Marine Snow Aggregates,” Deep-Sea Research I, Vol. 34, No. 1, 1987, pp. 1-17. doi:10.1016/0198-0149(87)90117-8
- K. Azetsu-Scott and B. D. Johnson, “Time Series of the Vertical Distribution of Particles during a Spring Phytoplankton Bloom in a Coastal Basin,” Continental Shelf Research, Vol. 14, No. 6, 1994, pp. 687-705. doi:10.1016/0278-4343(94)90113-9
- K. M. Crocker and U. Passow, “Differential Aggregation of Diatoms,” Marine Ecology Progress Series, Vol. 117, No. 1-3, 1995, pp. 249-257. doi:10.3354/meps117249
- B. E. Logan, U. Passow, A. L. Alldredge, H.-P. Grossart and M. Simon, “Rapid Formation and Sedimentation of Large Aggregates Is Predictable from Coagulation Rates (Half-Lives) of Transparent Exopolymer Particles (TEP),” Deep Sea Research Part II: Topical Studies in Oceanography, Vol. 42, No. 1, 1995, pp. 203-214. doi:10.1016/0967-0645(95)00012-F
- H. P. Grossart and M. Simon, “Formation of Macroscopic Organic Aggregates (Lake Snow) in a Large Lake: The Significance of Transparent Exopolymer Particles, Phytoplankton, and Zooplankton,” Limnology and Oceanography, Vol. 42, No. 8, 1997, pp. 1651-1659. doi:10.4319/lo.1997.42.8.1651