World Journal of Neuroscience
Vol.2 No.2(2012), Article ID:19417,4 pages DOI:10.4236/wjns.2012.22012
Stimulating brain tissue with bright light alters functional connectivity in brain at the resting state
![]()
1Department of Diagnostic Radiology, Oulu University Hospital, Oulu, Finland
2Department of Diagnostic Radiology, University of Oulu, Oulu, Finland
3Valkee Ltd., Oulunsalo, Finland
4Department of Biology, University of Oulu, Oulu, Finland
5Institute of Health Sciences (General Practise), University of Oulu, Oulu, Finland
6Department of Electrical and Information Engineering, University of Oulu, Oulu, Finland
7Oulu Deaconess Institute, Oulu, Finland
Email: tuomo.starck@oulu.fi
Received 14 February 2012; revised 8 March 2012; accepted 22 March 2012
Keywords: fMRI; Resting State; Functional Connectivity; Light; Opsin
ABSTRACT
Light is considered to modulate human brain function only via the retinal pathway, a way of thinking that we aimed to challenge in the present study. Literature provides evidence of inherent phototransduction for instance in the rat brain and there are potentially photosensitive opsin proteins like melanopsin and panopsin in the human brain too. In order to investigate a short term response, functional connectivity changes of the brain were studied in the resting state with functional magnetic resonance imaging during bright light stimulus via the ear canal. Lateral visual and sensorimotor networks showed increased functional connectivity in the light stimulus group compared to sham controls. The lateral visual network demonstrated slowly increasing functional connectivity on average and the same temporal characteristic was shared by diverse cerebellar brain regions. Hypothetical phototransduction signal pathways leading to responses in brain function are discussed as well as some observed effects and their possible link to the findings. Findings from this study together with the plausible photoreceptor candidates suggest that the brain possesses photosensitive properties, which will have interesting implications for the modulation of brain function and understanding the basic physiology of the brain.
1. INTRODUCTION
In most species light synchronizes various physiological and functional processes, which are largely governed by subcortical brain structures in vertebrates [1]. Examples of non-visual functions include an entrainment of circadian rhythm, pupillary light reflex, and alertness induced by light. In the eye, light information is captured by photosensitive opsin pigments for vision and non-visual functions but in many vertebrates, photoreception involving circadian regulation also occurs without the function of the eyes [2].
All vertebrate opsin pigments consist of an opsin protein bound to a photon absorbing chromophore [3] and depending on the opsin, its photoisomerization results in depolarizing or hyperpolarizing electrical responses and activation of signalling pathways. Known photoreceptors in the human eye are rhodopsin, cone opsin and the relatively recently discovered melanopsin [4], which is the most influential photoreceptor for non-visual functions [1] and has a varying temporal response to light stimuli depending on the stimulus intensity [4]. In general there are numerous opsins divided into seven subfamilies [5] that are expressed in diverse tissues of vertebrates, not only in the eye. In the gene expression studies, opsins called panopsin (a.k.a. encephalopsin) [6] and neuropsin [7,8] have been detected in the human brain and retina but their function remains unknown, although in birds neuropsin is a deep brain photoreceptor [9]. Panopsin protein expression has recently been observed in substantia nigra neurons by White et al. [10]. Furthermore, the BrainSpan human brain atlas [11] describes the mRNA level gene expression of melanopsin and other opsins in the human brain. To confirm the opsin protein gene expression results, panopsin expression was studied with protein level measurements and microscopy in the mouse [12] (unpublished) and in the human brain [13] (unpublished). Results demonstrate abundance of panopsin in both mouse and human brain.
The effect of light on diverse tissues has been of interest for a long time and there is a study demonstrating that rat brain slices respond to ambient visible light by increasing the release of the inhibitory neurotransmitter gammaaminobutyric acid (GABA) [14]. Light intensity in that study corresponded to about the conditions inside the head under natural illumination circumstances. Furthermore, a patch-clamp study with rat cortical neurons has demonstrated enhanced N-methyl-D-aspartate (NMDA) receptor-mediated currents [15] after strong visible light (>385 nm) stimulation. Furthermore a recent study [16] showed an intracellular calsium (Ca2+) mobilization in cultured mouse retinal ganglion cells under exposure of 20,000 lux visible light (>400 nm). Altogether these publications may be indicators of phototransduction cascades in mammals other than the known retinal light responses mediated by cone opsins, rhodopsin or melanopsin.
Based on potential photosensitivity of the brain tissue and bright light as a treatment for seasonal affective disorder (SAD) [17] prevalent at high and low latitudes during winter, an idea emerged that SAD could be treated by directing intensive light straight to the brain in an extra-ocular manner. Photosensitivity of the brain tissue could well be functionally relevant in natural conditions as bright light has been shown to penetrate through the skull to reach the brain in mammals such as dogs and sheep [18]. The main absorbers of visible light are haemoglobin and skin melanin [19] while bone structures and many types of cells primarily scatter light [20]. The ear canal was found to be a suitable place for bright light application since light absorption before entering brain tissue is kept at a minimum due to the relative absence of skin melanocytes and the small amount of blood haemoglobin. The concept of bright light treatment via the ear canal has been studied for SAD with promising results [21] in pilot study and further in a randomized controlled trial [22] (unpublished).
Brain function can be examined for example using blood oxygen level dependent (BOLD) functional magnetic resonance imaging (fMRI). Sources of BOLD contrast are blood flow, volume and oxygenation that arise from local increases in neuronal mass activity [23] although the exact mechanisms of this neurovascular coupling are not fully understood. BOLD signals between distant brain regions exhibit intrinsic functional connectivity [24] that seems to serve both stable and dynamic purposes [25]. Stable properties are related to functional integrity maintenance and dynamic properties are related to psychological phenotypes. We reasoned that resting state fMRI would be an adequate combination of spatial and temporal accuracy for examining constant light induced effects on functional connectivity. Often spontaneous function in fMRI is studied at a frequencies above 0.01 Hz, however, importantly for the present study there are fMRI studies showing BOLD drifts below 0.01 Hz to be neurophysiologically meaningful [26] and that baseline drifts can be induced by the administration of various drugs [27,28]. The method for functional connectivity analysis was chosen to be independent component analysis (ICA) combined with dual regression [29, 30], which has been shown to be an appropriate method for exploratory analyses [31]. ICA is used to decompose fMRI data into group-level components and following dual regression reveals the corresponding subject-level temporal and spatial manifestations.
Based on the theory and treatment of SAD patients with bright light via the ear canal, we hypothesized that non-visual bright light stimulation of the human brain via the ear-canal would alter brain activity within an fMRI scanning session. Our hypothesis was studied using resting-state BOLD fMRI without any assumptions of the spatial or temporal response patterns. Therefore, a datadriven functional connectivity analysis was performed on the full band data and on the whole brain. Additionally we tested whether an instant response to light stimulus would occur in a typical fMRI block paradigm measurement setting.
2. MATERIALS AND METHODS
2.1. Subjects
Written informed consent was obtained from the volunteers and the imaging was approved by the ethical committee of the Oulu University Hospital. Normal healthy adult volunteers aged 29 ± 6 years were told they will participate into a light stimulus study. The main study examining responses to constant light stimulus via the ear canal consisted of altogether 51 subjects who were scanned in three divisions. First, 10 subjects were scanned in December (after 4 pilot subjects), then 27 subjects in February and finally 14 subjects in May. All light stimulation imaging sessions took place in December and in February when it is remarkably dark in Oulu, Finland (65˚ northern latitude); sham control sessions were imaged during February and May. After exclusion of pilot data and one subject with failed light stimulation timing, 24 light stimulus and 26 sham controls were available for analysis. Additionally, 9 light stimulus subjects were scanned in March employing an fMRI block paradigm.
2.2. Stimulus
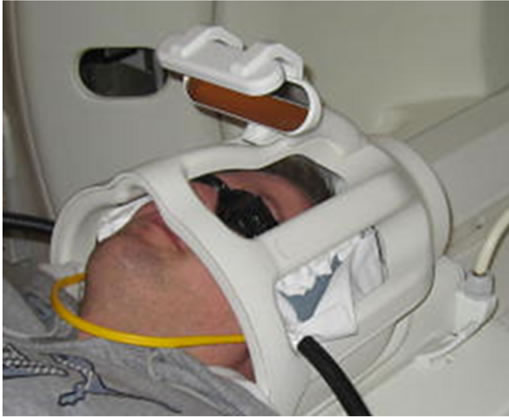
Bright light was exposed to the external ear canal with the aim to stimulate the brain tissue during BOLD fMRI scanning, while sight of the light stimulus was prevented (Figure 1(a)). Figure 1(b) depicts the brain regions situated close to the ear canal. Light was produced by two 3 W LEDs (main light spectrum peak at blue light 465 nm and a secondary peak at 550 nm) and delivered via 5 meters long polycarbonate colourless fiber optic light guides connected to ear-plugs in the subject’s ears while inside the scanner. The produced output luminous flux (circa 7 - 8 lumens) in the ear canal was of an order of magnitude comparable with sunlight intensity in the ear canal under bright sunny day conditions when directed towards the sun, according to our measurements. A 12 V power supply placed outside the scanner room was connected via a wave tube to the LEDs that were installed on a printed circuit board and contained in aluminium packaging situated inside the scanner room just next to the wave tube on the wall of the control room.
2.3. Functional MRI Data Acquisition
There were two fMRI study setups, the primary setup consisting of constant light stimulus during the imaging session and the second was used to check whether a response can be detected with a basic fMRI on-off blockdesign paradigm. The first scan of every session was a T1-weighted anatomical 3D FSPGR scan of about 3 min (FOV 24 cm with 256 × 256 matrix, slice thickness 1 mm, TR 12.1 ms, TE 5.2 ms, and flip angle 20 degrees).
 (a)
(a)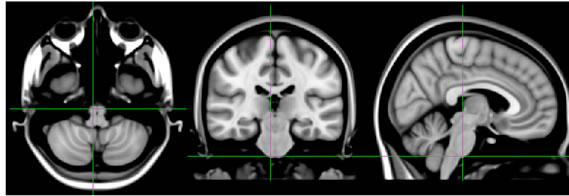 (b)
(b)
Figure 1. (a) Set-up for light stimulus and sham controls during scanning (person in the image is one of the authors); (b) Sections from MNI152 T1 standard space brain template illustrating the brain regions presumably encountering the main light cone beam.
 (a)
(a)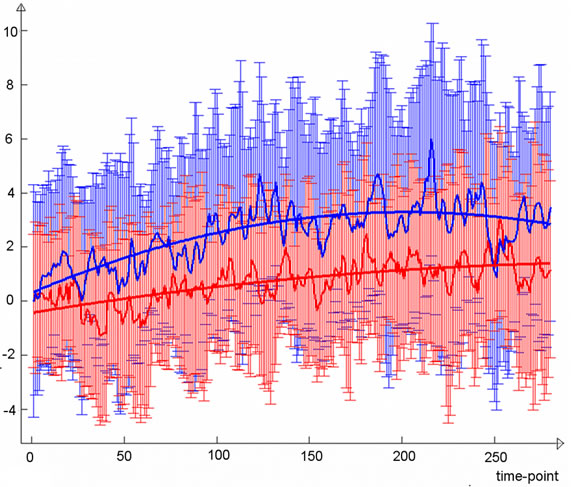 (b)
(b)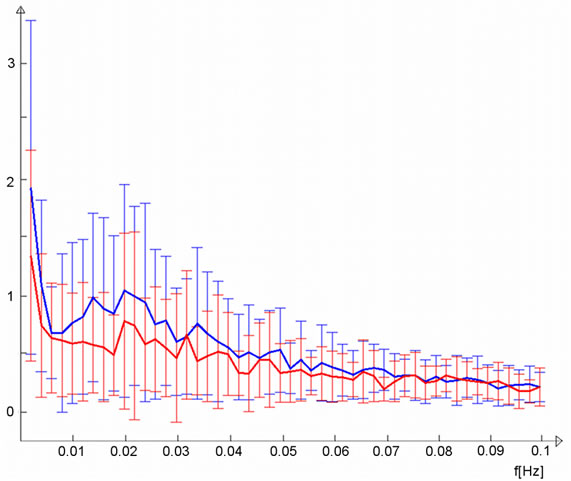 (c)
(c)
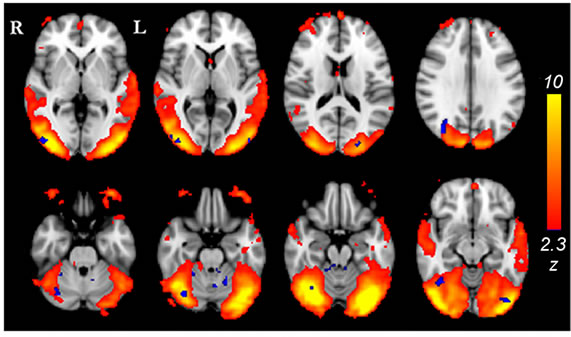
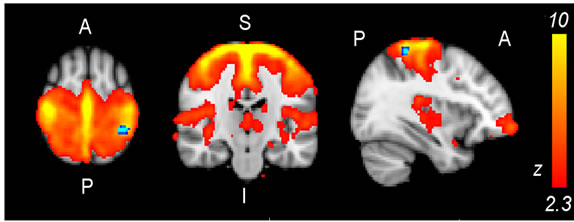
Figure 2. (a) Lateral visual IC (warm colors) demonstrated greater functional connectivity (p < 0.05, corrected) in the light stimulus group compared to controls (cold colors); (b) Group mean TCs and standard deviations for lateral visual IC of the light group (blue) and controls (red), TC units are demeaned values of spatial regression fit; (c) Corresponding frequency representation with group mean and standard deviation.
Scanning sessions with constant stimulus consisted of two consecutive resting-state scans with eyes properly covered (Figure 1(a)). In the beginning of each resting state scan the subject was instructed to stay still during the following scan. The first scan was always without light stimulus and it was used for achieving better scanner stability before the actual stimulus scan. During echoplanar imaging, the gradient coils warm up and cause marked signal drifts during the first five minutes of the scanning (data not shown). Thus, a valid comparison between the first and the second scan on the full frequency band was not possible. The first scan also worked as a control condition for transversal comparison between the groups. The second scan was light on for the light group and no light for controls. These consecutive BOLD fMRI scans (8 min 24 s each) without breaks were performed with the instruction for the subject to lay still. The scanner was GE 1.5T Signa HDx upgraded from a Signa LX system and equipped with an 8-channel head coil provided by the scanner manufacturer. The pulse sequence was GR-EPI, parallel imaging (image domain reconstruction) acceleration factor 2, 283 time-points (discarding the first three volumes), TR 1.8 s, TE 40 ms, flip angle 90 degrees, FOV 25.6 cm with 64 × 64 matrix giving 4 mm voxel in-plane, 4 mm thick slices with 0.4 mm inter-slice gap, 28 slices acquired in an interleaved manner.
The scanning parameters of the block-design setup were otherwise similar but the duration was 15 minutes, TR 2 s and 31 slices without a gap. Resting-state data were collected while alternating light on and off every 30 seconds. Light switching was operated manually while checking the timing from the stopwatch.
2.4. Functional MRI Data Analysis
Pre-processing was carried out using functions embedded into the Melodic ICA [32] tool in FSL 4.14. Head motion was corrected using multi-resolution rigid body co-registration of volumes [33]; middle volume was the reference. Motion estimates were inspected and one light group subject was excluded due to prominent drift. The amount of motion was statistically tested between the light group and sham controls by testing the absolute (reference to the middle time point) and relative (between consecutive time points) root-mean-square motion estimates in two-sample t-test in Matlab 7.3 (http://www.mathworks.com). Subsequently, slice timing correction and brain extraction was carried out for fMRI data in Melodic and brain extraction for structural data was performed separately using BET [34]. Every fMRI dataset was then intensity normalized by a single scaling factor (grand mean scaling) in order to make group level analyses valid. Multi-resolution affine co-registration [35] was used to co-register unsmoothed fMRI volumes to 3D FSPGR volumes of corresponding subjects, and 3D FSPGR volumes were co-registered to the MNI standard structural space template. With the resulting transformations the BOLD volumes were interpolated to the MNI standard space in 3 mm resolution. No spatial smoothing, in addition to smoothing introduced by the previous preprocessing steps, was applied since it may enhance the magnitude of low-frequency noise in BOLD fMRI [36,37] that could be detrimental to the full band analysis. Nuisance covariates like motion and physiological noise signals are modeled and regressed out in the following ICA dual regression scheme.
Time-concatenation group ICA was performed in order to obtain the spatial a priori maps for the functional connectivity analysis. ICA was calculated using highpass filtered data (cut-off period 150 s) since the aim was to investigate functional connectivity networks obtained from the typical resting state frequency band, free from scanner drifts. Dimensionality of ICA decomposition was set to 30 components that is in the range commonly applied in fMRI. Further functional connectivity analysis was carried out using ICA combined with dual regression (version 0.5b) technique [29] that produces subjectspecific spatial maps corresponding to each component from group ICA. This involves first using the obtained group ICA spatial maps in a linear model fit against the individual fMRI data sets (spatial regression) resulting in time-courses (TCs) specific for each independent component (IC) in each subject. Secondly, using these TCs, subject-specific spatial maps are calculated voxel-by-voxel (temporal regression). In both regressions, data and design are demeaned, and before the 2nd regression the TCs are variance normalized.
Prior to statistical inference 15 functionally relevant ICs were identified from the 30 IC decomposition discarding clearly motion, physiological noise, cerebrospinal fluid and white matter related components. Statistical voxel-wise testing was then performed using a twosample t-test in FSL randomise, a nonparametric permutation test [38] tool, in which the number of permutations was set to 5000. Threshold free cluster estimation (TFCE) [39] was used in correcting for the multiple comparison problem, significance was determined by voxel value surviving corrected p < 0.05 threshold. The anatomical loci of the results were defined using atlases available in the fslview-tool and a photographic atlas [40].
For assessing the temporal response of our constant stimulus, it is important to note that dual regression gives undetrended TC (spatial regression parameter estimates) manifestations of every IC for every subject. TCs from the component that differed significantly between the groups were post-processed in Matlab; first de-meaning each individual TC and calculating the mean TCs group-wise. For illustration purposes these group TCs were then scaled so that the first time point had zero intensity. A second degree polynomial was then fitted (polyfit-function) into mean TCs of both groups and plotted for illustrative purposes. Additionally, coefficients of the second degree polynomial were obtained from individual TCs and coefficients describing the trend were statistically tested with two-sample t-tests (assuming unequal variance) in Matlab. In order to illustrate spectral differences, individual TCs were also converted into the frequency domain with discrete Fourier transformation (FFT-function, no zero-padding) and group mean single-sided amplitude spectra between 0.00198 - 0.1 Hz were plotted.
According to the additional hypothesis concerning an immediate light response of the brain tissue, block-paradigm light-stimulus data were analyzed with FSL FEAT using the following pre-processing steps: motion correction, brain extraction, slice-timing correction, spatial smoothing with 6 mm FWHM Gaussian kernel and highpass filtering with 60 s cut-off period. Data were prewhitened before general linear modeling and the motion parameters were included in the model. The result was registered to the MNI template via a subject’s own anatomical scan using FLIRT. Group level analysis was carried out using a non-parametric one-sample t-test (onesample sign test) in FSL Randomise and TFCE was used for multiple comparisons correction.
3. RESULTS
3.1. Analysis of Constant Light Stimulus during Resting State fMRI
3.1.1. Spatial Analysis
Significant differences were revealed from comparisons between the constant light stimulus group (N = 23) and the sham control group (N = 26) using ICA dual regression analysis on full band fMRI data. In particular, the lateral visual network IC (Figure 2(a)) that largely conforms to the combined ventral and dorsal visual stream was found to have greater functional connectivity in the light group. The significant difference of 192 voxels (5.2 cm3) was widespread across the extrastriate visual cortex. Also, the cerebellum (especially anteriorly) and a bilateral difference on the border of cerebellum and brainstem near the locus coereleus were shown in the results. The sensorimotor IC also showed greater functional connectivity (21 voxels, 0.57 cm3) in the light group than in controls, at the border of the superior parietal lobule and the postcentral gyrus (Figure 3(a)).
3.1.2. Temporal Analysis
Examination of the temporal characteristics of the lateral visual component (Figure 2(b)) showed a slow increase in the light group that is clearly more prominent than the
 (a)
(a)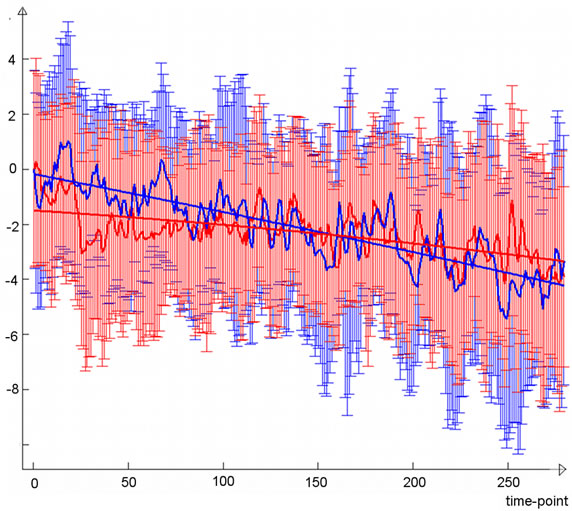 (b)
(b)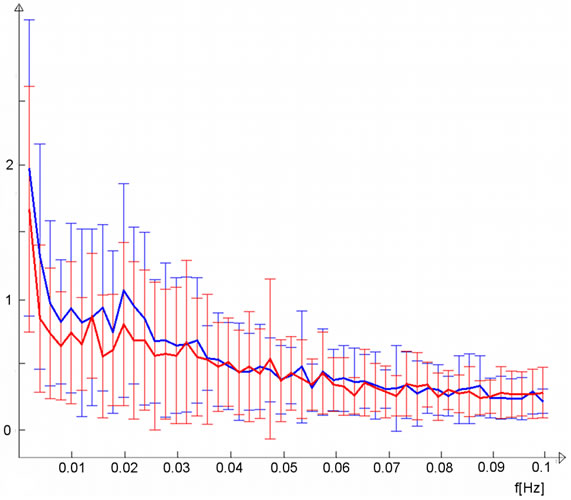 (c)
(c)
Figure 3. (a) Sensorimotor IC (warm colors) demonstrated greater functional connectivity (p < 0.05, corrected) in the light stimulus group compared to controls (cold colors); (b) Group mean time-courses and standard deviations for lateral visual IC of light group (blue) and controls (red), time-course units are demeaned values of spatial regression fit; (c) Corresponding frequency representation with group mean and standard deviation.
corresponding control group curve, which also exhibited slightly increasing activity during the second resting state scan. The light group temporal behaviour was not a linear trend but showed the steepest increase in functional connectivity after some minutes and reached a type of a plateau at around six minutes. Trend coefficients of the polynomial fits were greater in the light group although not significant; p-values were 0.12 for the first degree coefficient and 0.08 for the second. Frequency-wise, the light group mean spectrum was broadly elevated at frequencies below 0.035 Hz and most importantly at the lowest frequencies (Figure 2(c)). The sensorimotor IC (Figure 3(a)) did not show clear differences in the trend (Figure 3(b)), although the light group had a slightly greater first degree coefficient (p-value 0.38), while second degree coefficients were equal (p-value 0.96). Slightly elevated low-frequency power can be observed for sensorimotor IC (Figure 3(c)).
3.2. Control Measures
3.2.1. Comparison of Baseline Scans between the Groups
The first resting scans were employed as a control condition for checking whether there are systematic differences between groups preceding the actual scan of interest. The lateral visual IC that showed marked differences in the second scans was not found to differ in the first scans and the group mean TCs were similar considering the trend (data not shown). There were no prominent differences between the groups in the first resting state scans; the control group exhibited greater connectivity of 0.6 cm3 in the default-mode network.
3.2.2. Comparison of Motion between the Groups
Root-mean-square values from three dimensional motion estimates were not significantly different between groups in the second scans, although the light group was slightly greater, yielding p-values of 0.42 for absolute and 0.94 for relative motion. In the first scans, motion estimates did not differ significantly, yet absolute motion was slightly greater in the light group (p = 0.19) and relative motion was the same (p = 1.00).
3.2.3. Light-Stimulus Block Paradigm fMRI
In the block paradigm fMRI there were no significant differences; also examining sub-threshold values of the result map did not reveal any potential effect in the visual cortex.
4. DISCUSSION
The results from the full band resting state ICA dual regression analysis of normal healthy volunteers suggest that brain tissue is inherently light-sensitive. Light stimulation to the brain seems to induce a gradual increase in functional connectivity of the lateral visual network during the course of the stimulus. The light group demonstrated a slowly increasing response whereas the corresponding TC of the sham controls did not exhibit such a clear increasing trend.
Interpreting from the average brain (MNI 152) in standard space (Figure 1(b)), the regions encountering most of the light from the ear canal are the anterior cerebellum, inferior temporal lobe and pons in the brainstem. Also, the midbrain in the brainstem, posterior diencephalon and anterior occipital lobe can be within the range of light photons, especially at longer wavelengths. Although findings in the lateral visual IC are situated relatively close to the light stimulus source, they do not necessarily represent the corresponding site for photoreception but may be projections induced by the actual site of phototransduction elsewhere in the brain. In order to explain our findings we present a couple of highly theoretical ideas for the hypothesized signal cascade after phototransduction. Firstly, phototransduction could be provided by panopsin which has been detected in significant amounts in cerebellar Purkinje cells in mice [12,41] and in the human brain too [6,13]. Signaling from Purkinje cells is inhibitory but, relating to our findings of increased functional connectivity, they have been shown to be involved in causing excitatory up-state at the sensorimotor cortex [42]. The inhibitory GABAergic response mechanism is supported by increased release of the inhibitory neurotransmitter, GABA, by light stimulation of rat brain slices [14]. However, BOLD fMRI may not be the optimal measurement method for inhibitory signaling since detection of signal increase or decrease is not unambiguous [43,44], which may hamper the detection of the primary photoreception. As a second explanation, there could be a phototransduction mechanism that would result in excitatory signaling and lead to signal cascade with broad effects via neurotransmitters like dopamine, serotonin or noradrenaline mediated by the substantia nigra, raphe nuclei or locus coereleus, respectively. Interestingly, in a gene expression study (Allen Institute for Brain Sciences) [11] melanopsin gene expression has been detected in the midbrain reticular formation, more specifically in the subcuneiform nucleus, which is part of a reticular activation system regulating arousal [45]. In the same study, moderate panopsin expression in the substantia nigra has been demonstrated.
Lateral visual IC, containing mainly the extrastriate cortex, is directly related to the hierarchical organization of the two streams that process visual information. The ventral stream projects to the temporal cortex for object vision (“what”) and the dorsal stream projects to the parietal cortex for spatial vision (“where”) [46]. These pathways, and hence lateral visual IC, are substantially involved in complex abstractions of brain function such as visual attention, visual awareness and visual consciousness. In a cerebral blood flow study [47] of nonvisual responses to light the extrastriate brain areas (i.e. lateral visual areas) were found to activate in proportion to light exposure duration. Peculiarly, lateral visual IC as a responding entity is potentially congruent with a couple of spontaneous reports by light stimulus subjects, and other people testing the light stimulus outside of the present study, describing a clearer and widened field of view, although subjective feelings after the scanning session were not systematically researched. This subjective effect did not arise instantly during the light stimulus but seemed to appear later on after a varying delay. The similarity between these spontaneous reports, although few, provides a phenomenological explanation candidate for our fMRI results. Subjectively perceived change in the visual function is highly interesting, but it is unknown what factors determine the individual susceptibility and conscious observation threshold for the response as the majority of the subjects did not seem to report anything particular.
Most of the detected differences from lateral visual IC are situated within that IC, but also other areas share the temporal characteristics of the lateral visual component. These include the cerebellum anteriorly and bilaterally, on the border between the cerebellum and the brainstem (Figure 2(a)). The latter difference lies close to the locus coereleus, but detection of such a subtle structure is not feasible with present imaging resolution. The cerebellum is known to be involved in a vast range of tasks, in addition to motor functions, e.g. attention, executive control, language, visuo-spatial function and working memory [48]. The loci of our cerebellar findings (Figure 2(a)) lie close to lobules with functional connections to the somatosensory cortex.
The finding on the sensorimotor cortex IC (Figure 3(a)) was a focal spot and the component mean TC in the light group did not demonstrate a slow temporal pattern that would resemble an increasing baseline response to light stimulus. The detected difference could be linked to the observed increasing functional connectivity of the lateral visual IC related to cerebellar lobules that are involved in sensorimotor functions [48]; phototransduction in the anterior cerebellum could project to the somatosensory cortex.
The findings from brain tissue light stimulation are supported by the fact that no group differences were detected in the lateral visual IC in the first resting scan. Importantly, light and control group average TCs of the lateral visual IC during the first scan were very similar (data not shown), including the effect of gradient warm up, which appears as a prominently increasing signal level during the first five minutes. Moreover, as the eyes were protected from illumination, the results are not due to visual detection of light, which is supported by a lack of typical BOLD response within 5 - 6 seconds [23] from the beginning of the average TC in the lateral visual IC (Figure 2(b)). Also, we do not regard it plausible that photons would propagate to the retina through the light absorbing melanine in the back of the eye, and conscious visual perception of the light from ear has not been reported by any subject to the best of our knowledge. The block paradigm sub-study also showed no eyesightinduced changes in the visual cortex. A factor in the measurement that cannot be easily overcome is the possible slight warming of the ear canal with bright light exposure. However, we think the possible heat sensation does not offer an alternative explanation for the main finding; it is difficult to reason how it would cause increased visual cortex functional connectivity.
Considering data acquisition, subjects were randomly recruited but were not imaged in a balanced manner regarding stimulus; light stimulus subjects were scanned in December and February and controls in February and May. However, from our other fMRI study we did not find any seasonal differences in ICA dual regression analysis between the 46 subjects imaged in the winter and the 47 subjects imaged in the summer (data not shown). Again in the present study, there were no significant differences in the first resting-state scans between the groups that we could have regarded as a cause for increased lateral visual cortex connectivity in the successive scan. In addition, it is worth mentioning that the full band dual regression analysis, with time series variance normalization before the 2nd regression, places greater emphasis on the temporal shape [31], especially trend information, in the given component during the course of the measurement and is thus relatively insensitive to brain activity on the conventional resting state frequency band.
We aim to investigate inherent light reception of the brain further at a higher magnetic field with a more accurate MRI scanner in order to obtain data with better resolution and with better stability in longer measurement sessions. However, even without the instrumental drift there remains a question whether consecutive resting state scans can safely be assumed to be physiologically and psychologically stationary for comparison. Considering the somewhat uncomfortable nature of MRI scans, one should be cautious in longitudinal comparison, as the first resting state scan can demonstrate spontaneous activity trends that differ in scans made later during the session.
The mechanism for the phototransduction of the brain tissue remains to be discovered and we are currently investigating it in more depth. Light propagation from the light source in the ear canal could be studied with simulations or with cadavers, although haemoglobin absorbance is not fully included in the measurement in that case. It is a matter of further studies to discover how phototransduction and the following signal cascades are related between short term and long term modulations, corresponding to the present study and the ongoing SAD treatment study. After the mechanism can be demonstrated it may be possible to invent factors that amplify the signaling cascade after phototransduction, which could open up interesting applications for brain activity modulation. Also, the response variability among the general population and its relation to SAD susceptibility are of great research interest.
5. CONFLICTS OF INTEREST
Some of the authors have conflicts of interests with a company, Valkee Ltd., that develops and sells devices for bright light stimulation via ear-canal. Authors’ connections with Valkee Ltd. are: Nissilä and Aunio are company founders. Nissilä, Aunio, Takala and Timonen are share-holders (varying from major to minor). Nissilä, Aunio and live-in partner of Starck are employed by Valkee Ltd. Valkee Ltd. did not have a role in the decision to submit the paper for publication.
6. ACKNOWLEDGEMENTS
Academy of Finland grants 111711 and 123772, a Finnish Medical Foundation grant, and a Finnish Neurological Association grant contributed to this study. Nick Hayward of Scientific English, United Kingdom, is thanked for swift English proofreading.
REFERENCES
- Vandewalle, G., Maquet, P. and Dijk, D.-J. (2009) Light as a modulator of cognitive brain function. Trends in Cognitive Sciences, 13, 429-438. doi:10.1016/j.tics.2009.07.004
- Campbell, S.S., Murphy, P.J. and Suhner, A.G. (2001) Extraocular phototransduction and circadian timing systems in vertebrates. Chronobiology International, 18, 137-172. doi:10.1081/CBI-100103183
- Peirson, S.N., Halford, S. and Foster, R.G. (2009) The evolution of irradiance detection: Melanopsin and the non-visual opsins. Philosophical Transactions of the Royal Society B: Biological Sciences, 364, 2849-2865. doi:10.1098/rstb.2009.0050
- Berson, D.M., Dunn, F.A. and Takao, M. (2002) Phototransduction by retinal ganglion cells that set the circadian clock. Science, 295, 1070-1073. doi:10.1126/science.1067262
- Terakita, A. (2005) The opsins. Genome Biology, 6, 213. doi:10.1186/gb-2005-6-3-213
- Halford, S., Freedman, M.S., Bellingham, J., Inglis, S.L., Poopalasundaram, S., Soni, B.G., Foster, R.G. and Hunt, D.M. (2001) Characterization of a novel human opsin gene with wide tissue expression and identification of embedded and flanking genes on chromosome 1q43. Genomics, 72, 203-208. doi:10.1006/geno.2001.6469
- Mitsui, S., Tsuruoka, N., Yamashiro, K., Nakazato, H. and Yamaguchi, N. (1999) A novel form of human neuropsin, a brain-related serine protease, is generated by alternative splicing and is expressed preferentially in human adult brain. European Journal of Biochemistry, 260, 627-634. doi:10.1046/j.1432-1327.1999.00213.x
- Tarttelin, E.E., Bellingham, J., Hankins, M.W., Foster, R.G. and Lucas, R.J. (2003) Neuropsin (opn5): A novel opsin identified in mammalian neural tissue. FEBS Letters, 554, 410-416. doi:10.1016/S0014-5793(03)01212-2
- Nakane, Y., Ikegami, K., Ono, H., Yamamoto, N., Yoshida, S., Hirunagi, K., Ebihara, S., Kubo, Y. and Yoshimura, T. (2010) A mammalian neural tissue opsin (opsin 5) is a deep brain photoreceptor in birds. Proceedings of the National Academy of Sciences of the United States of America, 107, 15264-15268. doi:10.1073/pnas.1006393107
- White, J.H., Chiano, M., Wigglesworth, M., Geske, R., Riley, J., White, N., Hall, S., Zhu, G., Maurio, F., Savage, T., Anderson, W., Cordy, J., Ducceschi, M., GAIN investigators, Vestbo, J. and Pillai, S.G. (2008) Identification of a novel asthma susceptibility gene on chromosome 1qter and its functional evaluation. Human Molecular Genetics, 17, 1890-1903. doi:10.1093/hmg/ddn087
- BrainSpan: Atlas of the Developing Human Brain [Internet]. Funded by ARRA Awards 1RC2MH089921-01, 1RC2MH090047-01, and 1RC2MH089929-01. ©2011. Accessed 31 March 2011. http://developinghumanbrain.org
- Nissilä, J., Mänttäri, S., Tuominen, H., Särkioja, T., Timonen, M. and Saarela, S. (2011a) The Abundance and Distribution of Encephalopsin (OPN3) Protein in Mouse Brain. Proceedings of the Scandinavian Physiological Society, Unpublished.
- Nissilä, J., Mänttäri, S., Tuominen, H., Särkioja, T., Timonen, M. and Saarela, S. (2011b) The Abundance and Distribution of Encephalopsin (OPN3) Protein in Human Brain. Proceedings of the Scandinavian Physiological Society, Unpublished.
- Wade, P.D., Taylor, J. and Siekevitz, P. (1988) Mammalian cerebral cortical tissue responds to low-intensity visible light. Proceedings of the National Academy of Sciences of the United States of America, 85, 9322-9326. doi:10.1073/pnas.85.23.9322
- Leszkiewicz, D.N., Kandler, K. and Aizenman, E. (2000) Enhancement of nmda receptor-mediated currents by light in rat neurones in vitro. Journal of Physiology, 524, 365-374. doi:10.1111/j.1469-7793.2000.t01-1-00365.x
- Nieto, P.S., Valdez, D.J., Acosta-Rodrıguez, V.A. and Guido, M.E. (2011) Expression of Novel Opsins and Intrinsic Light Responses in the Mammalian Retinal Ganglion Cell Line RGC-5. Presence of OPN5 in the Rat Retina. PLoS One, 5, e26417. doi:10.1371/journal.pone.0026417
- Golden, R.N., Gaynes, B.N., Ekstrom, R.D., Hamer, R.M., Jacobsen, F.M., Suppes, T., Wisner, K.L. and Nemeroff, C.B. (2005) The efficacy of light therapy in the treatment of mood disorders: A review and meta-analysis of the evidence. American Journal of Psychiatry, 162, 656-662. doi:10.1176/appi.ajp.162.4.656
- Van Brunt, E.E., Shepherd, M.D., Wall, J.R., Ganong, W.F. and Clegg, M.T. (1964) Penetration of light into the brain of mammals. Annals of the New York Academy of Sciences, 117, 217-214. doi:10.1111/j.1749-6632.1964.tb48177.x
- Moan, J. (2001) Visible light and UV radiation. In: Brune, D., Ed., Radiation at Home, Outdoors and in the Workplace, Scandinavian Science Publisher.
- Ugryumova, N., Matcher, S.J. and Attenburrow, D.P. (2004) Measurement of bone mineral density via light scattering. Physics in Medicine and Biology, 49, 469-483. doi:10.1111/j.1749-6632.1964.tb48177.x
- Timonen, M., Nissilä, J., Liettu, A., Jokelainen, J., Jurvelin, H., Aunio, A., Räsänen, P. and Takala, T. (2012) Can transcranial brain-targeted bright light treatment via ear canals be effective in relieving symptoms in seasonal affective disorder? A pilot study. Medical Hypotheses, in Press. doi:10.1016/j.mehy.2012.01.019
- Jurvelin, H., Nissilä, J., Timonen, M., Takala, T., Jokelainen, J. and Räsänen, P. (2012) Transcranial bright light treatment via ear canals in seasonal affective disorder (SAD)—A randomized controlled trial. Unpublished.
- Logothetis, N.K. and Wandell, B.A. (2004) Interpreting the bold signal. Annual Review of Physiology, 66, 735- 769. doi:10.1146/annurev.physiol.66.082602.092845
- Biswal, B., Yetkin, F.Z., Haughton, V.M. and Hyde, J.S. (1995) Functional connectivity in the motor cortex of resting human brain using echo-planar MRI. Magnetic Resonance in Medicine, 34, 537-541. doi:10.1002/mrm.1910340409
- Fornito, A. and Bullmore, E.T. (2010) What can spontaneous fluctuations of the blood oxygenation-level-dependent signal tell us about psychiatric disorders? Current Opinion in Psychiatry, 23, 239-249. doi:10.1097/YCO.0b013e328337d78d
- Yan, L., Zhuo, Y., Ye, Y., Xie, S. X., An, J., Aguirre, G. K. and Wang, J. (2009) Physiological origin of low-frequency drift in blood oxygen level dependent (bold) functional magnetic resonance imaging (fMRI). Magnetic Resonance in Medicine, 61, 819-827. doi:10.1002/mrm.21902
- Bruhn, H., Fransson, P. and Frahm, J. (2001) Modulation of cerebral blood oxygenation by indomethacin: MRI at rest and functional brain activation. Journal of Magnetic Resonance Imaging, 13, 325-334. doi:10.1002/jmri.1047
- Schmidt, K.F., Febo, M., Shen, Q., Luo, F., Sicard, K.M., Ferris, C.F., Stein, E.A. and Duong, T.Q. (2006) Hemodynamic and metabolic changes induced by cocaine in anesthetized rat observed with multimodal functional mri. Psychopharmacology (Berlin), 185, 479-486. doi:10.1007/s00213-006-0319-1
- Beckmann C., Mackay C., Filippini N. and Smith S. (2009). Group comparison of resting-state fMRI data using multi-subject ICA and dual regression. Neuroimage, 47, S148. doi:10.1016/S1053-8119(09)71511-3
- Calhoun, V.D., Pekar, J.J. and Pearlson, G.D. (2004) Alcohol intoxication effects on simulated driving: Exploring alcohol-dose effects on brain activation using functional MRI. Neuropsychopharmacoloy, 29, 2097- 2107. doi:10.1073/pnas.0811879106
- Zuo, X.-N., Kelly, C., Adelstein, J.S., Klein, D.F., Castellanos, F.X. and Milham, M.P. (2010) Reliable intrinsic connectivity networks: Test-retest evaluation using ICA and dual regression approach. Neuroimage, 49, 2163- 2177. doi:10.1016/j.neuroimage.2009.10.080
- Beckmann, C.F. and Smith, S.M. (2004) Probabilistic independent component analysis for functional magnetic resonance imaging. IEEE Transactions on Medical Imaging, 23, 137-152. doi:10.1109/TMI.2003.822821
- Jenkinson, M., Bannister, P., Brady, M. and Smith, S. (2002) Improved optimization for the robust and accurate linear registration and motion correction of brain images. Neuroimage, 17, 825-841. doi:10.1006/nimg.2002.1132
- Smith, S.M. (2002) Fast robust automated brain extraction. Human Brain Mapping, 17, 143-155. doi:10.1002/hbm.10062
- Jenkinson, M. and Smith, S. (2001) A global optimisation method for robust affine registration of brain images. Medical Image Analysis, 5, 143-156. doi:10.1016/S1361-8415(01)00036-6
- Aguirre, G.K., Zarahn, E. and D’Esposito, M. (1997). Empirical analyses of bold fmri statistics. ii. spatially smoothed data collected under null-hypothesis and experimental conditions. Neuroimage, 5, 199-212. doi:10.1006/nimg.1997.0264
- Wang, J., Wang, Z., Aguirre, G.K. and Detre, J.A. (2005) To smooth or not to smooth? Roc analysis of perfusion fmri data. Magnetic Resonance Imaging, 23, 75-81. doi:10.1016/j.mri.2004.11.009
- Nichols, T.E. and Holmes, A.P. (2002) Nonparametric permutation tests for functional neuroimaging: A primer with examples. Human Brain Mapping, 15, 1-25. doi:10.1002/hbm.1058
- Smith, S.M., Nichols, T. E., 2009. Threshold-free cluster enhancement: Addressing problems of smoothing, threshold dependence and localisation in cluster inference. Neuroimage, 44, 83-98. doi:10.1016/j.neuroimage.2008.03.061
- DeArmond, S.J., Fusco, M.M. and Dewey, M.M. (1989) Structure of the human brain (3rd edition). Oxford University Press, Oxford.
- Blackshaw, S. and Snyder, S.H. (1999) Encephalopsin: A novel mammalian extraretinal opsin discretely localized in the brain. Journal of Neuroscience, 19, 3681-3690.
- Rowland, N.C., Goldberg, J.A. and Jaeger, D. (2010) Cortico-cerebellar coherence and causal connectivity during slow-wave activity. Neuroscience, 166, 698-711. doi:10.1016/j.neuroscience.2009.12.048
- Buzsáki, G., Kaila, K. and Raichle, M. (2007) Inhibition and brain work. Neuron, 56, 771-783. doi:10.1016/j.neuron.2007.11.008
- Logothetis, N.K. (2008) What we can do and what we cannot do with fMRI. Nature, 453, 869-878. doi:10.1038/nature06976
- Steriade, M. (1996) Arousal: Revisiting the reticular activating system. Science, 272, 225-226. doi:10.1126/science.272.5259.225
- Ungerleider, L.G. and Mishkin, M. (1982) Two cortical systems. In: Ingle, D.J., Goodale, M.A. and Mansfield, R.J.W., Eds., Analysis of Visual Behavior, MIT Press, Cambridge.
- Perrin, F., Peigneux, P., Fuchs, S., Verhaeghe, S., Laureys, S., Middleton, B., Degueldre, C., Del Fiore, G., Vandewalle, G., Balteau, E., Poirrier, R., Moreau, V., Luxen, A., Maquet, P. and Dijk, D.J. (2004) Nonvisual responses to light exposure in the human brain during the circadian night. Current Biology, 14, 1842-1846. doi:10.1016/j.cub.2004.09.082
- Stoodley, C.J. and Schmahmann, J.D. (2009) Functional topography in the human cerebellum: A meta-analysis of neuroimaging studies. Neuroimage, 44, 489-501. doi:10.1016/j.neuroimage.2008.08.039