Open Journal of Ecology
Vol.09 No.05(2019), Article ID:92663,14 pages
10.4236/oje.2019.95013
Avian Abundance, Diversity and Conservation Status in Etago Sub-County Kisii County Kenya
Mokono M. Isaac, Shadrack M. Muya, Winnie Kiiru, Muchane Muchai
Department of Zoology, Jomo Kenyatta University of Agriculture and Technology, Nairobi, Kenya

Copyright © 2019 by author(s) and Scientific Research Publishing Inc.
This work is licensed under the Creative Commons Attribution International License (CC BY 4.0).
http://creativecommons.org/licenses/by/4.0/


Received: April 15, 2019; Accepted: May 24, 2019; Published: May 27, 2019
ABSTRACT
Bird’s species diversity and abundance are being threatened due to agricultural activities and anthropogenic practices which causes habitat destruction and fragmentation. Understanding how avian species respond to habitat destruction is important towards development of effective measures to ensure that the environment is protected. A study on avian abundance, diversity and conservation status was conducted in Etago Sub-County, Kisii County Kenya from September 2018 to February 2019. Point counts and time species counts were used to carry out birds’ survey to determine their abundance and diversity in the secondary forest, sugarcane plantations, human settlement and mixed firms. A total of 4992 individuals were observed and recorded in the entire study area. The human settlement had the highest density of 1.664 ± 0.18 birds/ha followed by sugarcane plantation with 1.092 ± 0.16 birds/ha and Nyangweta secondary forest was third with 0.0819 ± 0.13. Mixed firms had the least density of 0.95 ± 0.017 bird/ha. Further Dunn’s multiple comparisons test showed that Mixed farming and forest had no significant difference and had mean rank difference of 11.37. In mixed farming vs human settlement there was a significant difference with a mean rank difference of 57.38; in mixed farming vs sugarcane farms there was no significant difference; in the four habitats, 114 species of birds were cumulatively recorded. Out of these, 106 species were recorded in the secondary forests, 98 human settlement and 87 species in the sugarcane plantations and 55 in mixed farms. There was a significant difference in bird diversity in the four habitats where Secondary forest had the highest diversity of 3.85 and sugarcane plantations had a diversity of 3.71 while human settlement and mixed firms had lower diversities of 2.6 and 2.5 respectively (df1 = 2, df2 = 0.0 F = 0.00001, P = 0.00001).
Keywords:
Density, Similarity, Diversity, Abundance, Richness

1. Introduction
Highlands and Mountains are known for sheltering high diversity of birds with many coexisting species within habitat types [1]. Forest is the most important habitat for birds by sustaining around 85% of all bird species while only 45% of all bird species have adapted to human modified habitats [2] [3]. Human activities such as farming, settlement, charcoal making, pole cutting, and firewood collection have contributed in removal of forests (degradation) which has expansively damaged the natural habitat of birds, affecting their variety and variability [4].
Birds are very noticeable and form an integral part of the ecosystem. Birds occupy many trophic levels in a food chain ranging from consumers to predators. Their occurrences have been helpful as ecological health indicator, plant pollinators particularly of trees with sturdy, brightly coloured flowers [5] and seed dispersal that is Frugivorous birds assist in the natural regeneration by dispersing seeds [6] as well as pest controller [7]. Furthermore they form part of the attractive vertebrates which are enjoyable to watch because of their distinctive colors, showy display, also distinctive songs and calls.
Avian species diversity is a function of the number of species present (species richness or number of species) and the evenness with which the individuals are dispersed among these species (species evenness, species equitability, or abundance of each species) [8]. According to [9] [10] this definition may be the best one available at the moment [11]. They emphasized that the concept of species diversity should be restricted to this extent if it should have any useful meaning.
There have been two approaches to measuring avian species diversity, both of which incorporate information on the number of species (species diversity) and the relative abundances of individuals within each species (species abundance) [10]. One method has been to construct mathematical indices broadly known as diversity indices and the other involves comparing observed patterns of species abundance to theoretical species abundance models. Species diversity indices take two aspects of a community into account, namely species richness and evenness or equitability (the distribution of abundance among the species) [10].
The combined effect of landscape degradation caused by agricultural development, forestry practices together with accelerated climate change is the greatest current menace to biodiversity [12]; Millennium Ecosystem Assessment 2005 [13].
In Kenya habitat fragmentation is a paradigm of three main effects: degradation of habitat quality; separation of habitat fragments by anthropogenic matrix (e.g. pasture lands and settlements) and increased intensity of edge effects [14] Habitat changes migrants [15]. The main effect to less diverse and range-restricted birds, rainforest specialists and altitudinal habitat fragmentation and degradation is the reduction of population size and an increased vulnerability to extinction [15]. This exposes risk to many tropical species, as in Kenya, forest habitats have already been drastically altered by human activities and most of the natural forests have disappeared. Etago Sub-County in particular, is one of the most densely populated regions in Kisii highlands with ecosystems highly threatened by human activities including small-scale farming, monoculture, urbanization, and agro-forestry. However, the consequences of land use patterns on the diversity and conservation of various species of birds in the Kisii County and Etago Sub-County in particular are not well understood, yet the ability of different species to survive and reproduce in disturbed/modified areas is of great importance [16] [17].
Species abundance is a component of biodiversity and refers to how common or rare a species is relative to other species in a defined location or community. Species abundances tend to conform to specific patterns that are among the best-known and most-studied patterns in macro ecology. Usually species abundances are described for a single trophic level. Because such species occupy the same trophic level they will potentially or actually compete for similar resources. For example, species abundances might describe all terrestrial birds in a forest community. A number of factors are known to affect bird species abundance in any natural ecosystem.
According to Bird life International’s World Bird Data base, land use practices are the biggest source of threat to bird species listed as threatened, and that this is substantially more important for species in developing than developed countries [17]. Most research on farmland in the tropics has been in the form of comparative studies between more natural areas and adjacent farmland [18] , and investigating the effect of adjacent farmland and savanna on populations of birds in fragmented natural habitat [19] [20].
Therefore in understanding the threat of land use patterns on biodiversity in Kisii County and Etago Sub-County in particular, the assessment of birds’ diversity and abundance is crucial. This could contribute to their conservation and protection. Pursuant to that, this study will examine the diversity, abundance and conservation status. Generally the specific objective of the study was 1) to determine the abundance of birds in various habitat types in Etago Sub-County Kisii County 2) to establish the relationship between land use patterns and avian diversity in Etago Sub-County Kisii County and 3) to establish the avian conservation status in Etago Sub-County Kisii County. The hypothesis of the study was the abundance of birds is the same in various habitats in Etago Sub-county and there is no relationship between land use patterns and avian diversity
2. Materials and Methods
2.1. Study Site
The study was conducted at Etago Sub-County in Kisii County Kenya. Etago is situated in the south east of Kisii County the Sub County lies between latitude 00 52'60" and 10 50' South and longitude 340 39' and 35014' East. The Sub County borders Suba to the South, Kuria and Migori Sub Counties to the West, Gucha South to the North. The Sub County covers an area of about 1932 km2. The area receives an annual rainfall of 1923 mm and an average temperature of 19.2˚C. The area is selected because of its vast array of land use practises. The site is chosen based on visual determination of the intensity of various land use practices like agriculture and forested land in order to cover a bigger range of anthropogenic affected areas, the map (Figure 1) is a section of Etago Sub-County.
2.2. Data Collection
The belt transect was chosen as sampling units due to the open nature of much of the area [21]. Prior to field surveys the study area was stratified into habitats 1) sugarcane firms 2) secondary forests 3) areas under human settlement and 4) mixed farming. A sample area of 1 × 1 km square was picked at random from each of the four study areas. Those selected areas were further sub-divided into 0.5 × 0.5 km smaller study areas and a total of 3 belts were laid down randomly within the small study areas. The areas consist of a mosaic of many different habitats and field types so in order to limit the habitats surveyed per transect, transects were restricted to 100 M by 50 M in size. This involved moving along a pre-determined route and all birds seen or heard were recorded and the perpendicular distance of each to the point of observation (plots). The program GPS Utility was used to place transects within each site. Each start point being at least 50 M away from the nearest neighbour in order to avoid crossing of transects.
Sites were chosen randomly to distribute visiting time equally across all transects. All birds observed were identified and the number in the group recorded.
2.3. Data Analysis
Data from the field was looked into, in the case where data deviated from the normal distribution appropriate intervention method was applied. Data on

Figure 1. Showing study area in Etago Sub-County, Kisii County Kenya.
abundance was tested for normality and then was subjected to square root transformation to normalize it then the formula was applied to determine relative density. A probability of Type I error of 0.95 (α = 0.05 or less) was accepted as significant (unless otherwise noted). The data was analyzed using SPSS and R-program [22].
Data on avian species diversity in the four habitats was calculated using the Shannon diversity (H) index. Species richness is a biologically appropriate measure of alpha (α) diversity and is usually expressed as number of species per sample unit [23]. The Shannon diversity index (H) was calculated using the following equation:
where: H = the Shannon diversity index, Pi = fraction of the entire population made up of species i, S = numbers of species encountered, Σ = sum from species 1 to species S.
Relative abundance of a species is the abundance of a species divided by total abundance of all species. It is based on the assumption that the more frequently a species is seen the more abundant it is (Bibby, Martin, & Marsden, 2002). For every habitat, relative abundance of each species was calculated as follows
3. Results
3.1. Avian Abundance
A total of 4920 birds of different species were recorded on 4 sites surveyed. Most of the species were dominant in almost all study sites and 3 species taking higher numbers were noted. The average density of the three most common species was highest with Nyangweta taking 1230, sugarcane plantation taking 1340, human settlement taking 1390 and mixed farming taking 960 respectively. Human settlement, sugarcane plantation and Nyangweta took the lion share of the average density with mixed farming taking the lowest.
Human settlement had the highest mean with a density of 1.664 ± 0.18 birds/Ha. Then it was followed by sugarcane farms with a density of 1.092 ± 0.16 birds/Ha. Nyangweta secondary forest came third with a mean density of 0.9819 ± 0.13 birds/Ha. Mixed farms had the lowest density/Ha of 0.95 ± 0.17 birds/Ha (Figure 2).
The densities of bird species/Ha were also analyzed in every study site and the following were obtained:
1) Nyangweta
In Nyangweta the Common Bulbul (Pycnonotus barbatus) and Tropical Boubou (Laniarius aethopicus) had the highest abundance with a density of 8 ± 0.2471 birds/Ha, followed by Common Fiscal (Lanius collaris) at 7 ± 0.1340, African Paradise Flycatcher (Terpsiphone viridis) 6 ± 0.1414 birds /Ha. The Variable Sunbird (Cinnyris venustus) and White-browed Robin Chat (Cossypha heuglini) at 5 ± 0.2213 birds/Ha respectively were shown in Figure 3.
2) Sugarcane Plantation
In Sugarcane plantation the Common Fiscal (Lanius collaris) had the highest abundance with a density of 8 ± 0.35741 birds/Ha. This was followed by Baglafecht Weaver (Ploceus baglafecht), Bronze Mannikin (Ploceus baglafecht), Cape Robin Chat (Cossypha caffra), Common Bulbul (Pycnonotus barbatus), Tawny-flanked Prinia (Psalidoprocne albiceps), White-headed Saw-wing (Psalidoprocne albiceps), and White-throated Bee-eater (Merops albicollis) with 6 ± 0.35741 birds/Ha respectively as shown in Table 1.
3) Human Settlement
In human settlement the Baglafecht Weaver (Ploceus baglafech) had the highest abundance with a density of 7 ± 0.3845 birds/Ha. This was followed by Common Fiscal (Lanius collaris), Grey-backed Camaroptera (Camaroptera brachyuran), Pied Crow (Corvus albus), and Tawny-flanked Prinia (Prinia subflava) that had 6 ± 0.3845 birds/Ha as shown in Figure 4.
4) Mixed Farming
In mixed farming the Bronze Mannikin (Spermestes cucculatus) had the highest abundance with a density of 8 ± 0.5122 birds/Ha. This was followed by Common Bulbul (Pycnonotus barbatus) with 7.45 ± 0.5122 birds/Ha and Tropical Boubou (Laniarius aethopicus) that took 6 ± 0.5122 birds/Ha in Table 2.
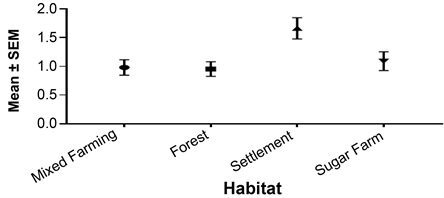
Figure 2. Overall difference in bird abundance between habitat types. Legend: SEM-Standard error of mean.
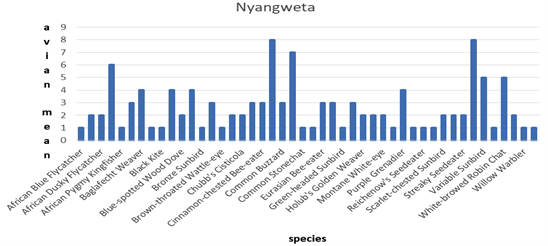
Figure 3. Showing bird abundance in Nyangweta forest.

Figure 4. Showing avian abundance in the human settlement areas.

Table 1. Showing bird species abundance in the sugarcane plantations.
Table 2. Showing avian abundance in mixed farms.
There was a significant difference in bird abundance in the four habitats. A further Dunn’s multiple comparisons test showed that human settlement, sugarcane plantation and Nyangweta considerably differed from mixed farming with a lower birds’ abundance as shown in Table 3.
Mixed farming and forest had no significant difference and had mean rank
Table 3. Showing Dunns’ comparisons test for the four study sites.
difference of 11.37. In mixed farming vs human settlement there was a significant difference with a mean rank difference of 57.38, in mixed farming vs sugarcane farms there was no significant difference; however forest vs human settlement there was a significant difference with a mean rank difference of 46.
3.2. Bird’s Species Diversity
In the four habitats, H range was between 2.5 and 3.85. Shannon diversity index was higher in secondary forest (H = 3.85) than in other study sites. Secondary forest was diverse with more different and number of bird species compared to other habitats. A further post hoc Turkey’s pairwise comparison test showed that the Nyangweta secondary forest had the highest diversity with a diversity index of 3.85, Human settlement followed with a diversity index of 3.71. Sugarcane plantation and mixed farming were third and fourth with an index of 2.8 and 2.5 respectively. As shown in Figure 5.
1) Bird Species Richness per Habitat
Bird species richness, were summarized and equated amongst the four habitats (Nyangweta, Sugarcane plantation, Human settlement and Mixed farming). Bird’s species richness was computed using birds’ recorded by TSC. A total of 492 birds cumulatively documented in the four habitats using TSC’s. From all these, 104 species were recorded in Nyangweta, 87 in sugarcane plantations, 98 in human settlement and 70 in mixed farming. 105 species (78.25%) were observed in at least two of the four habitats and a total 52 species (25.00%) were observed across the four habitats. Nyangweta forest had the highest species richness at 104 species (78.25%) (Table 4).
2) Species Cumulative Curve
This simple test aimed to bring out how close the total numbers of species recorded during the study were to the potential total number of species actually in the study area. The species discovery curves of Nyangweta, sugarcane plantation, human settlement and mixed farming areas were as per the begun day one to day fifteen respectively where increased searches was unlikely to record new additional species in the three fragments (Figure 6).
3.3. Avian Conservation Status
1) Birds’ Species of Interest
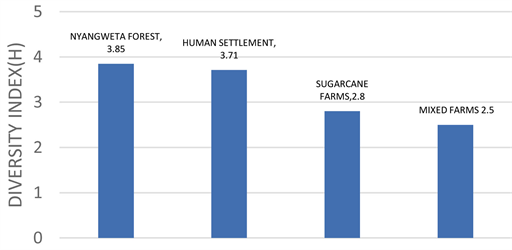
Figure 5. Showing species diversity index in the four habitats.

Figure 6. Species discovery curves.
In Etago Sub-County 114 species of birds were observed out of which 15 species were Afrotropical migrants, 13 species were Palearctic migrants, 6 species were both Palearctic and Afrotropical migrants and 71 species were residents.
2) Threat Status of Birds
Yellow-whiskered Greenbul (Andropadus latirostris) was endangered Rüppell’s Robin Chat (Cossypha semirufa), Red-capped Robin Chat (Cossypha natalensis), and Red-faced Cisticola (Cisticola erythrops) were threatened, Hinde’s Babbler (Turdoides hindei) was found to be vulnerable in the study area during the study period as illustrated.
3) Forest Dependency
The study area had highest number of forest visitor standing at 60%, followed by non-forest birds at 27%, forest generalist at 10% and forest specialist were least at 3%.
4. Discussions, Conclusions and Recommendations
4.1. Avian Abundance
The trend indicated high avian abundance in areas with heavily induced human
Table 4. Bird species richness per habitat.
activities and decreased towards forested areas. The result of this study concurs with the findings of [24]; Chace and Walsh (2006) and [25] who concluded that human-disturbed areas provide heterogeneous habitats which attract human tolerant avian species. Higher abundance per species count and density in settlement could have had been contributed by few species that coexist with humans such as; Bronze Mannikinn (Spermestes cucullatus), Common Bulbul (Pycnonotus barbatus) and House Sparrow (Passer domesticus). Other studies elsewhere in human settlements [26]; [27] also found similar result and concluded that high abundance in the settlement and sugarcane plantations were triggered by habitat heterogeneity such as grasslands, trees and gardens trees established by humans.
It was observed that during the entire period of study, human settlement and sugar firms had high avian density. This could be explained by the fact that these areas are open in nature and had plenty of food and cover for different species of birds [27] [28]. Forest habitat had a few individuals recorded; the least number could be due to forest degradation through tree logging, cutting of building materials, collection of firewood and charcoal making which affect forest birds (Frontier—Tanzania, 2005; Doggart et al., 2005; Poulin et al., 1992). Decreased cover for escape from enemies and shelter, food supply and breeding sites increases competition within and between species hence the decrease in number can be reflected.
4.2. Avian Diversity
The findings from this study agree with many other studies [24]; Chace and Walsh, 2006 [25]; that higher vegetation cover supports higher diversity of birds. The highest diversity observed in forest was more likely because of well sufficient vegetation cover than in the settlement and farmland which has been affected by land use changes [29]. The highest species diversity indicates a complex community in which a high degree of species interaction is possible contrary to higher abundance and dominance observed in settlement and farmland, which implies that few species pre-dominate the habitats. Though farmland showed less diversity, higher dominance was due to persistence of native and generalist species like a large number of Tropical Boubou (Laniarius aethopicus) (Chance and Walsh, 2006 [26]). On the other hand, the higher richness in the forest is supported by continuation of vegetation which reduces the impact of predation to adult birds, young and eggs. The case is different to highly interfered habitat like settlement and farmland [30]. Avian species richness was highest in Nyangweta forest (secondary forest) followed by human settlement while mixed firms had the lowest avian richness. The highest richness in Nyangweta forest could be associated with small undisturbed habitats of the forest. The areas therefore can be considered for conservation of birds’ biodiversity as compared to sugar firms and human settlement areas.
Habitat loss and degradation are considered major causes of avian species decline (Coulson & Crockford, 1995). In Etago Sub-County deforestation, encroachment of grassland in swamps and protected areas and human settlement were found to be the major threats to avian abundance and diversity. As expected [31] (Gaston, 1994), such gap formation and habitat reduction had a direct effect on the bird species. Such an observation on a sedentary, territorial and habitat specific species like forest specialist would mean that, continued pressure on the species’ preferred habitat will be reflected with an increased competition for resources. Diamond (1975) claims that, patterns in distribution of species over geographic locations or habitat types have been interpreted as evidence of competition. Intraspecific competition potentially has a negative effect on the excluded members [32] , by forcing them to locate territories in areas that may be less suitable. For example forest specialist species have greatly reduced in number due to forest disturbance and this species could have migrated to other habitats with less disturbance and low competition. Such poor habitats will offer less supply of resources, reducing their reproductive and survival success and present more chances of loss by predation and hunting, leading to a decline in the species population size.
Although some species have become very successful as a result of shifts in land-use activities [33] many species of birds have suffered due to such a shift and human disturbance within their habitat. [5] [34] found such changes affecting Tambourine Dove home range and cover. The same was evident with M. sharpie [32]. The consequences of habitat loss are thus clearly evident.
5. Conclusions
The findings of this study show that areas with heavily induced human activities like sugarcane plantations and human settlement areas indicated high avian abundance. This could have been attributed to the fact that human-disturbed areas provide heterogeneous habitats which attract human tolerant avian species. The high density of birds per hector in human settlement and sugarcane farms could also be attributed to the fact that this areas were open in nature and had plenty of food and cover for different species of birds.
The study also showed that forested areas like Nyangweta forest had high avian diversity and this was attributed to sufficient vegetation cover. High diversity was also an indicator of complex avian communities within the forest in which there was high degree of species interaction.
From the findings in this study it is evident that there was variation in avian abundance in different land use types. It was also clear that increased land use intensity altered avian diversity. It can also be concluded that vegetation played a major role in diversity and density patterns of avian communities across the land use types.
Acknowledgements
The successive completion of this manuscript was God’s grace. Firstly I would like to express my sincere gratitude to my advisor mentor and teacher, Dr. Shadrack Muya for the continuous support, his patience motivation and immense knowledge shaped this thesis. I would also wish to thank Dr. Winnie Kiiru and Dr. Muchane Muchai not only for their insightful comments and encouragement but also for their hard questions which incented me to widen my research from various perspectives.
I thank my fellow course mates: Mr. mogaka Daniel, madam linnet ndede and Wilson moseti for their encouragement and criticism. I also wish to thank; Vincent, Kitiri and Ronald Onkundi this guys helped me greatly in data collection and identification. Lastly I wish to thank my wife carol for the moral support during my study period.
Conflicts of Interest
The authors declare no conflicts of interest regarding the publication of this paper.
Cite this paper
Isaac, M.M., Muya, S.M., Kiiru, W. and Muchai, M. (2019) Avian Abundance, Diversity and Conservation Status in Etago Sub-County Kisii County Kenya. Open Journal of Ecology, 9, 157-170. https://doi.org/10.4236/oje.2019.95013
References
- 1. Jankowski, J.E., et al. (2009) Beta Diversity Long Environmental Gradient. Journal of Animal Ecology, 78, 315-327. https://doi.org/10.1111/j.1365-2656.2008.01487.x
- 2. Dickson, B.G. and Beier, P. (2002) Home-Range and Habitat Selection by Adult Cougars in Southern California. The Journal of Wildlife Management, 66, 1235-1245. https://doi.org/10.2307/3802956
- 3. BirdLife International (2017) Birds Occur in All Major Habitat Types, with Forest Being Particularly Important. http://www.birdlife.org/datazone/sowb/casestudy/172
- 4. Storch, D., et al. (2003) Distribution Patterns in Butterflies and Birds of the Czech Republic Separating Effects of Habitats and Geographical Position. Journal of Biogeography, 30, 1195-1205. https://doi.org/10.1046/j.1365-2699.2003.00917.x
- 5. Sutherland, J.M. (2000) The Conservation Handbook Research, Management and Policy. Blackwell Science, Oxford. https://doi.org/10.1002/9780470999356
- 6. Holl, K.D., et al. (2000) Tropical Montane Forest Restoration in Costa Rica: Overcoming Barriers to Dispersal and Establishment. Restoration Ecology, 8, 339-349. https://doi.org/10.1046/j.1526-100x.2000.80049.x
- 7. Simberloff, D. (1995) Habitat Fragmentation and Population Extinction of Birds. IBIS, 137, S105-S111.
- 8. Margalef, R. (1958) Information Theory in Biology. General System, 3, 36-71.
- 9. Crofford, L.J., et al. (2000) Basic Biology and Clinical Application of Specific Cyclooxygenase-2 Inhibitors. Arthritis & Rheumatology, 43, 4-13. https://doi.org/10.1002/1529-0131(200001)43:1<4::AID-ANR2>3.0.CO;2-V
- 10. Hamilton, A.J. (2005) Species Diversity or Biodiversity. Journal of Environmental Management, 75, 89-92. https://doi.org/10.1016/j.jenvman.2004.11.012
- 11. Borrow, N. and Demey, R. (2001) Birds of Western Africa. Christopher Helm, London.
- 12. Hole, D.G., et al. (2011) Toward a Management Framework for Networks of Protected Areas in the Face of Climate Change. Conservation Biology, 25, 305-315.
- 13. Lee, T.M. and Jetz, W. (2008) Future Battlegrounds for Conservation under Global Change. Proceedings of the Royal Society, 275, 1261-1270. https://doi.org/10.1098/rspb.2007.1732
- 14. Saunders, D.A., Hobbs, R.J. and Margules, C.R. (1991) Biological Consequences of Ecosystem Fragmentation: A Review. Conservation Biology, 5, 18-32. https://doi.org/10.1111/j.1523-1739.1991.tb00384.x
- 15. Brooks, T., et al. (2001) Conservation Priorities for Birds and Biodiversity: Do East African Important Bird Areas Represent Species Diversity in Other Terrestrial Vertebrate Group? Ostrich—Journal of African Ornithology, 15, 3-12.
- 16. Ashburner, M., et al. (2000) Gene Ontology: Tool for the Unification of Biology. Nature Genetics, 25, 25-29. https://doi.org/10.1038/75556
- 17. Green, R.E., et al. (2005) Farming and the Fate of Wild. Nature Science, 307, 550-555. https://doi.org/10.1126/science.1106049
- 18. Naidoo, R. (2004) Species Richness and Community Composition of Songbirds in a Tropical Forest-Agricultural Landscape. Animal Conservation, 7, 93-105. https://doi.org/10.1017/S1367943003001185
- 19. Hughes, J.B., Daily, G.C. and Ehrlich, P.R. (2000) Conservation of Tropical Forest Birds in Countryside Habitat. Ecology Letters, 5, 121-129. https://doi.org/10.1046/j.1461-0248.2002.00294.x
- 20. Matlock, R.B., Rogers, D., Edwards, P.J. and Martin, S.G. (2002) Avian Communities in Forest Fragments and Reforestation Areas Associated with Banana Plantations in Costa Rica. Agriculture Ecosystems and Environment, 91, 199-215. https://doi.org/10.1016/S0167-8809(01)00232-8
- 21. Bibby, C.J., Martin, J. and Marsden, S. (2002) Why Conserve Bird Diversity? Conservation Biology Series, Cambridge.
- 22. Nie, N., Hull, C. and Bent, D. (2001) IBM Statistical Package for the Social Sciences SPSS Version 20. Computer Software. SPSS, Chicago.
- 23. Whittaker, R.H. (1972) Evolution and Measurement of Species Diversity. Taxon, 21, 213-251. https://doi.org/10.2307/1218190
- 24. Clergeau, P., Savard, G., Mennechez, G. and Falardeau, G. (1998) Bird Abundance and Diversity along Urban Rural Gradient. The Condor, 3, 413-425. https://doi.org/10.2307/1369707
- 25. Sandstrom, U.G., Angelstam, P. and Mikusinski, G. (2005) Ecological Diversity of Birds in Relation to the Structure of Urban Green Space. Landscape Urban Plan, 77, 39-53. https://doi.org/10.1016/j.landurbplan.2005.01.004
- 26. Pennington, D.N. and Blair, R.B. (2011) Habitat Selection of Breeding Riparian Birds in an Urban Environment: Untangling the Relative Importance of Biophysical Element and Spartial Scale. Diversity and Distribution, 17, 506-518. https://doi.org/10.1111/j.1472-4642.2011.00750.x
- 27. Shochat, E., Lerman, S. and Fernández-Juricic, E. (2011) Birds in Urban Ecosystems: Population Dynamics, Community Structure, Biodiversity, and Conservation. In: Aitkenhead-Peterson, J. and Volder, A., Eds., Urban Ecosystem Ecology, Chapter 4, ASA-CSSA-SSSA, Madison, 75-86.
- 28. Askins, R.A., Folsom-Okeefon, C.M. and Hardly, M.C. (2012) Effect of Vegetation, Corridor Width and Regional Land Use on Early Successional Birds on Powerline Corridors. PLoS ONE, 7, e31520.
- 29. Fahrig, L, et al. (2010) Functional Landscape Heterogeneity and Animal Biodiversity in Agricultural Landscape. Ecology Letters, 14, 101-112. https://doi.org/10.1111/j.1461-0248.2010.01559.x
- 30. Campbell, M. and John, M. (2012) Habitat Fragmentation and Birds.
- 31. Gaston, K.J. (2004) Macroecology and People. Basic and Applied Ecology, 5, 303-307. https://doi.org/10.1016/j.baae.2004.05.001
- 32. Muchai, M., Lens, L. and Bennun, L. (2002) Habitat Selection and Conservation of Sharpe’s Longclaw (Macronyx sharpei), a Threatened Kenyan Grassland Endemic. Biological Conservation, 105, 271-277. https://doi.org/10.1016/S0006-3207(01)00118-5
- 33. Doggart, N., et al. (2005) Biodiversity Surveys in the Forest Reserves of Uluguru Mountains. DSM, Tanzania.
- 34. Frontier-Tanzania (2005) Uluguru Component Biodiversity Survey. CMEAMF, Tanzania.