Open Journal of Ecology
Vol.4 No.9(2014), Article
ID:47213,11
pages
DOI:10.4236/oje.2014.49045
Potential Range Expansion of the Invasive Red Shiner, Cyprinella lutrensis (Teleostei: Cyprinidae), under Future Climatic Change
Helen M. Poulos1*, Barry Chernoff1,2
1College of the Environment, Wesleyan University, Middletown, USA
2Departments of Biology and Earth and Environmental Studies, Wesleyan University, Middletown, USA
Email: *hpoulos@wesleyan.edu
Copyright © 2014 by authors and Scientific Research Publishing Inc.
This work is licensed under the Creative Commons Attribution International License (CC BY).
http://creativecommons.org/licenses/by/4.0/


Received 3 March 2014; revised 3 April 2014; accepted 10 April 2014
ABSTRACT
We built climate envelope models under contemporary and future climates to explore potential range shifts of the invasive Red Shiner-Cyprinella lutrensis. Our objective was to estimate aquatic habitat vulnerability to Red Shiner invasion in North America under future climatic change. We used presence records from within the species’ native and invaded distributions, a suite of bioclimatic predictor variables from three climate models (CCCma, CSIRO, and HadCM3), and maximum entropy modeling to generate potential distribution maps for the year 2080. Our model predicted major range expansion by Red Shiner under both low and high carbon emissions scenarios. The models exceeded average area under the receiver operator characteristic curve values of 0.92, indicating good overall model performance. The model predictions fell largely outside of areas of climatic extrapolation (i.e. regions predicted into environments different from training the region) indicating good model performance. The results from this study highlight the large potential range expansion across North America of Red Shiner under future warmer climates.
Keywords:Invasive Fishes, Maxent, Climate Envelope Model, Climate Change, Biological Invasions, Cyprinella Lutrensis

1. Introduction
Human-mediated species introductions are major drivers of global environmental change [1] [2] . Non-native species are drivers of ecosystem change through the alteration of a variety of processes including primary productivity, hydrology, geomorphology, nutrient cycling, and natural disturbance regimes [2] [3] . Ongoing shifts in climate will likely exacerbate the effects of invasive species on ecosystem function as native and alien species alike shift their geographical ranges in response to changing environmental conditions [4] [5] . Exotic invaders are well suited to succeed in novel environments because of their tolerance of variable environmental conditions, and global climate change is likely to increase these effects as alien species spread to previously uninhabited locations [6].
While rivers provide an array of key ecosystem services including clean water and biodiversity [7] , they remain one of the most vulnerable habitats to invasion by exotic species [8] . The spread of freshwater invasive species across the globe has stimulated major shifts in riverine community structure through native species displacement and extinction [9] [10] and via the alteration of hydrological cycles [11] , nutrient flows [12] [13] , and food webs [14] [15] . Mounting evidence of the effects of accelerated climatic change on the global biota heightens the urgency of understanding the potential impacts of novel climates on invasive species distributions.
Predicting the potential spread of aquatic species under future climates is critical for developing long-term management guidelines for conservation planning. Climatic envelope modeling (CEM) is a widely-employed method for forecasting the potential distributions of species under climate change [16] [17] where future species distributions are modeled under the CEM framework by deriving a climatic envelope from contemporary distribution points and projecting this envelope onto future climatic data [18] [19] . While CEM has proven useful for conservation and biodiversity management around the globe, extrapolating species distributions into novel climates must be performed with care because of the difficulties associated with accurately modeling a species’ fundamental niche [20] -[25] . Recent debates on this topic have signaled the need for 1) incorporating biologically meaningful variables into the CEM modeling effort [23] [26] ; 2) careful model parameterization [23] [25] [27] , and 3) thorough evaluation and cautious interpretation of model projections under novel climate scenarios [25] .
We employed the CEM approach to predict the response of Red Shiner (Cyprinellalutrensis (Baird and Girard 1853)) to future climatic change in North America, while attempting to address the short-comings of CEMs through careful model parameterization, model performance assessment, and model interpretation. Although CEM modeling is widespread for terrestrial species, the approach has been little applied to predict the impacts of climate change on invasive fishes living in habitats that are restricted by riparian network structure [28] [29] . This work builds upon prior preliminary research by Poulos et al. [30] who mapped the contemporary potential distribution of Red Shiner across the conterminous United States using topo-climatic predictors by investigating how the distribution of this species may respond to future climatic shifts across North America. Our specific objective in this study was to identify regions with high invasion potential under both low and high future carbon emissions scenarios. We used Maxent [31] to model this species’ distribution at the year 2080 under two future climate scenarios (B2 and A1B) representing low and high emissions scenarios, respectively. The B2 scenario predicts CO2 emissions between 10 and 20 GtC/yr for the year 2080 [32] . It represents a balance between environmentalism and life-quality where global population peaks mid-century and increases in resource-efficient technologies develop over time. The A1B scenario predicts CO2 emissions ranging between 15 and 25 GtC/yr for the year 2080. It represents a more heterogeneous world with continued increases in economic and population growth, and it is considered a realistic, but severe potential outcome.
2. Materials & Methods
2.1. Species Biology
Red Shiner’s native distribution falls within the Great Plains, American Southwest, and northern Mexico in tributaries of the middle and lower Mississippi River basin, and Gulf drainages westward to the Rio Grande, including several endorheic basins in Mexico [33] . Bait bucket [34] -[36] and aquarium releases are the primary vectors of Red Shiner introduction beyond this species’ native range [37] [38] . The fish is an aggressive invader via rapid multiplication, dispersal, and aggressive competition with native minnows [34] [39] . Red Shiner can dilute the gene pools of native Cyprinella through the formation of hybrid swarms [40] , and it has also displaced native fishes including Spikedace (Medafulgida (Girard 1856)), Woundfin (Plagopterusargentissimus (Cope 1874)), and Virgin River Chub (Gila seminude (Cope and Yarrow 1875)) [41] [42] through larval predation and direct competition for habitat use.
Shiners are generalists, but they occur primarily in creeks and small rivers. Like many minnows, Red Shiners are tolerant of harsh environmental conditions and degraded habitats, including low or intermittent flows, excessive turbidity and sedimentation, and natural physiochemical extremes [43] -[47] , but they are uncommon or absent from upland, clear water streams with moderate or high species richness [48] -[50] . Red Shiners can tolerate temperatures ranging from −21˚C to 10˚C, as well dissolved oxygen as low as 1.6 ppm [49] , and it has been observed in hot springs with temperatures as high as 39.5˚C [51] .
2.2. Occurrence Data
We compiled spatial occurrence data from within both the native and invaded ranges of Red Shiner (n = 3446). Native occurrence data were obtained from the global biodiversity information facility (accessed through the GBIF Data Portal, data.gbif.org, 2013-08-20), and records from within the species’ invaded range were compiled from the Nonindigenous Aquatic Species (NAS) database (http://nas.er.usgs.gov) (Figure 1). We included both native and non-native records because it encompassed the most comprehensive estimation of the species’ ecological niches. Ibañez et al. [52] highlighted the utility of this approach for modeling the potential distribution of alien invasive plants and Wolmarans et al. [53] demonstrated that modeling invasive species distributions using records from a species’ native and invaded range did not significantly affect model performance or result in overfitting.
2.3. Climatic Data
We used 19 current and future bioclimatic variables at a spatial resolution of 1 km that encompassed the native
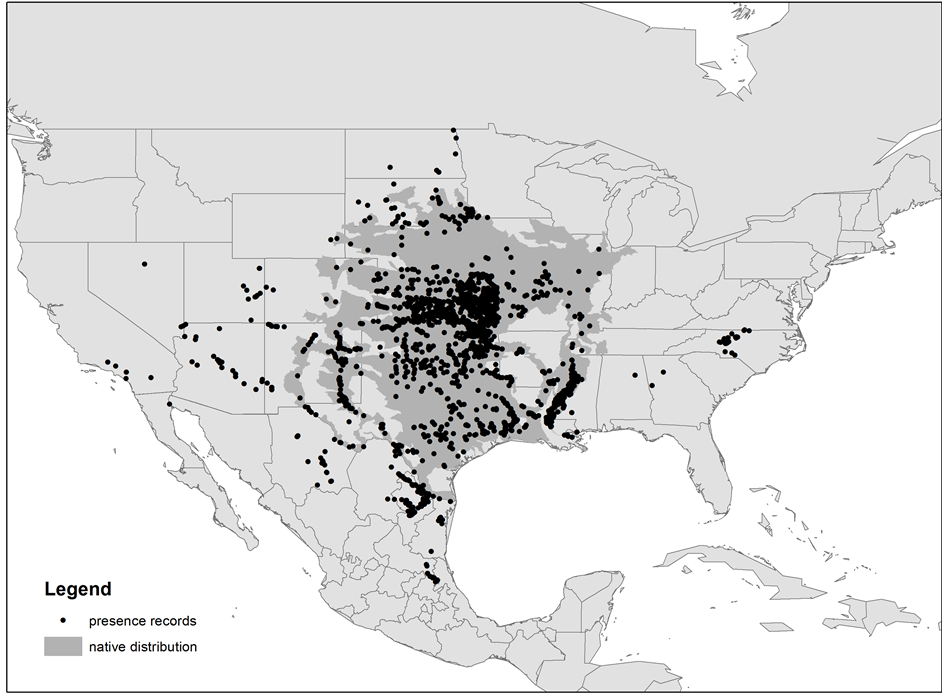
Figure 1. Spatial distribution of Red Shiner presence records. Native species’ records were obtained from the Global Biodiversity Information Facility (GBIF) and non-native records were compiled from the Nonindigenous Aquatic Species (NAS) database. The native distribution of Red Shiner in North America is shown in dark gray (Miller et al. 2005; NatureServe 2004).
and invaded range of Red Shiner using contemporary climatic data and the IPCC (2007) AR4 assessment data in the WorldClim database [54] (Table 1). We downloaded interpolations of the 19 bioclimatic variables from three climate models including: 1) CCCma-CGCM2 [55] [56] ; 2) CSIRO-MK2 [57] ; and 3) UKMO-HadCM3 [57] [58] . Grids were then clipped to the extent of the HydroSHEDS hydrography dataset for North America [59] to avoid modeling fish distributions outside riparian areas.
The entire dataset of raster predictor variables was reduced prior to model construction through individual variable evaluation and through pairwise evaluation to reduce multicollinearity among the predictors as suggested by Elith et al. [27] . We used the correlation matrix as a means of identifying highly correlated pairs of habitat predictors (r > 0.7). For correlated pairs, we removed the variable that captured less information or seemed the least biologically meaningful for the species. For example, if minimum temperature of the coldest month and mean temperature of the coldest quarter were highly correlated, we kept mean temperature of the coldest quarter since it captured a longer record of winter temperature as a whole.
2.4. CEM Modeling
We used Maxent 3.3.3k [31] to model the potential habitat of the two invaders under low and high CO2 emissions scenarios. We chose Maxent after evaluating the area under the receiver operator characteristic (AUC) curve and through visual map inspection after applying the sensitivity plus specificity thresholding of preliminary CEM models of Red Shiner potential distribution maps derived from one-class support vector machines [60] , GARP [61] , and DOMAIN [62] . We chose to use Maxent in our CEM modeling effort after finding that it was the highest performing individual modeling method for mapping Red Shiner potential distribution and based on results that demonstrated that ensemble modeling methods performed no better than using Maxent alone [30] . Maxent uses a deterministic algorithm that finds the optimal probability distribution (potential distribution) of a species across a study area based on a set of environmental constraints. Maxent determines the best potential distribution by selecting the most uniform distribution subject to the constraint that each environmental variable in the modeled distribution matches its empirical average over the known distributional data (i.e. presence data).
We developed maps for each climate model (CCCma, CSIRO, and HadCM3) and emissions scenario (A1B and B2) by randomly dividing our data into training and testing datasets comprising 70% and 30% of each data set, respectively. We supplied our own background points for the Maxent modeling effort, using a minimum

Table 1 . The 19 bioclimatic variables used for modeling the potential distribution of Red Shiner.
distance of 2 km to minimize issues associated with choosing background points from within the existing range of Red Shiner as suggested by [26] . We also experimented with using bias grids. We found that supplying bias grids to Maxent resulted in no improvement in model performance, so we ultimately chose not to include them in the final model outputs. Models calibrated under current climatic conditions were used to generate projections of future potential distributions for the year 2080 for each climate model and emissions scenario. Each analysis comprised ten replicates using a different set of randomly drawn presence points for training and validating the model. The products from each climate-emissions scenario combination were then averaged to generate a low and high emissions map for Red Shiner across North America.
Maxent model performance was evaluated by visual map inspection after thresholding using the sensitivity plus specificity criterion and by calculating an area under the receiver operating characteristic curve (AUC). The AUC is a threshold-independent measure of model performance that ranges from 0 to 1. Values > 0.9 indicate high accuracy, values of 0.7 - 0.9 indicate good accuracy, and values below 0.7 indicate low accuracy [63] . Average AUC values for the 10 runs of each independent model were reported. To estimate changes in Red Shiner distribution, we used a threshold to define habitat and non-habitat based on the Maxent model outputs. The threshold indicating maximum training sensitivity plus specificity is considered as a robust approach [64] , so we used this method to conduct the conversion into habitat distribution.
We also generated multivariate environmental similarity surfaces (“MESS” maps [sensu 27]) in Maxent by comparing the models’ reference climates (or background points) with the projection region under contemporary and future climate scenarios. MESS analysis applies a multidimensional rectangular environmental envelope to characterize the relative position of each grid cell relative to the center of the envelope. In this study, we transformed the MESS map output into a presence/absence map with a cut-off of 0 to identify areas with climatic conditions exceeding those of the training area. These areas describe where at least some degree of extrapolation by Maxent is required to make predictions.
3. Results
The potential Red Shiner distribution maps reached test AUC values above 0.92 (0.92 - 0.99 range), indicating good overall model performance (Table 2). All of the independent climate models from the future CCCma, CSIRO, and HadCM3 scenarios predicted increases in Red Shiner distribution under future climatic change (Figure 2). Red Shiner distributions were greater for the high emissions scenario (B2) than the more optimistic, low emissions scenario (A1B). Red Shiner showed a 10.2% (±4.4) change in distribution under the B2 scenario and a 41.7% (±7.1) increase in potential distribution under the A1B scenario.
Precipitation and temperature were the major variables influencing Red Shiner potential distribution (Table 3). Precipitation seasonality, maximum temperature of the warmest month, minimum temperature of the coldest month, and annual precipitation were the four most important predictors of Red Shiner distribution. The MESS analysis revealed areas in the model outputs containing non-analogous climatic conditions in the future climate models. Non-analogous climates refer to the extrapolation of models into environments unlike those characterizing the region in which the model was calibrated. The Red Shiner B2 model MESS analysis indicated that the majority of the areas within Red Shiner potential distribution were not highly extrapolated beyond the contemporary climate, although model predictions in limited regions of the Southwest and the Southeastern Coastal Plain differed from contemporary climatic conditions (Figure 2). Areas of the maps for Red Shiner that were outside its contemporary climatic envelope included southern California, the midwestern United States, Florida, large areas in Canada in the B2 model, and parts of Mexico and coastal Canada for the A1B model.
4. Discussion
It is increasingly imperative to understand potential invasive species range shifts in the face of global climatic change [65] [66] . Red Shiner is predicted to exhibit major increases in distribution under both low and high future carbon emissions scenarios. Our results support the contention that warming climates are likely to alter the existing constraints on invasive species distributions, invasion pathways, and river flow regimes [65] . Human transport of alien species due to longer shipping and recreation seasons in temperate regions will increase the movement of non-native propagules around the globe [66] . Increased drought and prolonged low river flows associated with climate change may enhance the establishment success of alien species that are tolerant of warm waters with low dissolved oxygen content like the Red Shiner. Similarly, potential changes in the timing and
Table 2 . The mean area under the curve (AUC) values and projected impacts of climate change for 2080 in terms of percent change in range size for Red Shiner under low (B2) and high (A1B) carbon emissions scenarios. Range size values are means for the three climate models with standard errors reported in brackets.
Table 3. Average percent contribution of the top four environmental predictor variables to the Maxent models. Percent contribution reports the gain of the model by including a particular variable at each step of the Maxent algorithm.

Figure 2. Model projections of Red Shiner potential distribution based on recent historical climates (contemporary), low future carbon emissions (B2), and high emissions (A1B) scenarios. The maps display the average habitat suitability from the three climate models, CCCma, CSIRO, and HadCM3. The color scale indicates relative habitat suitability which ranges from 0 to 1. Areas shaded in gray define regions with negative multivariate environmental similarity surface (MESS) values (i.e. extrapolation into novel climate space).
quantity of stream flow will likely influence invasive fish spread rates through river systems.
4.1. Distribution Maps
Potential distribution maps of invasive fishes under climatic change are useful for understanding the impacts of anthropogenic sources of global change on alien species ranges, and for predicting areas that will be susceptible to fish invasion in the future. Areas identified as having high invasion risk can be targeted to reduce human activities that facilitate the spread of invasives and as regions for surveillance for early invaders. Our results highlight the widespread increase in potential distribution of Red Shiner under future warmer climates which is consistent with the species’ tolerance of warm, turbid, and slow-flowing waters.
This work builds upon Poulos et al. [30] to highlight that much of North America will be vulnerable to invasion by Red Shiner under future climatic change according to our projections. The maps for this species suggest that it could spread well beyond its current distribution in the US and Mexico into the western US and much of Canada, with up to a 42% increase in Red Shiner distributions under future carbon emissions. While Poulos et al. [30] identified similar Red Shiner presence predictors under contemporary topo-climatic conditions (i.e. precipitation and summer temperature) to those of this study, our results highlight that Red Shiner can spread well beyond its potential range under contemporary climatic conditions even under the low emissions climate scenario. However, the MESS analysis revealed that portions of Canada may fall outside of the known climate space of our projections. These results also exceed predictions by Mohseni et al. [67] who predicted a 33% increase in the number of sites in the US that would be suitable for Red Shiner under a doubling of CO2 concentrations. Although, our model was based on land surface temperatures rather than water temperature, Red Shiner is the most thermotolerant minnow in North America [45] [51] , and the bioclimatic predictors in this model and prior work by Poulos et al. [30] indicate that this species has the potential to spread to other hot environments in the future.
Our results suggest that Red Shiner’s ability to outcompete [68] and hybridize with natives by creating introgressive hybrid swarms [69] -[72] may threaten native cyprinid congeners that are less thermotolerant in the future. Red Shiner expansion under climate change could also have large-scale impacts on the abundance and distribution of other native fishes because of its negative influences on native larval fish survival [47] [73] -[75] and habitat use [47] . Native species that are less equipped to tolerate changes in water conditions from climatic change may ultimately be displaced by aggressive invasive fishes such as the Red Shiner.
4.2. Model Uncertainties
Although the CEM results for Red Shiner displayed good overall performance with minimal extrapolation beyond current climatic conditions, both climate change projections and CEMs contain a range of uncertainties [27] [76] . It is widely acknowledged that CEMs provide simplified representations of the processes underlying species’ geographical distributions. Ensemble forecasts that use multiple climate models provide a framework for minimizing the uncertainties associated with CEM modeling. We approached this issue by applying two scenarios of the climate change story line (A1B and B1) [32] and three different climate models (CCCma, CSIRO, and HadCM3). Our use of the mean map outputs from multiple runs of the Maxent algorithm and the MESS map analysis allowed us to measure the amount of variability in the Maxent models and highlight areas of model extrapolation beyond the Red Shiner’s contemporary climatic envelope. Even after the implementation of these approaches, the MESS analysis identified some regions of Red Shiner model extrapolation in North America, particularly in parts of Canada well outside its current range and near the edges of its current distribution in the United States and Mexico.
4.3. Management Considerations
The future range expansion of the study species is a key consideration for the adaptive management of Red Shiner because future changes in climate will likely alter the effectiveness of existing control strategies [65] . Changes in water temperature and river flow dynamics due to future hotter and drier conditions could limit the effectiveness of common invasive fish control measures like biological control agents that may not have the same ecological tolerance as the invaders they consume. Rahel et al. [65] suggest that prioritizing the conservation of native species and maintaining natural flow rates may be a better strategy for dealing with invasive species under future climatic conditions. For example, Tyus and Saunders [77] indicate that increases in flow may be effective control measures for non-native cyprinids like Red Shiner that thrive in slow-flowing, turbid waters, and this may also enhance the success of native species adapted to natural flow regimes.
Acknowledgements
The authors wish to thank Pam Fuller of USGS and the Nonindigenous Aquatic Species database for assistance in compiling non-native Red Shiner distribution data. Support for this project was provided by a grant from the Mellon Foundation and support for Environmental Studies by Robert Schumann.
References
- Mack, R.N., Simberloff, D., Mark Lonsdale, W., Evans, H., Clout, M., et al. (2000) Biotic Invasions: Causes, Epidemiology, Global Consequences, and Control. Ecological Applications, 10, 689-710. http://dx.doi.org/10.1890/1051-0761(2000)010[0689:BICEGC]2.0.CO;2
- Vitousek, P.M., D’Antonio, C.M., Loope, L.L., Rejmanek, M., Westbrooks, R. (1997) Introduced Species: A Significant Component of Human-Caused Global Change. New Zealand Journal of Ecology, 21, 1-16.
- Stachowicz, J.J., Fried, H., Osman, R.W. and Whitlatch, R.B. (2002) Biodiversity, Invasion Resistance, and Marine Ecosystem Function: Reconciling Pattern and Process. Ecology, 83, 2575-2590. http://dx.doi.org/10.1890/0012-9658(2002)083[2575:BIRAME]2.0.CO;2
- Kelly, A.E. and Goulden, M.L. (2008) Rapid Shifts in Plant Distribution with Recent Climate Change. Proceedings of the National Academy of Sciences, 105, 11823-11826. http://dx.doi.org/10.1073/pnas.0802891105
- Parmesan, C., Yohe, G. (2003) A Globally Coherent Fingerprint of Climate Change Impacts across Natural Systems. Nature, 421, 37-42. http://dx.doi.org/10.1038/nature01286
- Bradley, B.A. (2009) Regional Analysis of the Impacts of Climate Change on Cheatgrass Invasion Shows Potential Risk and Opportunity. Global Change Biology, 15, 196-208. http://dx.doi.org/10.1111/j.1365-2486.2008.01709.x
- Sandra P., Carpenter, S. and Daily, G.C. (1997) Freshwater Ecosystem Services. Nature’s Services: Societal Dependence on Natural Ecosystems, 195-214.
- Cox, J.G. and Lima, S.L. (2006) Naiveté and an Aquatic-Terrestrial Dichotomy in the Effects of Introduced Predators. Trends in Ecology & Evolution, 21, 674-680. http://dx.doi.org/10.1016/j.tree.2006.07.011
- Gordon, D.R. (1998) Effects of Invasive, Non-Indigenous Plant Species on Ecosystem Processes: Lessons from Florida. Ecological Applications, 8, 975-989. http://dx.doi.org/10.1890/1051-0761(1998)008[0975:EOINIP]2.0.CO;2
- Wilcove, D.S., Rothstein, D., Dubow, J., Phillips, A. and Losos, E. (1998) Quantifying Threats to Imperiled Species in the United States. BioScience, 48, 607-615. http://dx.doi.org/10.2307/1313420
- Ricciardi, A. and MacIsaac, H.J. (2000) Recent Mass Invasion of the North American Great Lakes by Ponto-Caspian Species. Trends in Ecology & Evolution, 15, 62-65. http://dx.doi.org/10.1016/S0169-5347(99)01745-0
- Simon, K.S. and Townsend, C.R. (2003) Impacts of Freshwater Invaders at Different Levels of Ecological Organisation, with Emphasis on Salmonids and Ecosystem Consequences. Freshwater Biology, 48, 982-994. http://dx.doi.org/10.1046/j.1365-2427.2003.01069.x
- Strayer, D. (2010) Alien Species in Fresh Waters: Ecological Effects, Interactions with Other Stressors, and Prospects for the Future. Freshwater Biology, 55, 152-174. http://dx.doi.org/10.1111/j.1365-2427.2009.02380.x
- Baxter, C.V., Fausch, K.D., Murakami, M. and Chapman, P.L. (2004) Fish Invasion Restructures Stream and Forest Food Webs by Interrupting Reciprocal Prey Subsidies. Ecology, 85, 2656-2663. http://dx.doi.org/10.1890/04-138
- Van Riel, M., Van der Velde, G., Rajagopal, S., Marguillier, S., Dehairs, F., et al. (2006) Trophic Relationships in the Rhine Food Web during Invasion and after Establishment of the Ponto-Caspian Invader Dikerogammarus villosus. Hydrobiologia, 565, 39-58. http://dx.doi.org/10.1007/s10750-005-1904-8
- Guisan, A. and Zimmermann, N.E. (2000) Predictive Habitat Distribution Models in Ecology. Ecological Modelling, 135, 147-186. http://dx.doi.org/10.1016/S0304-3800(00)00354-9
- Kriticos, D., Randall, R., Groves, R., Panetta, F. and Virtue, J. (2001) A Comparison of Systems to Analyze Potential Weed Distributions. Weed Risk Assessment, 61-79.
- Thuiller, W., Richardson, D.M., Pyek, P., Midgley, G.F., Hughes, G.O., et al. (2005) Niche-Based Modelling as a Tool for Predicting the Risk of Alien Plant Invasions at a Global Scale. Global Change Biology, 11, 2234-2250. http://dx.doi.org/10.1111/j.1365-2486.2005.001018.x
- Thomas, C.D., Bulman, C.R. and Wilson, R.J. (2008) Where within a Geographical Range Do Species Survive Best? A Matter of Scale. Insect Conservation and Diversity, 1, 2-8. http://dx.doi.org/10.1111/j.1752-4598.2007.00001.x
- Araújo, M.B. and Peterson, A.T. (2012) Uses and Misuses of Bioclimatic Envelope Modeling. Ecology, 93, 1527-1539. http://dx.doi.org/10.1890/11-1930.1
- Filho, J.D., Nabout, J., Bini, L., Loyola, R., Rangel, T., et al. (2010) Ensemble Forecasting Shifts in Climatically Suitable Areas for Tropidacris cristata (Orthoptera: Acridoidea: Romaleidae). Insect Conservation and Diversity, 3, 213-221.
- Abrams, M.D. (1992) Fire and the Development of Oak Forests. BioScience, 42, 346-353. http://dx.doi.org/10.2307/1311781
- Rodda, G.H., Jarnevich, C.S. and Reed, R.N. (2011) Challenges in Identifying Sites Climatically Matched to the Native Ranges of Animal Invaders. PloS ONE, 6, e14670. http://dx.doi.org/10.1371/journal.pone.0014670
- Soberón, J. and Nakamura, M. (2009) Niches and Distributional Areas: Concepts, Methods, and Assumptions. Proceedings of the National Academy of Sciences, 106, 19644-19650. http://dx.doi.org/10.1073/pnas.0901637106
- Webber, B.L., Yates, C.J., Le Maitre, D.C., Scott, J.K., Kriticos, D.J., et al. (2011) Modelling Horses for Novel Climate Courses: Insights from Projecting Potential Distributions of Native and Alien Australian Acacias with Correlative and Mechanistic Models. Diversity and Distributions, 17, 978-1000. http://dx.doi.org/10.1111/j.1472-4642.2011.00811.x
- Elith, J., Phillips, S.J., Hastie, T., Dudík, M., Chee, Y.E., et al. (2011) A Statistical Explanation of MaxEnt for Ecologists. Diversity and Distributions, 17, 43-57. http://dx.doi.org/10.1111/j.1472-4642.2010.00725.x
- Elith, J., Kearney, M. and Phillips, S. (2010) The Art of Modelling Range-Shifting Species. Methods in Ecology and Evolution, 1, 330-342. http://dx.doi.org/10.1111/j.2041-210X.2010.00036.x
- Bond, N., Thomson, J., Reich, P. and Stein, J. (2011) Using Species Distribution Models to Infer Potential Climate Change-Induced Range Shifts of Freshwater Fish in South-Eastern Australia. Marine and Freshwater Research, 62, 1043-1061. http://dx.doi.org/10.1071/MF10286
- Buisson, L., Thuiller, W., Lek, S., Lim, P. and Grenouillet, G. (2008) Climate Change Hastens the Turnover of Stream Fish Assemblages. Global Change Biology, 14, 2232-2248. http://dx.doi.org/10.1111/j.1365-2486.2008.01657.x
- Poulos, H.M., Chernoff, B., Fuller, P.L. and Butman, D. (2012) Mapping the Potential Distribution of the Invasive Red Shiner, Cyprinella lutrensis (Teleostei: Cyprinidae) across Waterways of the Conterminous United States. Aquat Invasions, 7, 377-385.
- Phillips, S.J., Anderson, R.P. and Schapire, R.E. (2006) Maximum Entropy Modeling of Species Geographic Distributions. Ecological Modeling, 190, 231-259. http://dx.doi.org/10.1016/j.ecolmodel.2005.03.026
- Solomon, S. (2007) Climate Change 2007—The Physical Science Basis: Working Group I Contribution to the 4th Assessment Report of the IPCC. Cambridge University Press, Cambridge.
- Council) DDF (2010) Cyprinella lutrensis—Red Shiner Range Map in the Desert Fishes Council Index to Fish Images, Maps, and Information.
- Hubbs, C. and Lagler, K. (1964) Fish of the Great Lake Region. University of Michigan Press, Arbor.
- Jennings, M.R. and Saiki, M. (1990) Establishment of Red Shiner, Notropis lutrensis, in the San Joaquin Valley, California. California Fish and Game, 76, 46-57.
- Walters, D.M., Blum, M.J., Rashleigh, B., Freeman, B.J., Porter, B.A., et al. (2008) Red Shiner Invasion and Hybridization with Blacktail Shiner in the Upper Coosa River, USA. Biological Invasions, 10, 1229-1242. http://dx.doi.org/10.1007/s10530-007-9198-6
- Moore, R.H., Garrett, R.A. and Wingate, P.J. (1976) Occurrence of the Red Shiner, Notropis lutrensis, in North Carolina: A Probable Aquarium Release. Transactions of the American Fisheries Society, 105, 220-221. http://dx.doi.org/10.1577/1548-8659(1976)105<220:OOTRSN>2.0.CO;2
- Jenkins, R.E. and Burkhead, N.M. (1994) Freshwater Fishes of Virginia. American Fisheries Society.
- Minckley, W. and Deacon, J.E. (1968) Southwestern Fishes and the Enigma of “Endangered Species”. Science, 159, 1424-1432. http://dx.doi.org/10.1126/science.159.3822.1424
- Mettee, M.F., O’Neil, P.E. and Pierson, J.M. (1996) Fishes of Alabama and the Mobile Basin. Oxmoor House, Birmingham.
- Moyle, P.B. (2002) Inland Fishes of California. University of California Press, Oakland.
- Deacon, J.E. (1988) The Endangered Woundfin and Water Management in the Virgin River, Utah, Arizona, Nevada. Fisheries, 13, 18-24. http://dx.doi.org/10.1577/1548-8446(1988)013<0018:TEWAWM>2.0.CO;2
- Cross, F.B. (1967) Handbook of Fishes of Kansas.
- Sublette, J. (1975) The Summer Food Habits of Notropis lutrensis, the Red Shiner. New Mexico Academy of Science, 16, 20.
- Matthews, W.J. and Hill, L.G. (1979) Influence of Physico-Chemical Factors on Habitat Selection by Red Shiners, Notropis lutrensis (Pisces: Cyprinidae). Copeia, 1979, 70-81. http://dx.doi.org/10.2307/1443731
- Baltz, D.M. and Moyle, P.B. (1993) Invasion Resistance to Introduced Species by a Native Assemblage of California Stream Fishes. Ecological Applications, 3, 246-255. http://dx.doi.org/10.2307/1941827
- Douglas, M.E., Marsh, P.C. and Minckley, W. (1994) Indigenous Fishes of Western North America and the Hypothesis of Competitive Displacement: Meda fulgida (Cyprinidae) as a Case Study. Copeia, 1994, 9-19. http://dx.doi.org/10.2307/1446665
- Matthews, W.J. (1985) Distribution of Midwestern Fishes on Multivariate Environmental Gradients, with Emphasis on Notropis lutrensis. American Midland Naturalist, 113, 225-237. http://dx.doi.org/10.2307/2425568
- Matthews, W.J. and Hill, L.G. (1977) Tolerance of the Red Shiner, Notropis lutrensis (Cyprinidae) to Environmental Parameters. The Southwestern Naturalist, 22, 89-98. http://dx.doi.org/10.2307/3670466
- Yu, S.L. and Peters, E.J. (2002) Diel and Seasonal Habitat Use by Red Shiner (Cyprinella lutrensis). Zoological Studies (Taipei), 41, 229-235.
- Brues, C.T. (1928) Studies on the Fauna of Hot Springs in the Western United States and the Biology of Thermophilous Animals. Proceedings of the American Academy of Arts and Sciences, 63, 139-228.
- Ibáez, I., Silander Jr., J.A., Wilson, A.M., LaFleur, N., Tanaka, N., et al. (2009) Multivariate Forecasts of Potential Distributions of Invasive Plant Species. Ecological Applications, 19, 359-375. http://dx.doi.org/10.1890/07-2095.1
- Wolmarans, R., Robertson, M.P. and van Rensburg, B.J. (2010) Predicting Invasive Alien Plant Distributions: How Geographical Bias in Occurrence Records Influences Model Performance. Journal of Biogeography, 37, 1797-1810. http://dx.doi.org/10.1111/j.1365-2699.2010.02325.x
- Hijmans, R.J., Cameron S.E., Parra, J.L., Jones, P.G. and Jarvis, A. (2005) Very High Resolution Interpolated Climate Surfaces for Global Land Areas. International Journal of Climatology, 25, 1965-1978. http://dx.doi.org/10.1002/joc.1276
- Flato, G. and Boer, G. (2001) Warming Asymmetry in Climate Change Simulations. Geophysical Research Letters, 28, 195-198. http://dx.doi.org/10.1029/2000GL012121
- Flato, G.M., Boer, G., Lee, W., McFarlane, N., Ramsden, D., et al. (2000) The Canadian Centre for Climate Modelling and Analysis Global Coupled Model and Its Climate. Climate Dynamics, 16, 451-467. http://dx.doi.org/10.1007/s003820050339
- Gordon, H.B. and O’Farrell, S.P. (1997) Transient Climate Change in the CSIRO Coupled Model with Dynamic Sea Ice. Monthly Weather Review, 125, 875-908. http://dx.doi.org/10.1175/1520-0493(1997)125<0875:TCCITC>2.0.CO;2
- Pope, V., Gallani, M., Rowntree, P. and Stratton, R. (2000) The Impact of New Physical Parametrizations in the Hadley Centre Climate Model: HadAM3. Climate Dynamics, 16, 123-146. http://dx.doi.org/10.1007/s003820050009
- Lehner, B., Verdin, K. and Jarvis, A. (2008) New Global Hydrography Derived from Spaceborne Elevation Data. EOS, Transactions American Geophysical Union, 89, 93-94. http://dx.doi.org/10.1029/2008EO100001
- Chang, C.C. and Lin, C.J. (2011) LIBSVM: A Library for Support Vector Machines. ACM Transactions on Intelligent Systems and Technology (TIST), 2, Article No. 27. http://dx.doi.org/10.1145/1961189.1961199
- Stockwell, D. (1999) The GARP Modelling System: Problems and Solutions to Automated Spatial Prediction. International Journal of Geographical Information Science, 13, 143-158. http://dx.doi.org/10.1080/136588199241391
- Carpenter, G., Gillison, A. and Winter, J. (1993) DOMAIN: A Flexible Modelling Procedure for Mapping Potential Distributions of Plants and Animals. Biodiversity & Conservation, 2, 667-680. http://dx.doi.org/10.1007/BF00051966
- Swets, J.A. (1988) Measuring the Accuracy of Diagnostic Systems. Science, 240, 1285-1293. http://dx.doi.org/10.1126/science.3287615
- Liu, C., Berry, P.M., Dawson, T.P. and Pearson, R.G. (2005) Selecting Thresholds of Occurrence in the Prediction of Species Distributions. Ecography, 28, 385-393. http://dx.doi.org/10.1111/j.0906-7590.2005.03957.x
- Rahel, F.J. and Olden, J.D. (2008) Assessing the Effects of Climate Change on Aquatic Invasive Species. Conservation Biology, 22, 521-533. http://dx.doi.org/10.1111/j.1523-1739.2008.00950.x
- Hellmann, J.J., Byers, J.E., Bierwagen, B.G. and Dukes, J.S. (2008) Five Potential Consequences of Climate Change for Invasive Species. Conservation Biology, 22, 534-543. http://dx.doi.org/10.1111/j.1523-1739.2008.00951.x
- Mohseni, O., Stefan, H.G. and Eaton, J.G. (2003) Global Warming and Potential Changes in Fish Habitat in U.S. Streams. Climatic Change, 59, 389-409. http://dx.doi.org/10.1023/A:1024847723344
- Greger, P.D. and Deacon, J.E. (1988) Food Partitioning among Fishes of the Virgin River. Copeia, 1988, 314-323. http://dx.doi.org/10.2307/1445871
- Burr, B.M. and Page, L.M. (1986) Zoogeography of Fishes of the Lower Ohio-Upper Mississippi Basin. The Zoogeography of North American Freshwater Fishes, 287-324.
- Larimore, R.W. and Bayley, P.B. (1996) The Fishes of Champaign County, Illinois: During a Century of Alterations of a Prairie Ecosystem: Illinois Natural History Survey.
- Blum, M.J., Walters, D.M., Burkhead, N.M., Freeman, B.J. and Porter, B.A. (2010) Reproductive Isolation and the Expansion of an Invasive Hybrid Swarm. Biological Invasions, 12, 2825-2836. http://dx.doi.org/10.1007/s10530-010-9688-9
- Ward, J.L., Blum, M.J., Walters, D.M., Porter, B.A., Burkhead, N., et al. (2012) Discordant Introgression in a Rapidly Expanding Hybrid Swarm. Evolutionary Applications, 5, 380-392. http://dx.doi.org/10.1111/j.1752-4571.2012.00249.x
- Ruppert, J.B., Muth, R.T. and Nesler, T.P. (1993) Predation on Fish Larvae by Adult Red Shiner, Yampa and Green Rivers, Colorado. The Southwestern Naturalist, 38, 397-399. http://dx.doi.org/10.2307/3671627
- Gido, K.B., Schaefer, J.F., Work, K., Lienesch, P.W., Marsh-Matthews, E. and Matthews, W.J. (1999) Effects of Red Shiner (Cyprinella lutrensis) on Red River Pupfish (Cyprinodon rubrofluviatilis). The Southwestern Naturalist, 44, 287-295.
- Marsh-Matthews, E. and Matthews, W.J. (2000) Spatial Variation in Relative Abundance of a Widespread, Numerically Dominant Fish Species and Its Effect on Fish Assemblage Structure. Oecologia, 125, 283-292. http://dx.doi.org/10.1007/s004420000452
- Beaumont, L.J., Hughes, L. and Pitman, A. (2008) Why Is the Choice of Future Climate Scenarios for Species Distribution Modelling Important? Ecology Letters, 11, 1135-1146.
- Tyus, H.M. and Saunders, J.F. (2000) Nonnative Fish Control and Endangered Fish Recovery: Lessons from the Colorado River. Fisheries, 25, 17-24. http://dx.doi.org/10.1577/1548-8446(2000)025<0017:NFCAEF>2.0.CO;2
NOTES

*Corresponding author.