Open Journal of Ecology
Vol.4 No.3(2014), Article ID:43736,11 pages DOI:10.4236/oje.2014.43013
Growth and Development of Cyperus papyrus in a Tropical Wetland
Alfonse Opio1*, Mike B. Jones2, Frank Kansiime3, Tom Otiti4
1Department of Biology, Faculty of Science, Gulu University, Gulu, Uganda
2Department of Botany, School of Natural Sciences, Trinity College Dublin, Dublin 2, Ireland
3Department of Environmental Management, College of Agriculture and Environmental Sciences, Makerere University, Kampala, Uganda
4Department of Physics, College of Natural Sciences, Makerere University, Kampala, Uganda
Email: *alfonseopio@gmail.com
Copyright © 2014 by authors and Scientific Research Publishing Inc.
This work is licensed under the Creative Commons Attribution International License (CC BY).
http://creativecommons.org/licenses/by/4.0/


Received 11 November 2013; revised 11 December 2013; accepted 17 December 2013
ABSTRACT
Relative growth rate (RGR) is an important parameter in plant growth models. However, no field measurements of RGR have been made in Cyperus papyrus (papyrus) wetlands. In this study, the growth dynamics of aerial shoots were investigated in a tropical papyrus wetland. The aim was to estimate temporal changes in the growth rates, and also establish the effect of water level and temperature change on total culm number, culm recruitment and senescence. Dry weights of shoots during their life cycle were determined using a non-destructive method after establishment of relationship between culm diameter and dry weight. Measurements were made over period of seven months. During the course of the measurements, culm density significantly increased from 16.1 to 35.9 culms∙m−2. There were significant changes in both culm recruitment and senescence. Maximum RGR of developing culms was 1.04 g g−1 d−1. Using a culm density of 27 per m−2, productivity range was 16.74 to 37.37 g m−2 d−1. There was an inverse and significant relationship between rate of change in leaf weight ratio (LWR) and RGR of the culms. In conclusion, RGR of the aerial shoot development was controlled by rate of change in LWR from 41 to 156 days of growth. There was a strong and negative influence of water level fluctuation on total culm density.
Keywords:Cyperus papyrus; Growth Analysis; Wetland

1. Introduction
Cyperus papyrus (papyrus) is a large herbaceous sedge commonly found in waterlogged environments in the African tropics. These wetland ecosystems provide ecological and socio-economic services related to the harvesting of aerial biomass, wastewater treatment, hydrological functions and climate modification [1] . It has been suggested that removal of large quantities of nutrients associated with papyrus harvesting results in reduced production rates in subsequent re-growth periods [2] . In addition, negative influences of frequent and indiscriminant harvesting on growth of aerial biomass have been reported [3] -[5] . Therefore, in order to achieve sustainable production, there should be a suitable management program to regulate harvesting [3] [5] . This could maximize wetlands potential as carbon sink [1] .
For sound management, there is need to understand the growth and development which form the basic components of plant population dynamics [6] . In papyrus wetlands, the aerial structure (shoot) consists of sheath, culm and umbel (Figure 1).
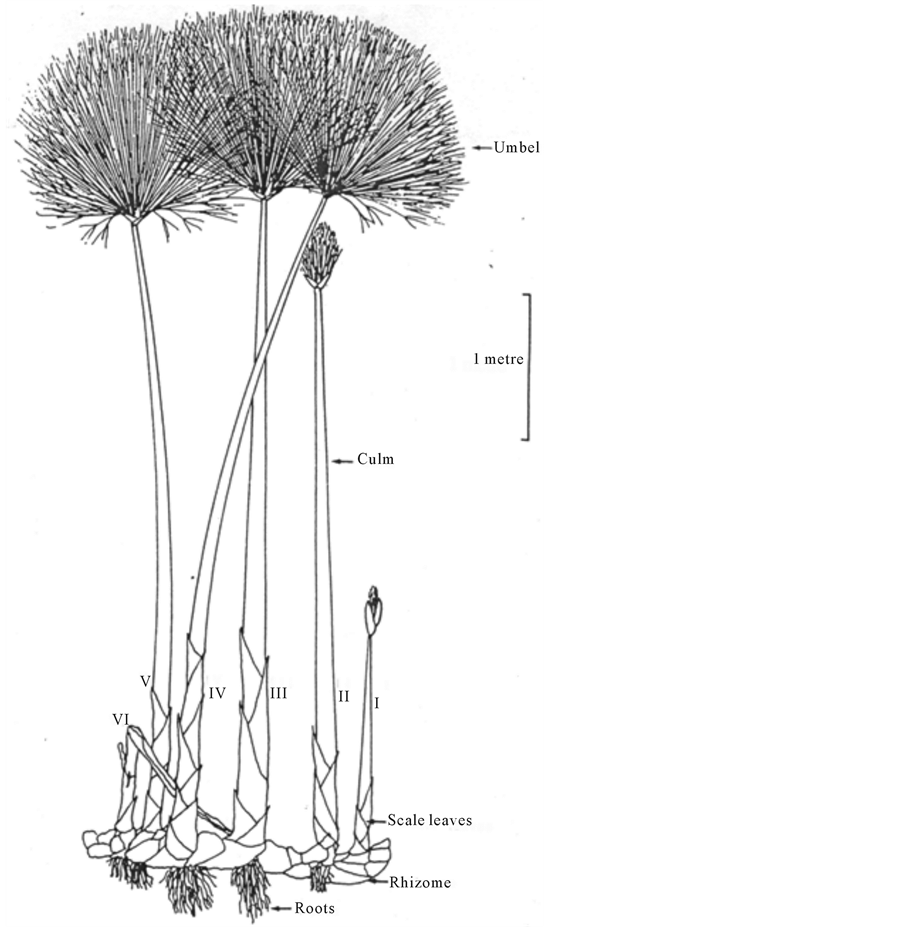
Figure 1. A Cyperus papyrus plant showing, on a single rhizome, the typical range of the culm units of increasing age from I to VI [7] .
During development, the vegetative shoot grows out from the rhizome with the umbel fully enclosed in a sheath. The sheath surrounds the base of the culm in later growth stages. The developing papyrus goes through different growth stages starting as young elongating culms with closed umbels, then elongating culms with umbels just opening, fully elongated culms and fully expanded umbels, senescent culms (≤ 40% achlorophyllous) and finally dead culms (≥60% achlorophyllous).
Tropical wetlands are often unstable environments and in particular they are subject to substantial water level fluctuation [8] -[10] . However, the loose structure of the floating papyrus rhizomes allows a free exchange of water and dissolved matter from underneath into the rhizome mat [11] . The effect of these fluctuations in water level on the natural regeneration of papyrus is unknown, although natural regenerative capacity is known to be influenced by water depth [12] .
The potential economic importance of papyrus wetlands has stimulated many studies on growth and development of the vegetation. These studies have shown that papyrus wetlands are characterized as having regular turnover of individual plant units [3] . However, estimates of growth rate of single shoots in terms of relative growth rate (RGR) [13] have not been made although measures of absolute growth rates of unit area have been a common comparison tool for performance in different wetlands [14] -[17] . Growth rates can be determined using culm-girth biomass relationships [3] [18] . An effort in understanding how RGR of the papyrus depends partly on the umbels and how actual value of RGR at an instant of time depends on the amount of foliage which presented at that time is an important aspect of their physiology.
RGR or growth efficiency index expresses growth in terms of a rate increase in size per unit of size and is an important parameter in plant growth models [19] [20] . This study is a growth analysis using biomass data of aerial shoot of C. papyrus. Mathematical equations in the form of fitted functions have been employed to analyze time series of dry weight [21] -[23] . The objective of this investigation was to estimate the temporal changes in growth and development in a papyrus wetlands. This involved determining the pattern of individual papyrus shoot relative growth rates. In addition, measurement of leafiness was made by determining the LWR over time. The effect of some environmental variables on culm recruitment and senescence, and total culm density was also investigated. It was hypothesized that growth rate of shoots and their total culm density, recruitment and senescence are dependent on water level and water temperature variation in the wetland.
2. Materials and Methods
2.1. Study Area
The study was conducted in Lubigi C. papyrus wetland in Kampala District, Uganda. The wetland is located at 7.5 km West of Kampala City in Kawempe Division 0˚17′ N to 0˚22′ N and 32˚30′ E to 32˚34′ E (Figure 2). The wetland has a tropical wet and dry climate with daily average temperature ranging from 17˚C to 27˚C during the year. Rainy seasons are from August-December and March-May of each year, however, delay in onset of rainfall has been observed in recent years.
2.2. Numbers of Total, Recruited and Senescencing Culms
Measurements were made along a 900 m transect in the wetland (Figure 2). The different culms categories in eight (8) replicates of 3 × 3 m2 quadrats along the transect were counted and marked. The cut transect provided an access into the wetland using a ladder lying on the papyrus mat constructed from eucalyptus poles. New shoots, mature and senescence culms were identified at each sampling time. Recruits were all the papyrus culms that appeared and had not been marked at the previous sampling time. Senescent culms were those that were 40% achlorophyllous while mature culms were those between senescence and newly recruited. The changes were monitored for a period of seven (7) months from October, 2010 to April, 2011 at an interval of at most two weeks.
2.3. Assessment of Relationship between Aerial Shoot Biomass and Culm-Girth
Culm-girth was measured at the top of the sheathing leaves. One hundred and twenty culm units from along the transect were cut at rhizome level after which girth measurements was made. They were taken to laboratory at Makerere University, Department of Environmental Management for drying to constant weight at 80˚C. A relationship between culm-girth and dry weight measurements of aerial shoots and their umbels was determined by regression analysis.
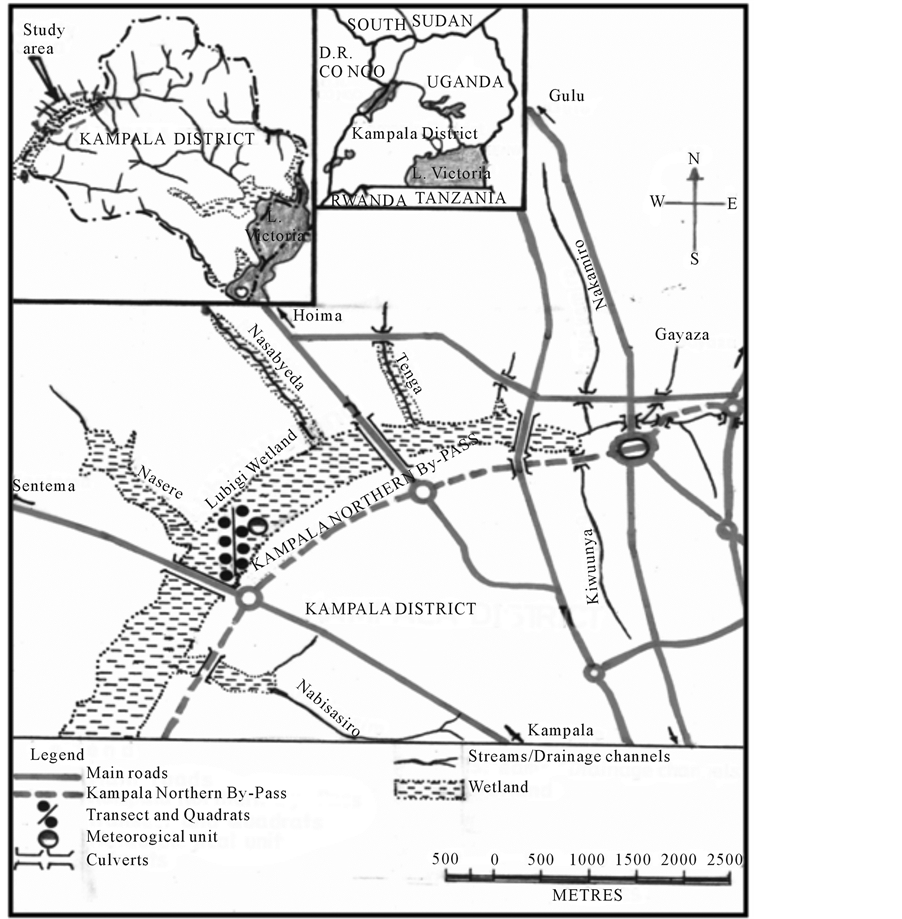
Figure 2. Location of transect and productivity quadrats in Lubigi wetland in Kampala District, Uganda.
2.4. Assessment of Biomass Pattern in the Shoots
Thirty five (35) uniform sprouting aerial shoots with their umbels enclosed in sheath were selected for growth assessment at the start of the measurement period. The sprouting shoots were randomly selected along a 900 m transect and were tagged. The biomass of the selected papyrus aerial shoots and their respective umbels was estimated non-destructively at an interval of at least two weeks.
2.5. Assessment of Growth Rates of the Aerial Shoots
Biomass data of the shoots were entered into the Spline growth analysis program [21] [22] . The program software was downloaded from people.exeter.ac.uk. The latest version of Spline growth analysis is a Windows 95/98/XP edition of the stepwise polynomial regression program. It automatically transforms biomass data in grams into log transformation. The program was set to allow the system to calculate the number of separately identifiable points defined by the time of growth period over the range of biomass data. All times (days) were expressed taking 12th February, 2012 as day zero of the measurement. Results of RGR and LWR were automatically generated in tabular form.
2.6. Environmental Measurements
Changes in water level were determined using three (3) long slotted perforated polyvinyl carbon (PVC) tubes inserted firmly through the mat into the peat sediment layer. The perforation allowed water to enter the tube to attain the same level as the water outside the tube. A dry culm was lowered into the tube and the level where it became wet was measured from the top end of the tube (reference point). Water level variation was the difference between each successive measurement taking the top level of the tube as reference point.
In situ measurements of water temperature were made using a portable meter probe (Eutech Instrument, Cyberscan, PC 300) inserted in holes drilled in the wetland. Readings were taken at 10 cm below the papyrus mat surface.
2.7. Statistical Analysis
Minitab software, Release 13 for windows was used for statistical analyses. One-way factor analysis for culm numbers, water temperature and water level fluctuations was performed. Data were tested for equal variance and normality using Bartlett’s and Levene’s Tests, and Anderson Darling Test respectively and all data that did not conform to the requirements were transformed. Non-parametric Kruskal-Wallis test was used to assess differences in RGR and leaf weight ratio (LWR) of aerial shoot during the culm life cycle. Pearson correlation was used to examine the relationship of water temperature and water level fluctuation with recruitment, mature and senescencing culms. All statistical values were considered significant at less than 0.05 confidence limit.
3. Results
3.1. Variation of Water Level and Temperature in the Wetland
Figure 3 shows water level fluctuation and water temperature changes in the wetland between October, 2010 and April, 2011.
Water level rise during flooding was characterized by subsurface flow in the wetland and open water channels were formed in some areas. In general, water level drawdown in the wetland was higher than water level rise.
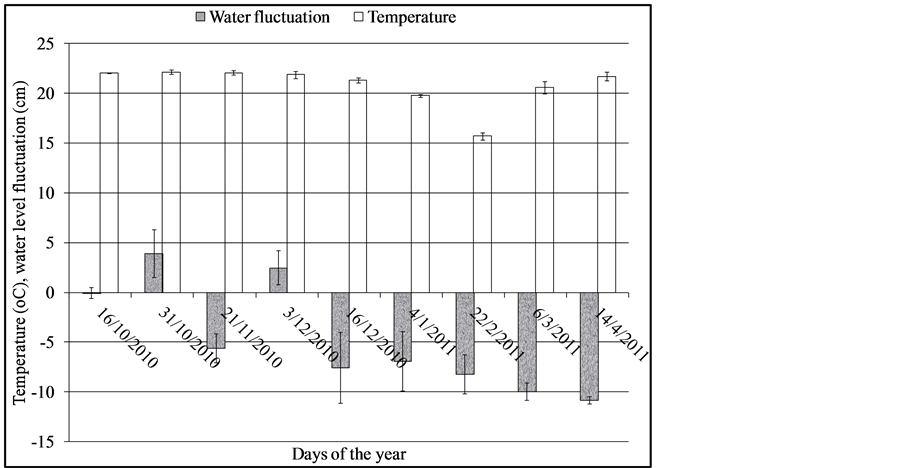
Figure 3. Water level and water temperature fluctuations in the wetland. Error bars are standard error of means (n = 3). Negative values indicate water level drop and positive value water level rise.
Statistical analysis of water level change indicated significant differences in water level fluctuation (F = 11.78, DF = 8, p = 0.00 respectively). Temperature was relatively constant except for values on 22/2/2011 that showed a lower value. Water temperature was not significantly different between the days of the year (F = 3.45, DF = 8, p = 0.019).
3.2. Relationship of Aerial Shoot Biomass and Culm-Girth
The fitted relationship between measured dry weight of individual aerial shoots and culm circumference for wide range of culm-girths is presented in Figure 4.
The relationship was highly significant (F = 569.3, r2 = 0.837, p = 0.00). Prediction errors for shoot biomass increased with increasing culm-girth sizes but was below 15% for culm-girth size of 17 cm. The relationship between umbels dry weight and culm-girth is presented in Figure 5 (H = 379.21, r2 = 0.775, p = 0.00).
Prediction errors for umbels biomass increased with culm-girth sizes but were below 15% for culm-girth size of 17 cm. Gradient (slope) of culm-girth biomass relationships show higher slope (3.09) for umbel compared to the shoot (2.83), meaning umbel growth rate was higher than culm growth rate.
3.3. Biomass Accumulation and Growth Rates of Aerial Shoots of C. papyrus
The mean biomass changes in the shoots (sheath + culm + umbel) and umbels during the life cycle are presented in Figure 6.
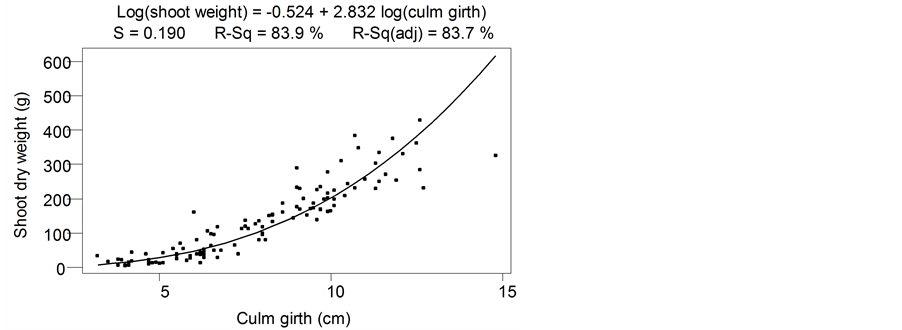
Figure 4. Relationship between culm-girth and dry weight of aerial shoots of C. papyrus in Lubigi wetland.
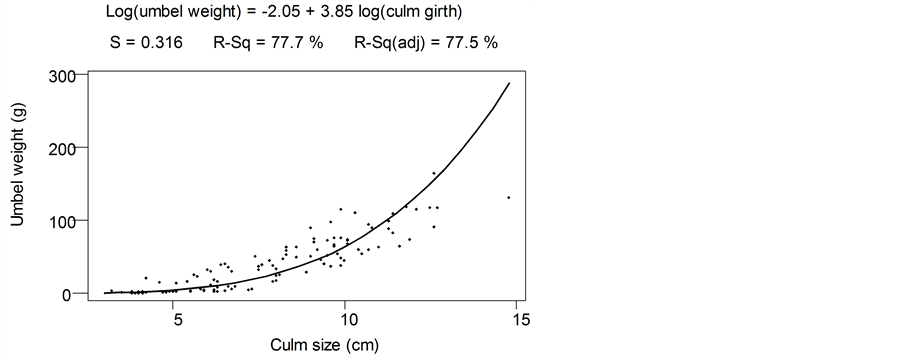
Figure 5. Relationship of C. papyrus culm-girth with umbels dry biomass in Lubigi wetland.
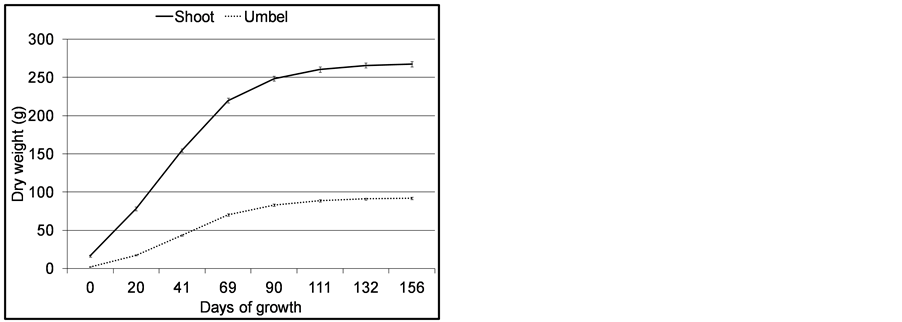
Figure 6. Dry weight of C. papyrus shoot (culm unit) and umbels in Lubigi wetland. Error bars are standard errors of means (n = 35).
The overall pattern of shoot biomass production was characterized by a sigmoid relationship. Biomass showed a steady increase up to 70 days and declined thereafter. The Spline program indicated 44 and 72 days as points of change in biomass trend corresponding to 1.5 and 2.5 months of growth. This is the phase of exponential growth. Mean biomass values at senescence were 267.51 ± 3.44 g and 91.74 ± 1.59 g for shoot and umbel respectively. The patterns of RGR of aerial shoots and umbels during their growing cycle are presented in Figure 7.
Both umbel and shoot RGRs exhibited reversed J-shape trend with minimum values observed after 132 and 156 days of growth respectively. Overall, there was no significant difference between shoot and umbel RGR (H = 0.53, DF = 1, p = 0.480). Statistics (H-value) is of transformed data and is equivalent to 0.037 d−1 of untransformed value. The high variability of RGR at the start and end of the experiment is attributed to errors in measurements during sprouting and senescence of the culms. This implies more resource was used to increase dry weight by the umbel which is the photosynthesing organ.
To show how papyrus shoots develop leafiness the leaf weight ratio (LWR) was used (Figure 8).
LWR increased to constant level after 111 days of growth, which shows the umbels were fully developed by that time. The maximum percentage biomass resource allocation in the umbel was approximately 33% of the total shoot.
3.4. Culms Density
Culm density increased from 16.1 to 35.93 culm∙m−2. The variation in numbers of recruited, senescent and total culms in the wetland during the days of the year is shown in Figure 9.
Total culm density increment over the period was significantly different (F = 1.84, DF = 16, p = 0.00). Statistical comparison indicated that total culm density from the 22/1/2011 to 14/4/2011 (dry season) as similar but was significantly higher compared to the rest of the days of the year. Recruitment of culms and senescence were low between 16/12/2010 to 18/2/2011. Mean recruitment and senescence were 1.58 ± 0.18 (n = 8) culm m−2 week−1 and 0.61 ± 0.08 (n = 8) culm m−2 week−1 with ranges of 1.01 - 2.6 culm m−2 week−1 and 0.2 - 1.1 culm m−2 week−1 respectively. Recruitment and senescence were not significantly different between the days of the year (F = 9, DF = 9, p = 0.437 respectively). There is general indication of similar pattern in recruitment and senescence over the period. The relationship of recruitment and senescence was significant and strong (r = 0.607, p = 0.063).
The influence of water temperature and water level fluctuation on total culm density and recruitment and senescence was investigated. The result is shown in Table 1.
Water level fluctuation and temperature had weak positive effects on senescence and recruitment. Total culm density exhibited a strong and negative relationship with water level and temperature change.
4. Discussion
The structure of the Cyperus papyrus community investigated here was similar to that reported by [3] with a
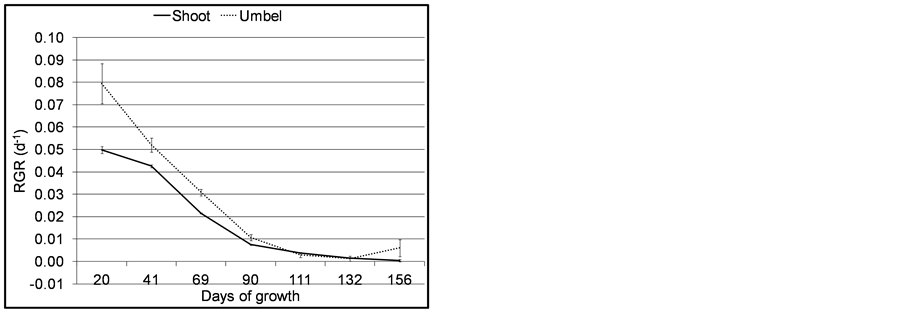
Figure 7. Mean RGR of umbel and shoot of C. papyrus in Lubigi wetland. Error bars are standard errors of means (n = 35).
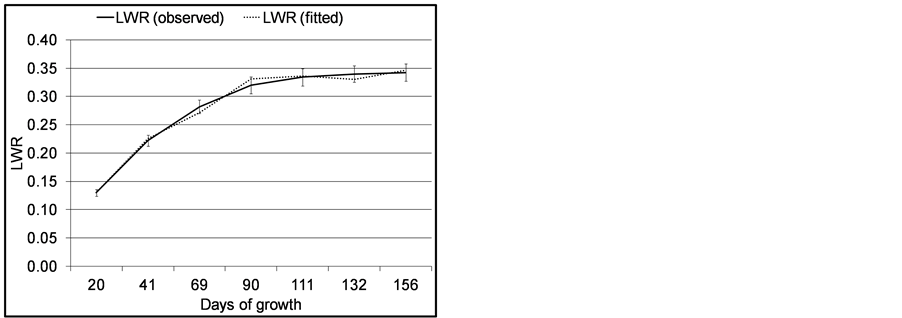
Figure 8. Leaf (bracteole) weight ratio (LWR) of C. papyrus in Lubigi wetland. Error bars are standard errors of means (n = 35).
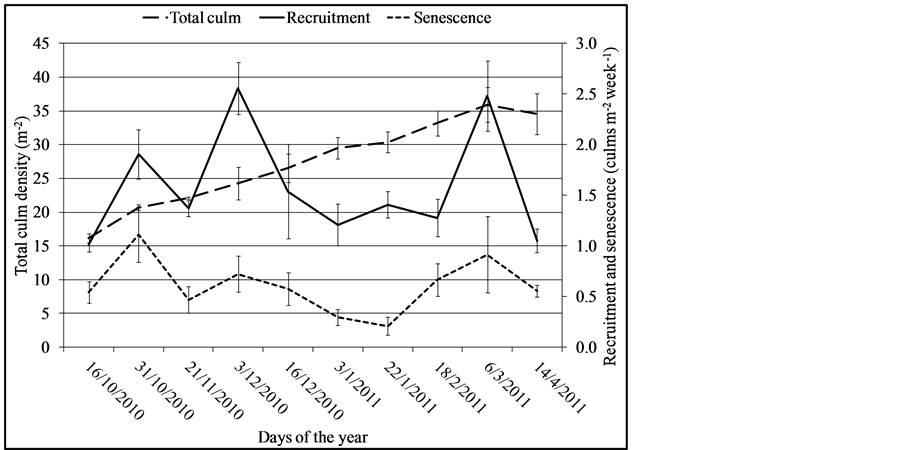
Figure 9. Recruited and senescence culms densities of Cyperus papyrus in the wetland. Error bars are standard error of means (n = 8).

Table 1. Pearson correlation statistics between water temperature, water level change, culm senescence, culm recruitment and total culm density in the wetland.
continuous process of recruitment, growth and senescence of culms. The mean culm density was 27.3 ± 2.1 culms m−2 at Lubigi wetland. While is undisturbed environments of Lake Naivasha, Kenya, it varied between 9.2 ± 0.7 to 12.7 ± 0.7 culms m−2 [3] [24] . [25] reported 22.1 ± 1.6 culms m−2 in Kirinya West in Jinja, Uganda; but much higher values of 117 ± 18 culm m−2 were recorded in Rubondo Island, Lake Victoria in Tanzania [26] . Senescence rate of 0.61 ± 0.08 culm m−2 week−1 at Lubigi wetland was lower than the 3.75 ± 2.3 culm m−2 week−1 in Rubondo Island. Generally, senescence has profound effect on culm density [27] and results here indicate significantly strong relationships between recruitment and senescence (r = 0.675, p = 0.046). The strong relationship between recruitment and senescence (r = 0.607) implies senescence created space for culm recruitment.
Despite Lubigi wetland being in an urban settlement and receiving most of water from the catchment in form of wastewater discharge as surface runoff, water level change within the wetland was significant. Wetlands in depressions are usually characterized with small catchments drain and most vulnerable to temperature change [28] . This is due to dependence of water availability control from outside factors like physical development, topographic nature and the existing drainage systems. These form the major causes of the flash flooding in Lubigi catchment [29] . The relationship between temperature, and senescence and recruitment was small and not statistically significant (Table 1). Water level fluctuation was therefore the key factor in the development of total culm density.
Development of established papyrus shoot (dry weight) followed a normal classical trend for plants under any productive condition and exhibited shifts in RGR and LWR. That is why lifetime of about 90 days of individual culms was found to exist in Upemba basin, Zaire [30] and approximately 180 days in papyrus swamp of Lake Naivasha, Kenya [3] . In Lubigi wetland culm senescence was estimated at 132 days when the umbel brown colour appeared. Culm survival is therefore a result of sustained RGR and LWR, and natural senescence is a phenomenon of steady state which contributes to regular culm turn over [3] . [31] reported a similar phenomenon in flooded Bulrush rhizomes Schoenoplectus lacustris (L.) PALLA.
Relative growth rate (RGR) has been used as an assessment of simple growth rate to separate environmental induced differences from size induced differences [32] . Therefore, earlier biomass use in growth is attributed to some reserves net assimilation in the rhizomes that enhance growth during the period. This is because changes in LWR were not significantly different during the life cycle (p = 0.423) and had negligible interrelation and effect on each other during the period (r = 0.076, covariance = 0.00). The maximum RGR value was 1.04 g g−1 d−1. The RGR of the papyrus is higher than the range of 0.11 - 0.33 g g−1 d−1 reported for C3 non woody plants [33] [34] . The potential productivity range of 16.74 - 37.37 g m−2 d−1 is wider than the monthly ranges reported for Kirinya papyrus wetland in Uganda [25] but is within the range of 24.7 - 34.1 g m−2 d−1 reported for Navaisha swamp [3] .
Overall efficiency of plants depends partly on the leaves, and actual value of RGR at an instant of time depends on the efficiency of the leaves in assimilation and the amount of foliage which presented at that time [35] . In this study, significant and negatively high correlation of RGR and rate of change in LWR were exhibited (r = −0.965, p = 0.00). The changes in LWR determine the vigour of growth for the aerial shoot growth. Indiscriminate cutting of aerial shoots affects rate of change of LWR in the wetlands. Frequent and indiscriminant harvesting without allowing the system to stabilize therefore affects growth [4] . [5] reported six (6) monthly harvesting regimes significantly affected aerial biomass production, culm density, culm diameter, culm height and clonal young shoot regeneration compared to the twelve (12) monthly harvesting regimes.
In conclusion, overall RGR of the aerial shoot development was controlled by rate of change in LWR from 41 days of growth until 132 days when senescence appears. Water level change had significant influence on total culm density.
Acknowledgements
The authors would like to thank Irish Aid and Trinity International Development Initiative (TIDI) for financial support. Thanks to Mr. Bright Twesigye and Mr. Joseph Kaketu Pale who assisted during the field work.
References
- Saunders, M.J., Kansiime, K. and Jones, M.B. (2013) Reviewing the Carbon Cycle Dynamics and Carbon Sequestration Potential of Cyperus papyrus L. Wetlands in Tropical Africa. Wetland Ecology and Management. http://dx.doi.org/10.1007/s11273-013-9314-6
- Muthuri, F.M. and Jones, M.B. (1997) Nutrient Distribution in a Papyrus Swamp: Lake Naivasha, Kenya. Aquatic Botany, 56, 35-50. http://dx.doi.org/10.1016/S0304-3770(96)01093-5
- Muthuri, F.M., Jones, M.B. and Imbamba, S.K. (1989) Primary Productivity of Papyrus (Cyperus papyrus) in a Tropical swamp; Lake Naivasha, Kenya. Biomass, 18, 1-14. http://dx.doi.org/10.1016/0144-4565(89)90077-2
- Osumba, J.J. and Okeyo-Owuor, J.B. (2008) Effects of Harvesting on Temporal Papyrus (Cyperus papyrus L.) Population among Swamps of Winam Gulf in Lake Victoria Basin, Kenya. Section V1, Fisheries and Water Resources. Proceedings of 4th Annual International Conference, Moi University, Nairobi.
- Terer, T., Triest, L. and Muasya, A.M. (2012) Effects of Harvesting Cyperus papyrus in Undisturbed Wetland, Lake Naivasha, Kenya. Hydrobiologia, 680, 135-148. http://dx.doi.org/10.1007/s10750-011-0910-2
- García, M.B., Picó, F.X. and Ehrlén, J. (2008) Life Span Correlates with Population Dynamics in Perennial Herbaceous Plants. American Journal of Botany, 95, 258-262. http://dx.doi.org/10.3732/ajb.95.2.258
- Muthuri, F.M. (1985) The Primary Production of Papyrus (Cyperus papyrus) in Relationship to Environmental Variables, Ph.D. Thesis, University of Nairobi, Kenya.
- Gaudet, J.J. (1977) Natural Drawdown on Lake Naivasha, Kenya, and the Formation of Papyrus Swamps. Aquatic Botany, 3, 1-47. http://dx.doi.org/10.1016/0304-3770(77)90002-X
- Denny, P. (1985) The Ecology and Management of African Wetland Vegetation: A Botanical Account of African Swamps and Shallow Waterbodies. Dr. W. Junk Publishers, Dordrecht. http://dx.doi.org/10.1007/978-94-009-5504-2
- Talling, J.F. and Lemoalle, J. (1998) Ecological Dynamics of Tropical Inland Waters. Cambridge University Press, Cambridge.
- Azza, N.G.T., Kansiime, F., Nalubega, M. and Denny, P. (2000) Differential Permeability of Papyrus and Miscanthidium Root Mats in Nakivubo Swamp, Uganda. Aquatic Botany, 67, 169-178. http://dx.doi.org/10.1016/S0304-3770(00)00093-0
- Boar, R.R. (2006) Responses of a Fringing Cyperus papyrus L. Swamp to Changes in Water Level. Aquatic Botany, 84, 85-92. http://dx.doi.org/10.1016/j.aquabot.2005.07.008
- Hunt, R. (1990) Basic Growth Analysis. Plant Growth Analysis for Beginners. London, Unwin, Hyman, Boston, Sydney and Wellington. http://dx.doi.org/10.1007/978-94-010-9117-6
- Bugenyi, F.W.B. (1993) Some Considerations on the Functioning of Tropical Riparian Ecotones. Hydrobiologia, 251, 33-38. http://dx.doi.org/10.1007/BF00007162
- Kansiime, F., Nalubega, M., van Bruggen, J.J.A. and Denny, P. (2003) The Effect of Wastewater Discharge on Biomass Production and Nutrient Content of Cyperus papyrus and Miscanthidium violaceum in the Nakivubo Wetland, Kampala, Uganda. Water Science and Technology, 48, 233-240.
- Mugisha, P., Kansiime, F., Mucunguzi, P. and Kateyo, E. (2007) Wetland Vegetation and Nutrient Retention in Nakivubo and Kirinya Wetlands in the Lake Victoria Basin of Uganda. Journal of Physics and Chemistry of the Earth, 32, 1359-1365. http://dx.doi.org/10.1016/j.pce.2007.07.040
- Kanyiginya, V., Kansiime, F., Kimwaga, R. and Mashauri, D.A. (2010) Assessment of Nutrient Retention by Natete Wetland Kampala, Uganda. Physics and Chemistry of the Earth, 35, 657-664. http://dx.doi.org/10.1016/j.pce.2010.07.027
- Kansiime, F. and Nalubega, M. (1999). Nutrients Transformation by Dominant Vegetation Types in the Nakivubo swamp. In: Wastewater Treatment by a Natural Wetland: The Nakivubo Swamp, Uganda. Processes and Implications. PhD Thesis, Wageningen/Delft, the Netherlands.
- Gifford, R.M. (1995). Whole Plant Respiration and Photosynthesis of Wheat under Increased CO2 Concentration and Temperature: Long-Term vs. Short-Term Distinctions for Modeling. Global Change Biology, 1, 385-396. http://dx.doi.org/10.1111/j.1365-2486.1995.tb00037.x
- Heuvelink, E. (1995) Dry Matter Production in a Tomato Crop: Measurements and Simulation. Annals of Botany, 75, 369-379. http://dx.doi.org/10.1006/anbo.1995.1035
- Hunt, R. (1982). Plant Growth Analysis: Second Derivatives and Compound Second Derivatives of Spline Plant Curves. Annals of Botany, 50, 317-328.
- Parsons, I.T. and Hunt, R. (1981) Plant Growth Analysis: A Program for the Fitting of Lengthy Series of Data by the Method of β-Spline. Annals of Botany, 48, 341-352.
- Yin, X., Goudriaan, J., Lantinga, E.A., Vos, J. and Spiertz, H.J. (2003) A Flexible Sigmoid Function of Determinate Growth. Annals of Botany, 91, 361-371. http://dx.doi.org/10.1093/aob/mcg029
- Jones, M. and Muthuri, F. (1997) Standing Biomass and Carbon Distribution in a Papyrus (Cyperus papyrus L.) Swamp on Lake Naivasha, Kenya. Journal of Tropical Ecology, 13, 347-356. http://dx.doi.org/10.1017/S0266467400010555
- Saunders, J.M., Jones, M.B. and Kansiime, F. (2007) Carbon and Water Cycles in Tropical Papyrus Wetlands. Wetland Ecology and Management, 15, 489-498. http://dx.doi.org/10.1007/s11273-007-9051-9
- Bakari, M., Takashi, A., Yustina, K. and Elisamehe, A. (2007) Primary Production in Papyrus (Cyperus papyrus L.) of Rubondo Island, Lake Victoria, Tanzania. Wetland Ecology and Management, 15, 269-275. http://dx.doi.org/10.1007/s11273-006-9027-1
- Pant, H.K., Rochcigl, J.K. and Adjei, M. (2003) Carbon Sequestration in Wetlands: Concept and Estimation. Food, Agriculture and Environment, 1, 308-313.
- Gitay, H., Brown, S., Easterling, W. and Jallow, B. (2001) Ecosystems and Their Goods and Services. In: McCarthy, J.J., Canziani, O.F., Leary, N.A., Dokken, D.J. and White, K.S., Eds., Climate Change 2001: Impacts, Adaptation, and Vulnerability. Contribution of Working Group II to the Second Assessment Report of the Intergovernmental Panel on Climate Change, Cambridge University Press, Cambridge, 235-341.
- Mhonda, A. (2013) Evaluating Flash Flood Risk Reduction Strategies in Built up Environment. M.Sc. Dissertation, University of Twentes, the Netherlands.
- Thompson, K. (1975) Productivity of Cyperus papyrus. IBP-PP Synthesis Symposium, Aberystwyth, 1973 and Incorporated into Westlake, 1975.
- Steinmann, F. and Brändle, R. (1984) Effects of Stalk Removal on Carbohydrate Metabolism in Flooded Bulrush Rhizome Schoenoplectus lacustris (L.) PALA. Flora, 175, 295-299.
- South, D. B. (1995). Relative Growth Rates: A Critique. South African Forestry Journal, 173, 43-48. http://dx.doi.org/10.1080/00382167.1995.9629690
- Poorter, H. and Remks, C. (1990). Leaf Area Ratio and Net Assimilation Rate of 24 Wild Species Differing in Relative Growth Rate. Oecologia, 83, 553-559. http://dx.doi.org/10.1007/BF00317209
- Poorter, H., van de Vijver, C.A.D., Boot, R.G.N. and Lambers, H. (1995) Growth and Carbon Economy of Fast Growing and a Slow Growing Species as Dependent on Nitrate Supply. Plat and Soil, 171, 217-227. http://dx.doi.org/10.1007/BF00010275
NOTES

*Corresponding author.