Open Journal of Ecology
Vol.3 No.8(2013), Article ID:41222,14 pages DOI:10.4236/oje.2013.38061
Floristic diversity and structural parameters of the Brazzaville Patte d’Oie forest, Congo
![]()
École normale supérieure, Université Marien Ngouabi, Brazzaville, Congo; *Corresponding Author: vkimpouni@yahoo.com
Copyright © 2013 Victor Kimpouni et al. This is an open access article distributed under the Creative Commons Attribution License, which permits unrestricted use, distribution, and reproduction in any medium, provided the original work is properly cited.
Received 10 November 2013; revised 10 December 2013; accepted 17 December 2013
Keywords: Congo; Floristic Diversity; Biological Diversity Indices; Population Structure; Urban Forest Reserve
ABSTRACT
The flora of the Patte d’Oie forest of Brazzaville is studied according to three plots of 0.5 ha, corresponding each to one of the islet, currently constituting it. With an original area of 240 ha, put in reserve in 1938, the natural forest of the Patte d’Oie of Brazzaville covers 95 ha, less than 39% compared to initial area. Because the other main forests of Brazzaville have disappeared without delivering their biodiversity, this study is the first one which emphasizes the flora of this single ecosystem of Congo. The total floristic inventory revealed 459 trees of dbh ≥ 10 cm on 1.5 ha; it is an average of 306 trees∙ha−1. 31 species are listed for 17 families, and the best represented of which (Fabaceae, Euphorbiaceae and Rubiaceae) have a diversity varying from 13% to 19% of the inventory and a tree number oscillating from 15% to 36%. The Shannon (H') biological diversity index of the three plots is of 2.6 on average, for a maximum diversity (H'max) average of 2.9 versus an average true diversity of 15. The Pielou index is on average 0.9, whereas that of Simpson is 0.9. The coefficients of similarity of Jaccard (41.4% to 57.1%) and of the coefficient of Sørensen (58.5% to 72.7%) show the variations in the floristic composition. The followed ecological parameters show that this ecosystem is very few diversified compared to the tropical wet dense forests on the one hand, and, on the other hand, a non constant floristic composition is not. The analysis of the diametric structure by plot and the dominant and/or characteristic species give erratic curves, evidence of an insufficiency of the regenerative potential. Indeed, approximately 70% of the species are characteristic of the disturbed ecosystems (Macaranga sp., Caloncoba welwitschii, Hymenocardia ulmoides, and Anthocleista sp.).
1. INTRODUCTION
Located in central Africa and crossed by the equator, the Republic of Congo with a surface of 342,000 km2, has vegetation made up with 65% of forests and 35% of savannas unequally distributed on the unit of the territory [1,2]. However, among the two types of vegetation, there are savannas included in forest zone and the forest facies of low savannas area. The forest of the Patte d’Oie of Brazzaville is one of these witnesses. The forests of Brazzaville and those studied by Makany [3] on the Plateaux Téké, are facies which one meets in the phytogeographical districts of Léfini and the Plateaux [4]. The ombrophilous forests type of the téké plateaus, evolve in wet bottoms funds and well drained valleys, whereas that of the Patte d’Oie develops on a plateau with psammitic substrate. Thus, it is presented under the aspect of a facies mesophile dry typical and specific to Congo.
The Patte d’Oie forest became a reserve since 1938 by decree 3037 of August 13th, 1938 of the governor of French Equatorial Africa (A.E.F), covered 240 ha of natural forest. Following the anthropic action, this reserve is reduced to approximately 39% of its original area by decree n˚ 2009-149 of May 8th, 2009. The natural forest cover of Brazzaville, formerly formed by five principal suburban forests [2], is represented indeed, by only three intra-urban islets of forests deriving from the deforestation of “La Patte d’Oie”, the only evidenced of the original forest. The anthropic pressure led to the disappearance of “la forêt de la Tsiémé”, “La Glacière”, “Le ravin du Tchad” (the ravine of Chad), and of “La Corniche”, on the one hand, and, on the other hand, to the insulation of the three small islets of forests area of which includes the anthropic and natural woody formations, the administrative buildings and the adventure playgrounds. Currently under supervision of the General delegation of the scientific research and Technological (Délégation Générale à la Recherche Scientifique et Technique: DGRST), the islet forest of the “ex-Orstom” is not integrated in the field of the reserve of the Patte d’Oie forest.
The floristic studies on the Patte d’Oie forest of Brazzaville are compartmental and non-exhaustive. They are often articulated on the inventory taxonomic, the ethnobotanic, ecology with the regeneration, the characterization, and the dissemination of the diaspora [5-9]. These studies, specifically by Makoumbou and MassambaKengue [6]; Ndinga and Mayitoukou [7]; Gnendo and Bandzoulou [8]; Taty Dekanga and Mombouli [9] which are related to floristic diversity and the structural parameters, and which are generalized from a floristic area of less than 1000 m2 carried out in natural and/or artificial forest. In addition none of them takes into account the flora of the three islets of forests resulting from the degradation of the Patte d’Oie forest.
The studied forests are variously arranged urban forests, preserved vestiges of the natural forest. They were the object of forestry enrichments on the one hand, and remain subjected to various and uncontrolled anthropic actions, on the other hand. Our contribution is focused on: the appreciation of the floristic diversity of woody species of dbh ≥ 10 cm, for a comparison with the data of the forests of central Africa; the space distribution of taxa; the estimate of the degree of impact strength and impact of the anthropic action.
2. MATERIALS AND METHODS
2.1. Characterization of Studied Area
The climate of Brazzaville (4˚10' - 4˚20'S, 15˚10' - 15˚20'E), capital of the Republic of Congo (Figure 1), is of type low-Congolese [10,11]. It is characterized by annual averages of temperature of approximately 25˚C and annual thermal amplitude oscillating from 4˚C to 6˚C (Figure 2). March and April are the hottest months; the months from June to September, marking the dry season, are cool, July and August are the freshest. The rains are spread out from October to May and the average rainfall is of approximately 1200 mm/year. This rainy and hot season knows a deceleration of precipitations in January and February. The maximum of rain are observed in March-April and in November-December (Figure 2).
The relative humidity is higher than 70%, whereas an absolute minimum is observed in August and September, and a relative humidity minimum in February and March. As for evaporation, it presents a relative minimum in June and an absolute maximum in August and September. The monthly averages over ten years (1999-2008) show that the insolation presents two maximum in March and May (164 and 175 hours) and a minimum in June (124 hours). The annual average lies between 1100 and 1800 hours for the same period [12,13]. With the geological plan, Cosson [14] distinguishes two principal stratigraphic sequences in the area of Brazzaville: the series of the Plateaux Batéké made up of the silicified sand, sandstones and the series of Stanley—Pool which rests in discordance on the sandstones of Inkisi.
The soils are ferralitic, strongly desaturated and impoverished. They are low in exchangeable and very permeable bases because of the sandy substrate which allows the migration of the solutions of the ground [15].
Brazzaville area is drained by two principal tributary of the Congo River: Djiri in north and Djoué in the south. In addition to these two tributary, this city is also crossed by three brooks: Tsiémé, Mfoa, and Mfilou [2].
2.2. Materials
The irregular dispersion of certain species is such as only one station is, in general, insufficient to describe a forest type in a perfectly representative way [16]. Thus several floristic plots are carried out in the area of study, in order to characterize these natural forests, in particular the upper floor. By taking account into the very low area of the preserved parts of the natural forest, of the effect of the edge and the very marked state of degradation, the inventory of each islet of forest is carried out on four subplots (Table 1) of 1250 m2 (50 × 25 m), that is to say 0.5 ha. During this inventory, a herbarium of about fifty species was carried out and deposited at the laboratory of the Centre of Studies on the Plant resources (CERVE) and at the department of Natural science of Marien Ngouabi University (ENS). The species identification was done in situ for most current and ex situ for the others. The confirmation of identifications is made by comparison with the herbaria of the IEC and the diagnoses of Pauwels [17], through the flora of Gabon, Cameroon and the flora of the spermaphytes of Belgian Congo— Rwanda—Urundi. The taxonomic nomenclature used is in agreement with the APG III [18] and Lebrun & Stork [19].
2.3. Methods of Study
The Method is based on the botanical inventory, on the one hand, and on the other hand, the bibliographical compilation of the relative data to the Patte d’Oie forest of Brazzaville.
The botanical inventory consists in counting all the trees of diameter at breast height (dbh) ≥ 10 cm [20-22] in 12 subplots of 1250 m2 each one. During this inventory, it is noted the dbh of the listed trees which are then
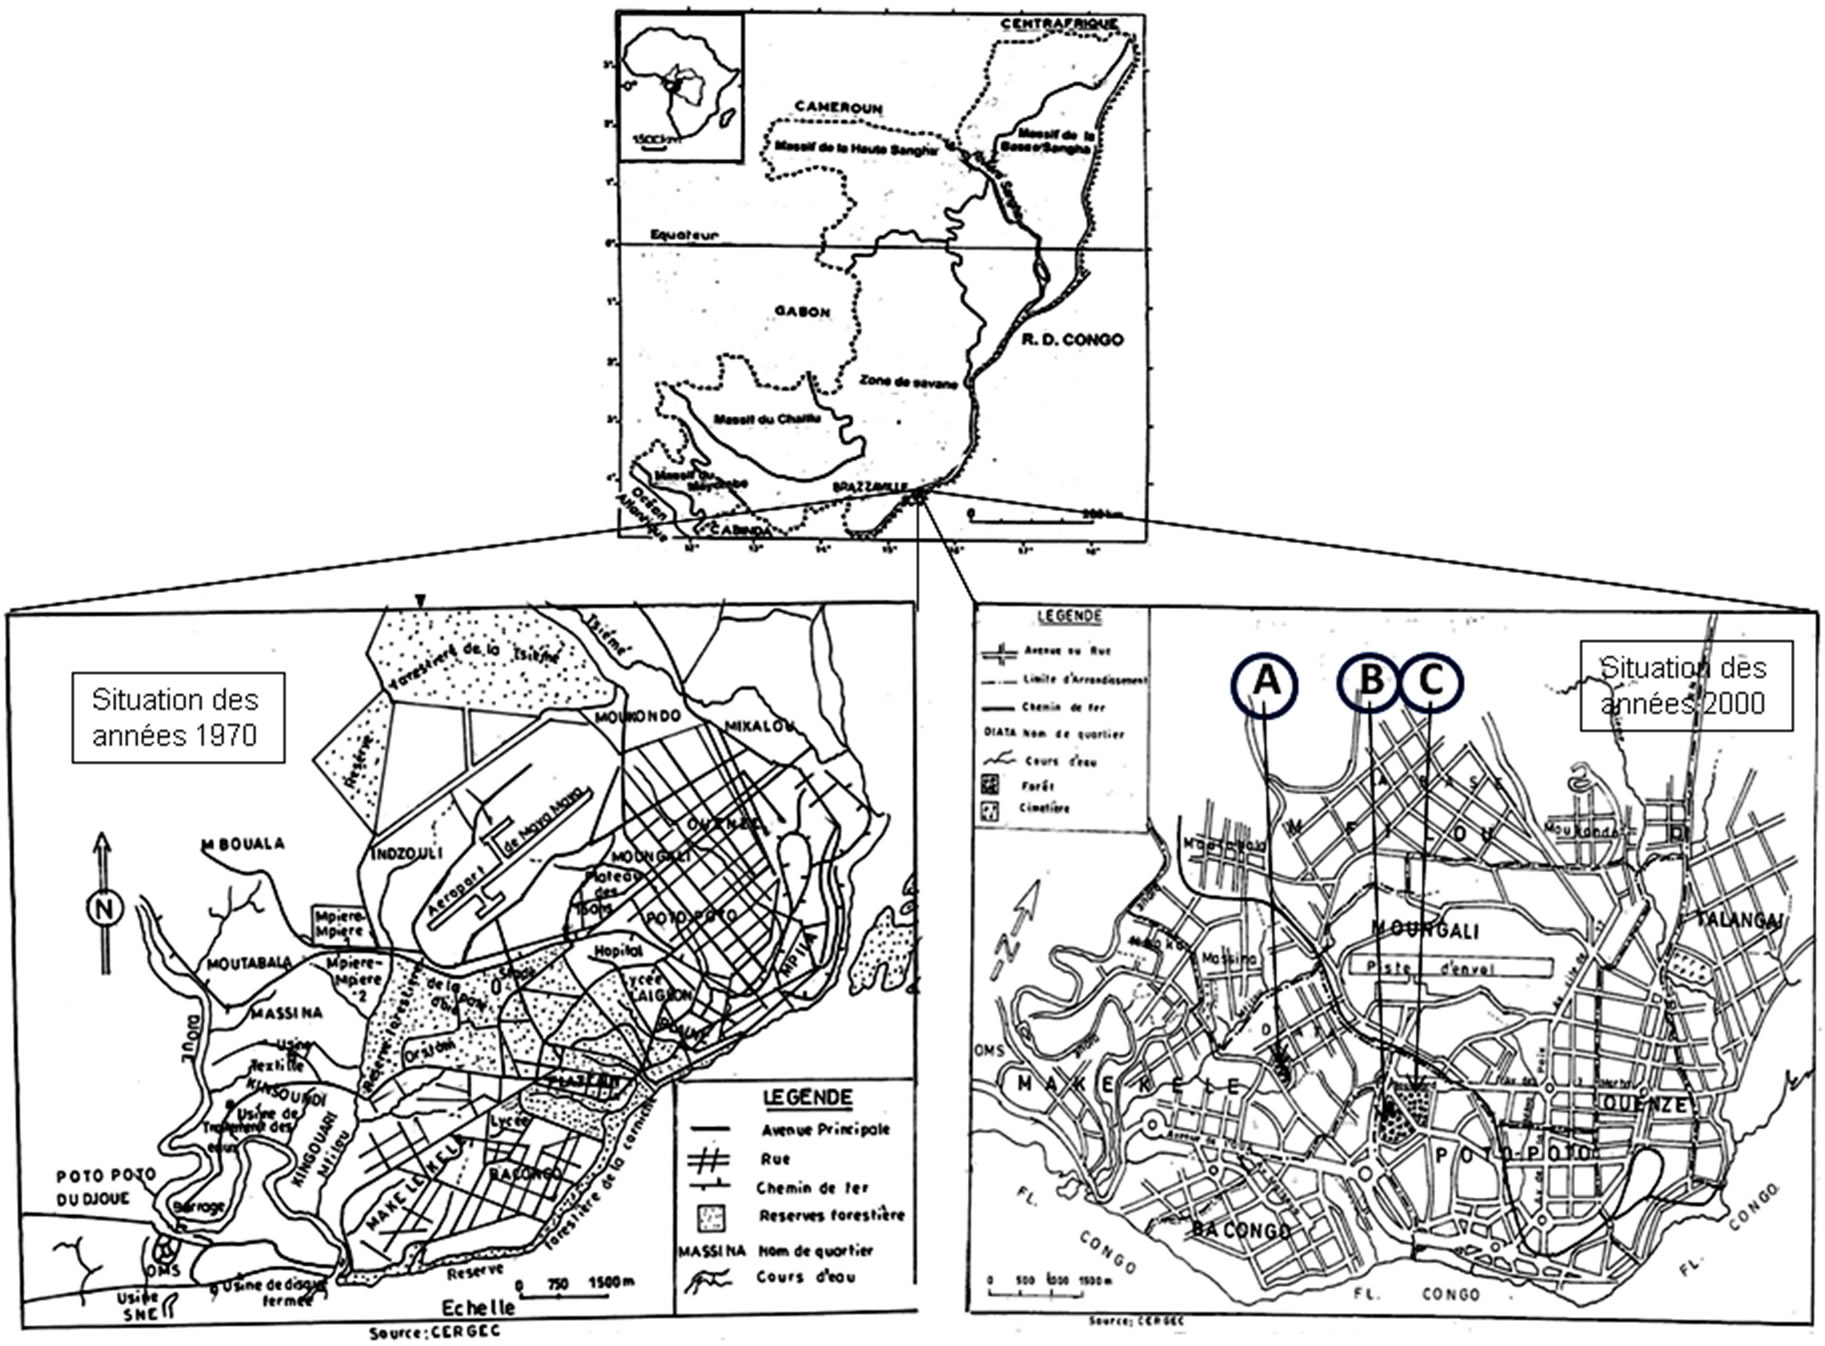
Figure 1. Evolution of the natural forest cover of Brazzaville of the years 1970 to 2000Caption: forest islets of the exOrstom (A), zoological gardens (B), Parliament home (C).
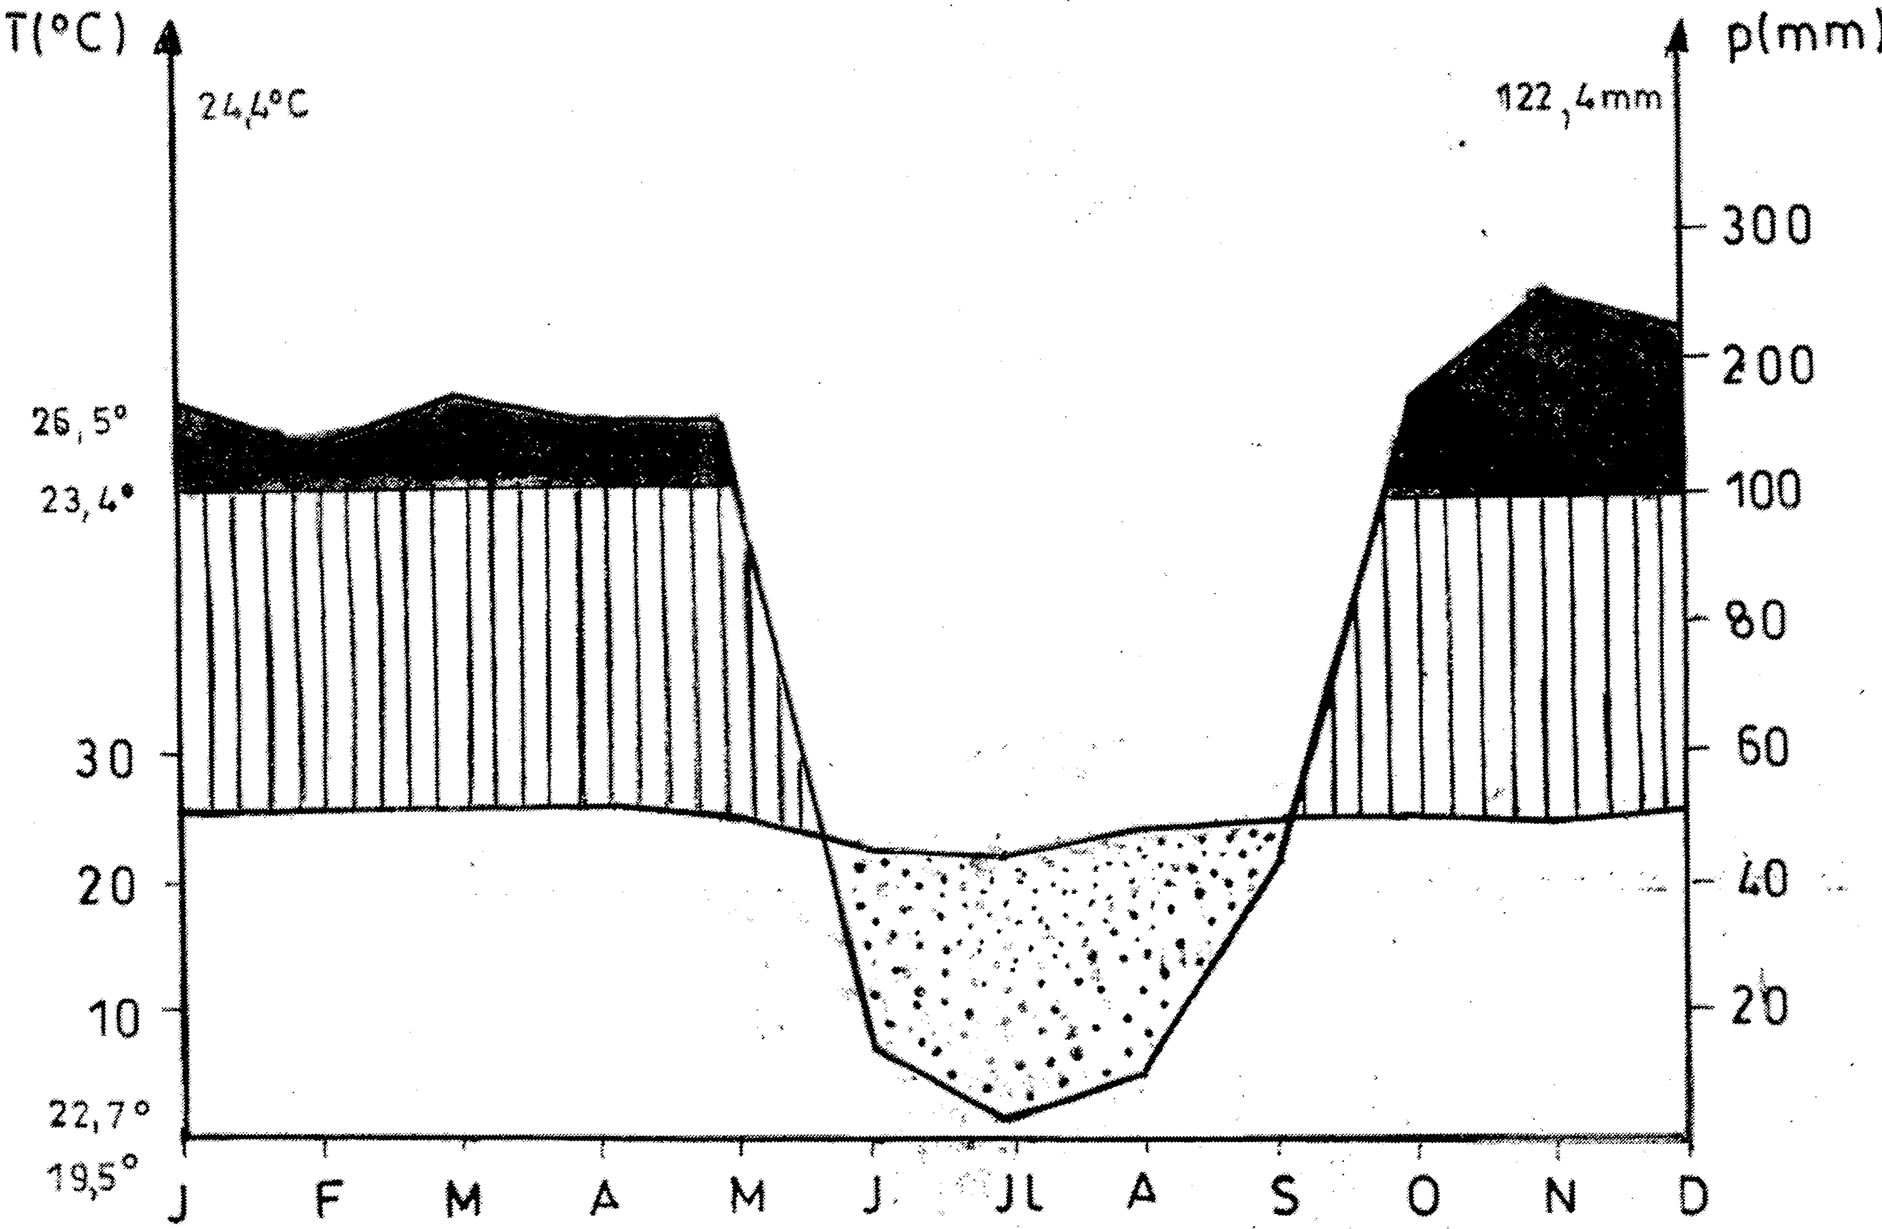
Figure 2. Ombrothermic diagram of the Brazzaville area (source: Mounie, 1999).
ranged in 7 classes diameter of 10 cm.
2.4. Data Analysis
Ecosystem being defined as a community associated with a physical environment that it occupies at a given time, the measurement of diversity alpha (α), a particular sector or an ecosystem, is expressed by its number of species (specific richness). Diversity beta (β) makes it
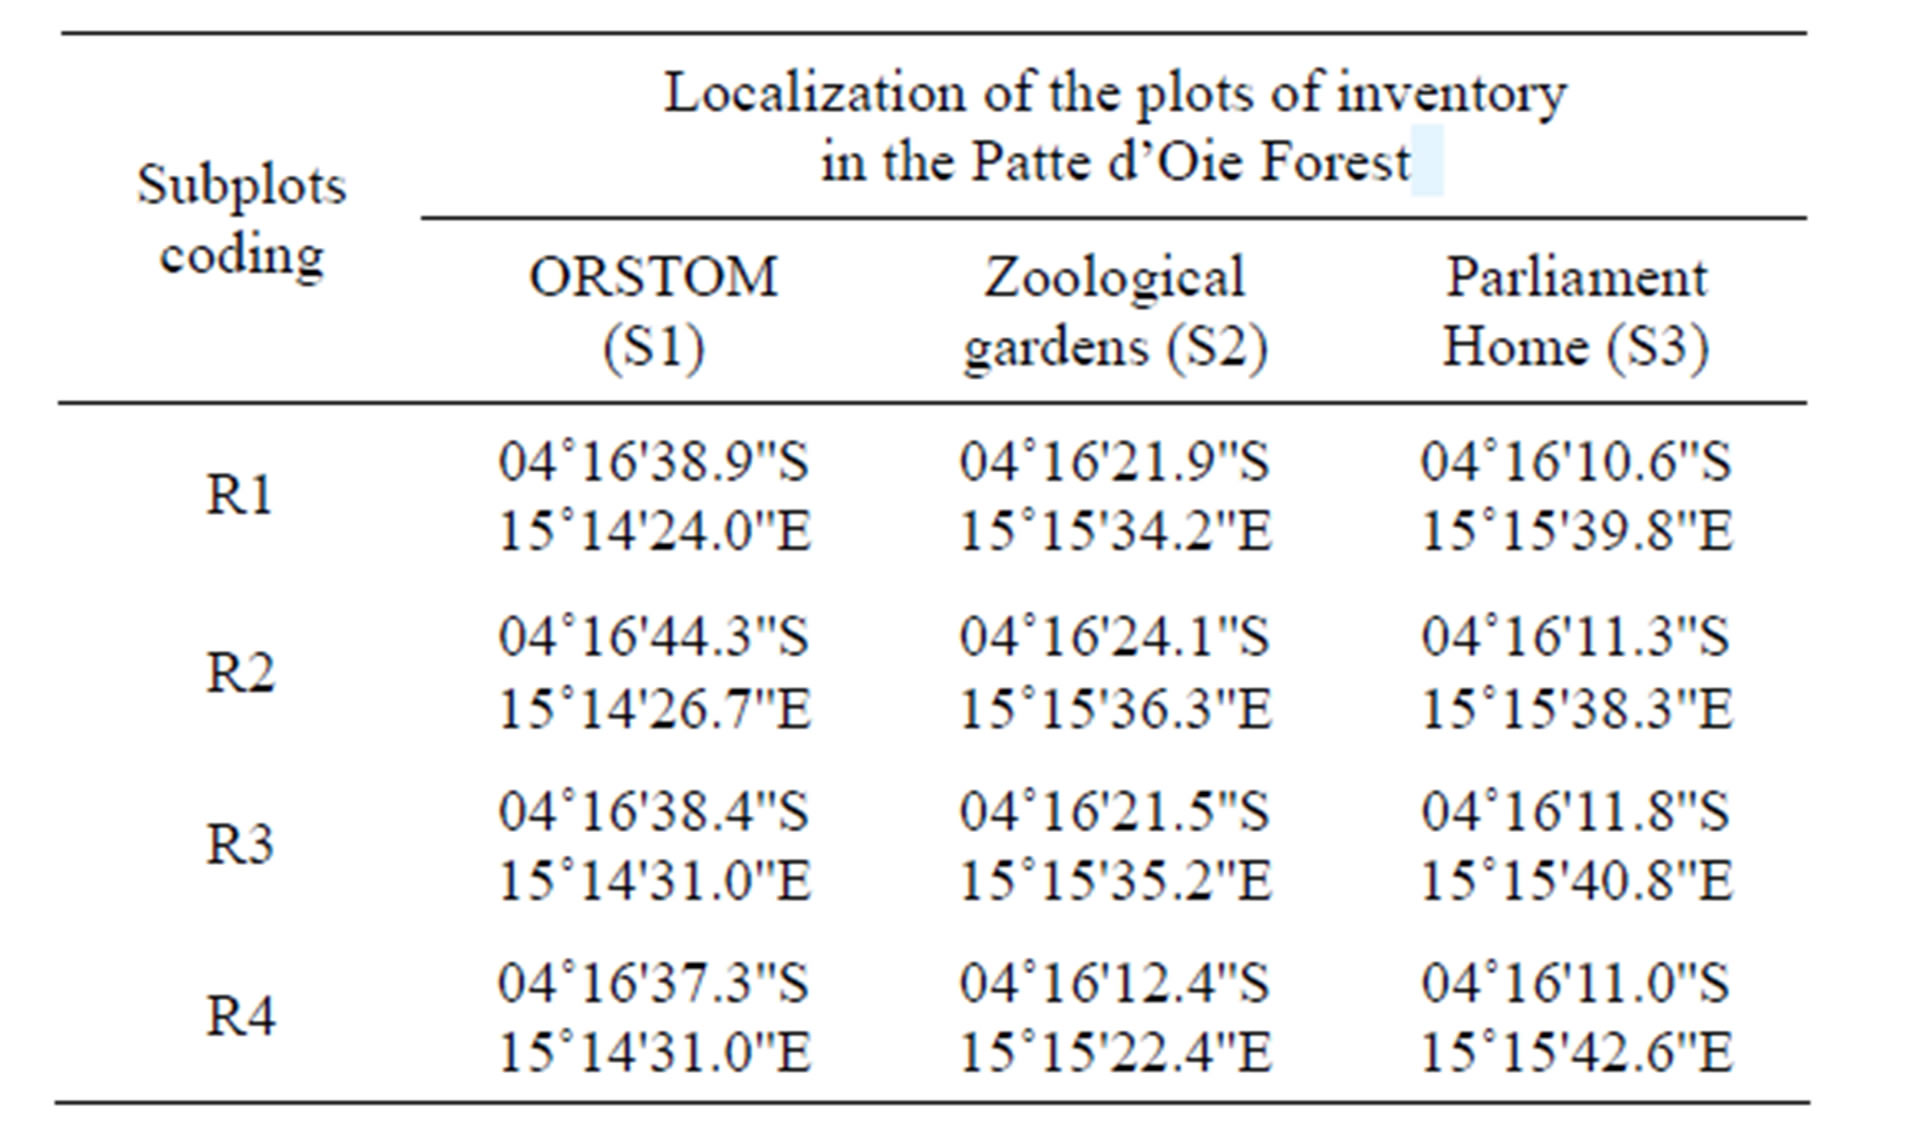
Table 1. Localization of the plots of inventory in the Patte d’Oie Forest (R = subplot).
possible on the other hand to evaluate internal complexity with each ecosystem is a comparison of diversity between the plots; it is usually measured like the quantity of species changing between the ecosystems. Lastly, diversity gamma (γ) is the measurement of total diversity [23-29].
• beta (β) diversity is evaluated thanks to the coefficients of similarity of Jaccard and Sørensen. The use of these two coefficients is justified by the fact that: Jaccard gives the same quotation to the presence and the absence; whereas Sørensen attaches twice more significance to the presence. In this last case, the presence is more informative than the absence [30]. The floristic degree of similarity is treated by comparing plots between them and the allowed threshold so that two plots are recognized similar is of 100% [31,32];
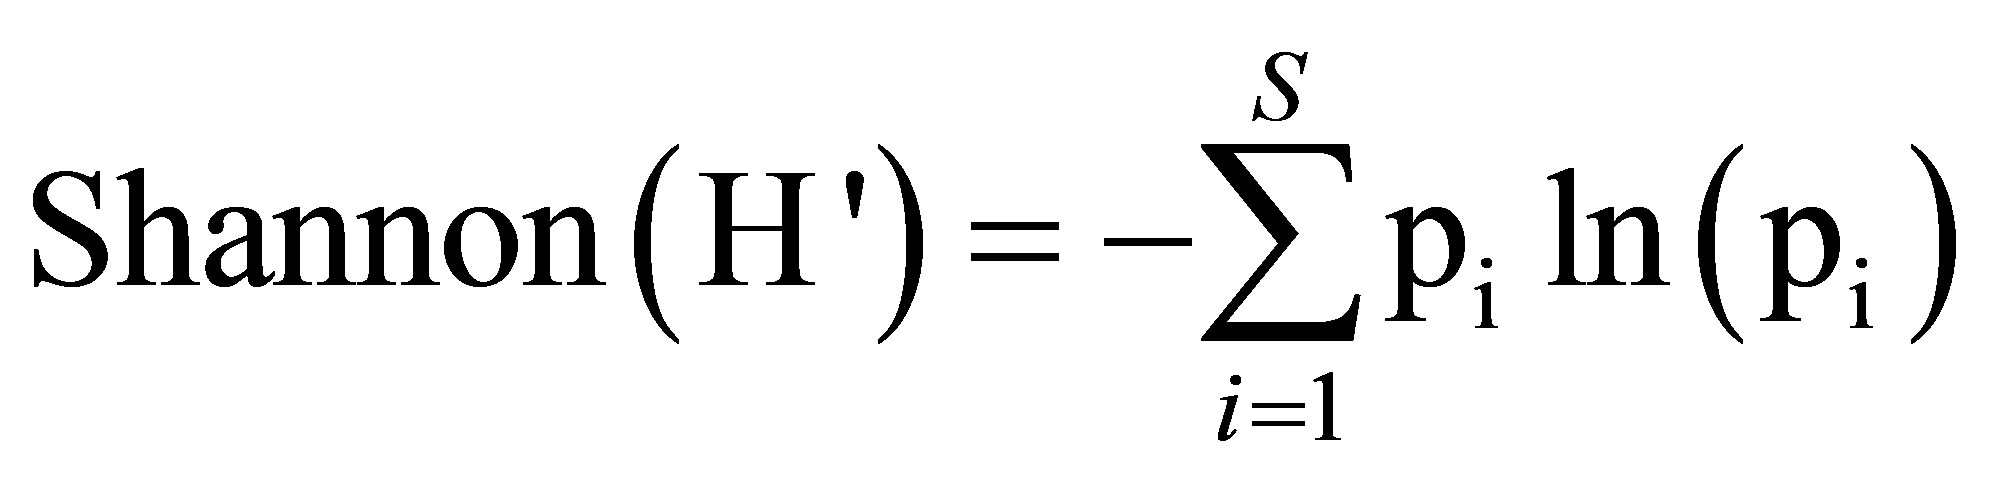
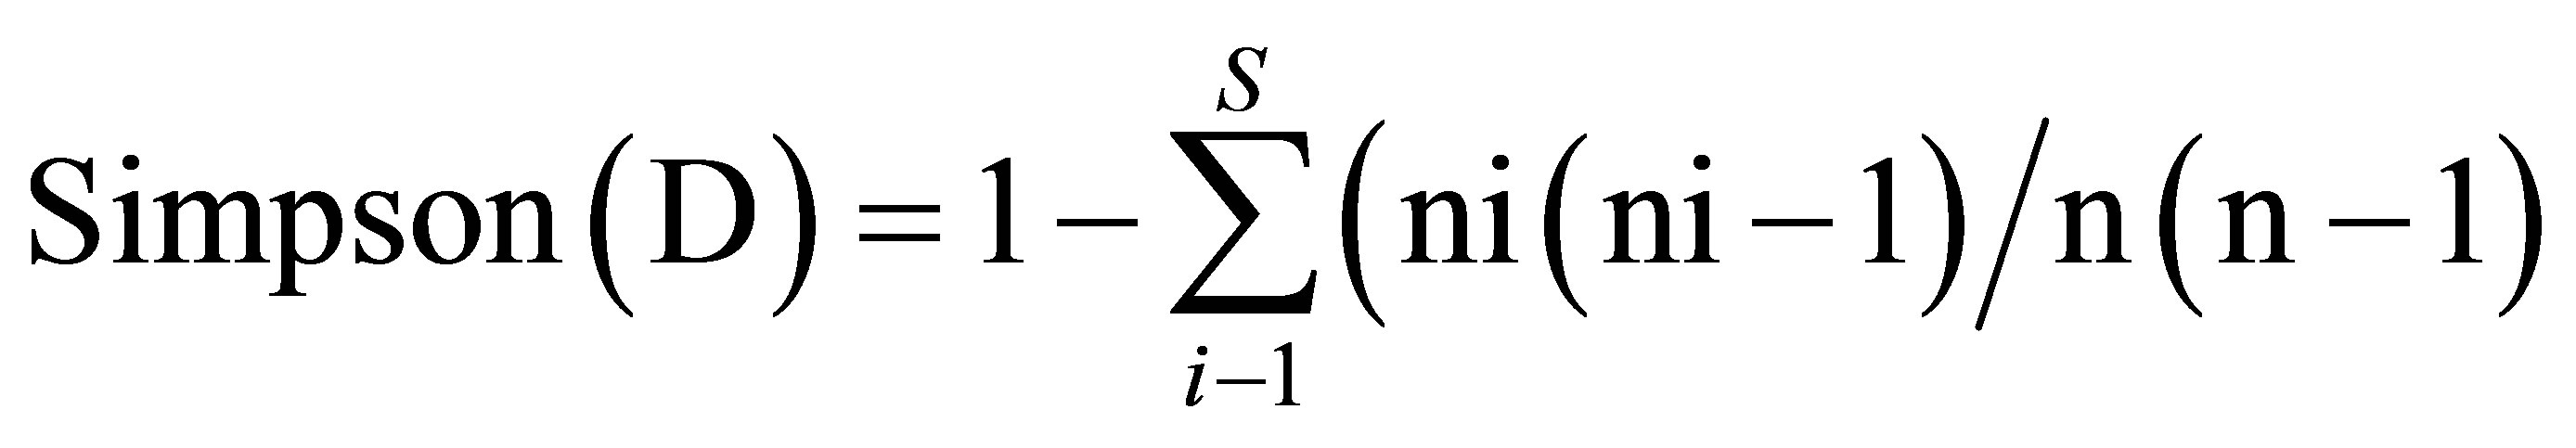
• alpha (α) diversity is studied according to the indices of biological diversity of Shannon and Simpson which make it possible to evaluate floristic diversity. The index of Shannon is sensitive to the number of rare species, and thus the least represented, while that of Simpson with predominance of certain dominant species [23,26,30,33]. Maximum floristic diversity corresponds to the degree of diversity which a plot can reach, in the case of a homogeneous distribution of the individuals constitutive of the flora;
• equitability index (index of regularity or Pielou) informs about the level of diversity reached by an ecosystem compared to the possible maximum. It better takes into account the regularity of the distribution, independently amongst species. When the regularity is low, it expresses a phenomenon of predominance, when it is high, it expresses a regular distribution of the individuals between the species, from where absence of predominance;
• The conversion of the value of the entropy (H') of many effective species (true diversity), gives a unified and intuitive interpretation of diversity [34,35];
• Coefficient of abundance-dominance of Braun-Blanquet is used for floristic diversity characterization.
5: Unspecified number of individuals, rate covering > 3/4 of reference area (>75%, Rm = 87.5%a);
4: Unspecified number of individuals, rate covering between 1/2 et 3/4 (50% - 75% of reference area, Rm = 62.5%);
3: Unspecified number of individuals, rate covering between 1/4 et 1/2 (25% - 50% of reference area, Rm = 37.5%);
2: Unspecified number of individuals, rate covering between 1/20 et 1/4 (5% - 25% of reference area, Rm = 15.0%);
1: Unspecified number of individuals, rate covering between < 1/20, or dispersed individuals with cover until 1/20 (5%, Rm = 2.5%b);
+: Few individuals, with very weak rate covering (Rm = 0.1%b).
With: a) Rm: average covering, after conversion of the coefficient of abundance-predominance; b) arbitrary value de Rm.
Data Dealing Out
The following mathematical expressions are used for the interpretation of the results:
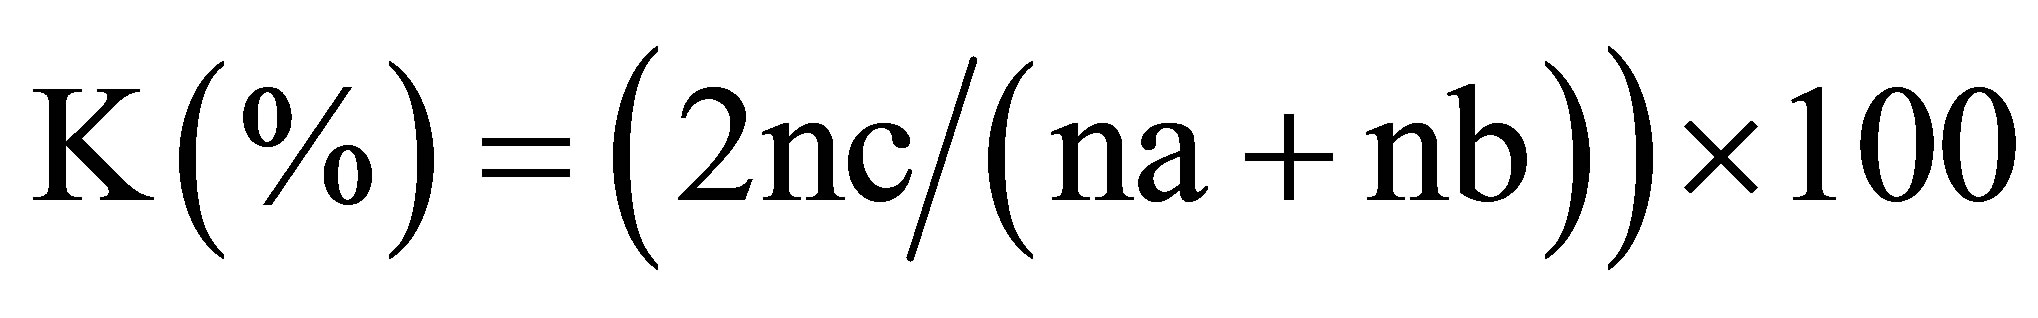
• coefficient of similarity:
Coeffient of Jaccard:
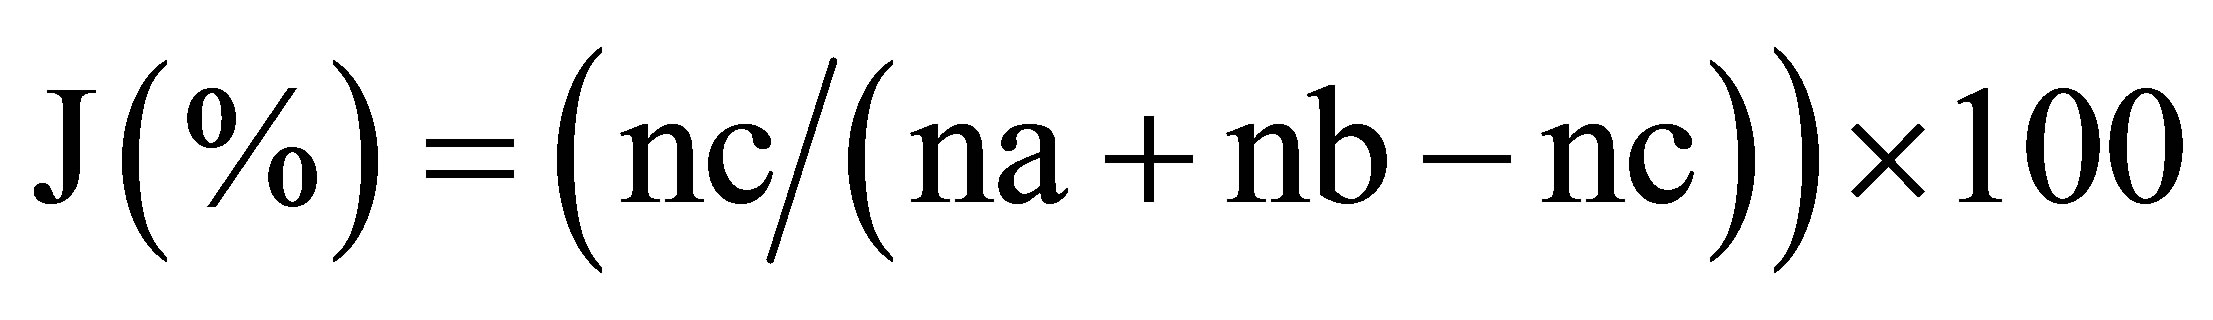 (1)
(1)
Coefficient of Sørensen:
 (2)
(2)
with na = many species of the 1st plot; nb = many species of the 2nd plot and nc = total of the common species;
• basal area:
 (3)
(3)
Basal area indicates the space surface occupied by the trunks.
• indices of biological diversity:
 (4)
(4)
 (5)
(5)
where pi = ni/n: ni = species i number of trees, N = full number of trees.
• index of maximum diversity:
 (6)
(6)
S = full number of the species.
• index of Pielou (regularity or equitability):
 (7)
(7)
• index of absolute diversity:
 (8)
(8)
where D is the absolute (true) diversity, exp. = an exponential function and H' the index of Shannon diversity.
• index of the values of importance of species or family
 (9)
(9)
where FR (Relative frequency (%)) = (Number of plots where species is present/total frequency) × 100; DR (Relative density (%)) = (species density/total density) × 100; DoR (Relative predominance (%)) = (species basal area/ total basal area) × 100.
3. RESULTS
3.1. Taxonomic and Flora Diversity Data
459 trees of dbh ≥ 10 cm are summarized in Table 2 corresponding at 31 species ranged in 17 families. The number of species per family varies from 1 to 6, that is to say a specific diversity ranging between 3.2% and 19.4%. The comparison of the floristic composition of the plots indicates an important variation at the generic level (21
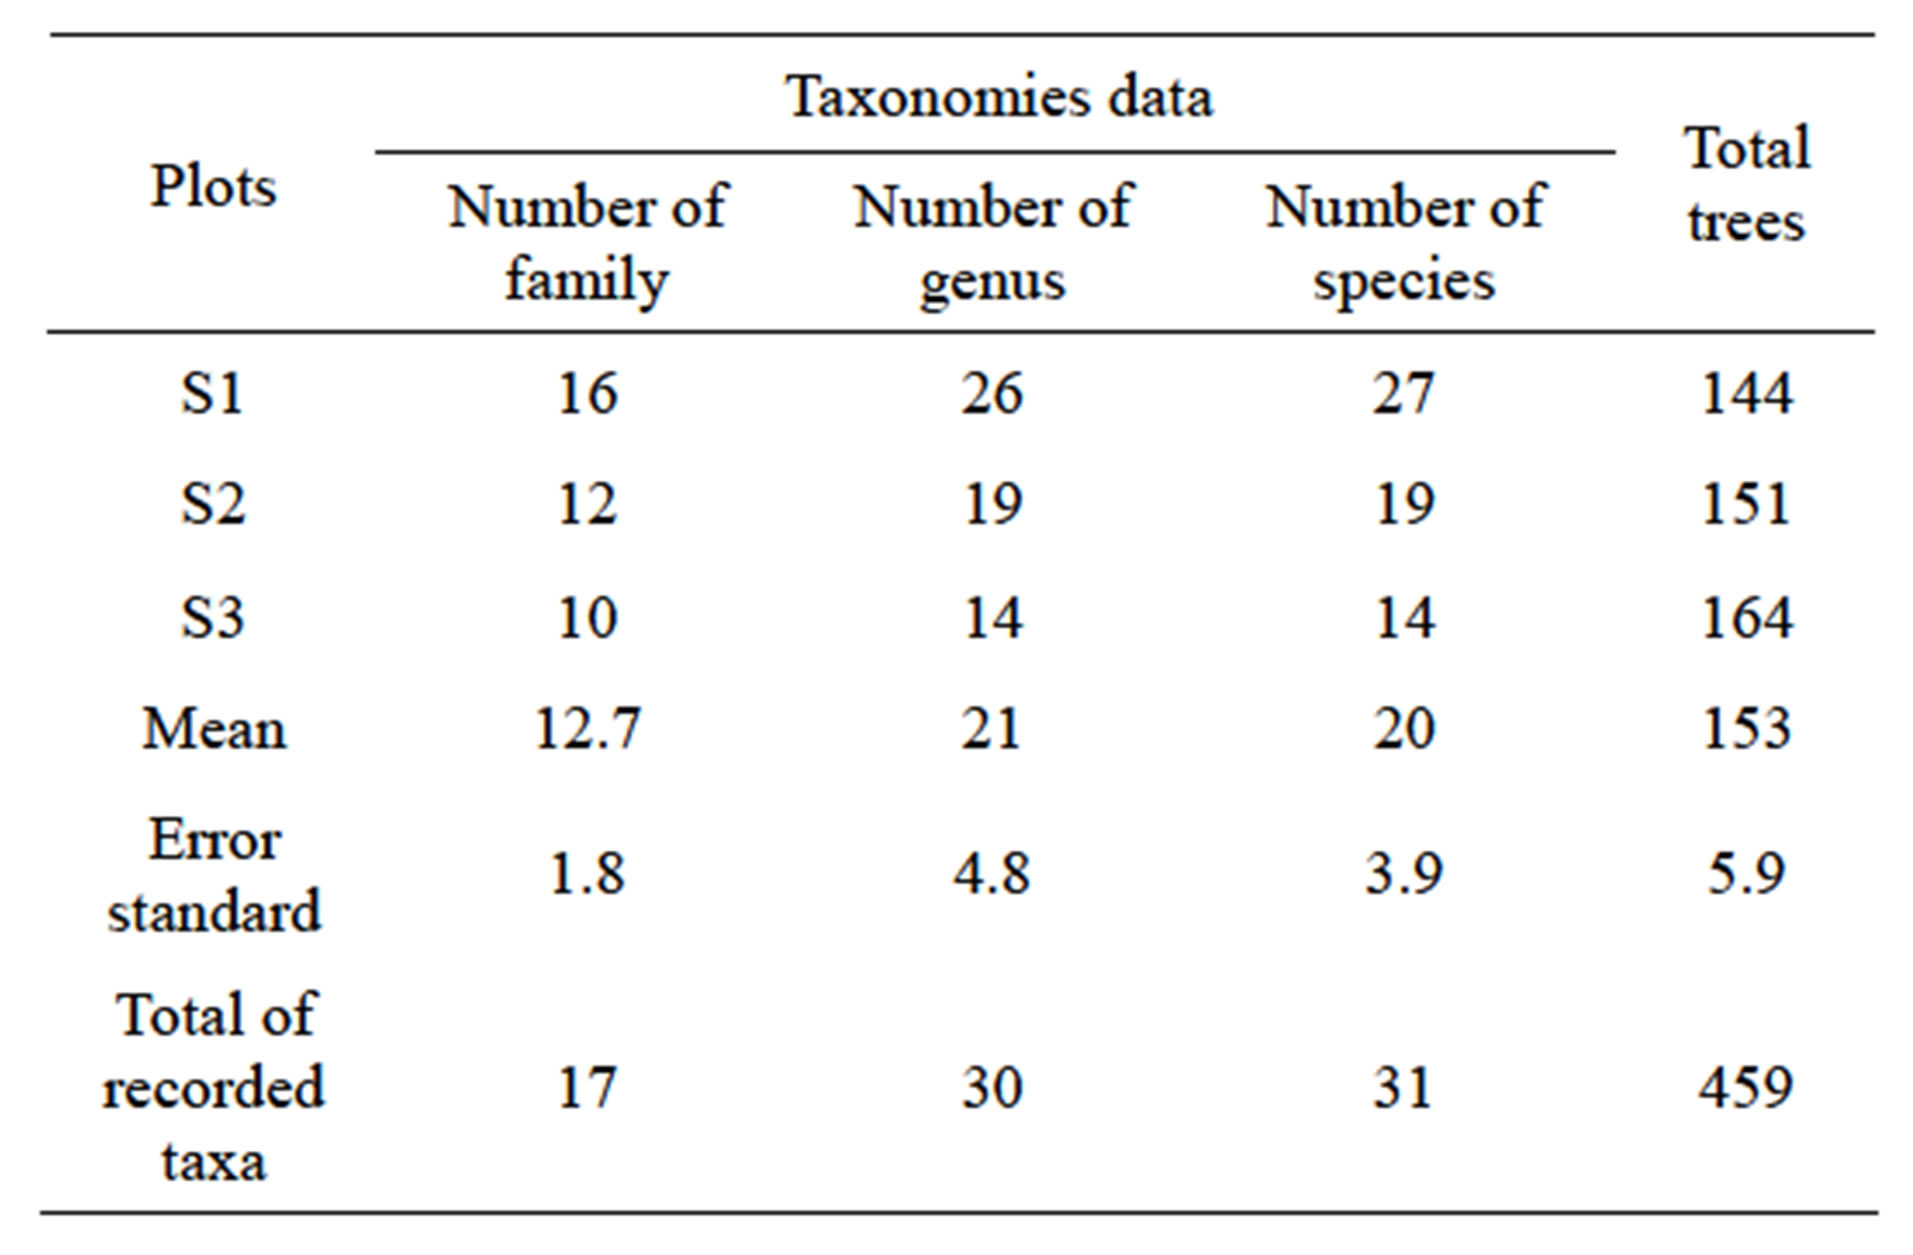
Table 2. Taxonomies data and number of the woody species in the Patte d’Oie Forest.
on average) and specific (20 on average), and no plot shelters the 17 listed families (Table 2). The trees numbers by plot varies from 144 to 164 with an average of 153 trees. The Parliament home forest (S3) is the richest plot with 164 trees, corresponding at 36% of the total of the inventory.
3.2. Floristic Analysis
3.2.1. Rough Spectrum
Taxa distribution shows that Fabaceae and Euphorbiaceae present the highest floristic diversity in front of Rubiaceae (Figure 3). Their respective contribution varies from 13% to 19%, which corresponds to a number of species ranging between 4 and 6. The least represented families have a floristic diversity varying from 1 to 2 species corresponding at 3.2% to 6.5%.
The floristic analysis of plots indicates variations in the composition (Figure 3). In the S1 plot, Rubiaceae (22% of the inventoried species) dominate Fabaceae (15%) and Euphorbiaceae (11%). In the plot S2, Fabaceae with 26% of the listed species are most abundant family followed by Rubiaceae (16%) and Euphorbiaceae (5%). In the plot S3, we raise a codominance of Phyllanthaceae and Euphorbiaceae (14% of listed species each one), in front of Fabaceae (2% of inventoried species). We can emphasize that the majority of the families (76%) is represented by only one species, in the three plots.
3.2.2. Balanced Spectrum
The number of trees per plot is regularly dominated by Fabaceae and Achariaceae whose contribution varies from 15% to 36%. However, Phyllanthaceae and Loganiaceae have approximately 15% of trees in the plot S3 (Figure 4). In the plot S1, there is a predominance of Fabaceae and Achariaceae. As for the plot S2, they are the same families which are represented better, but with a clear preponderance of Fabaceae. Lastly, in the plot S3, Achariaceae dominate Phyllanthaceae and Loganiaceae.
3.2.3. Coefficients of Similarity
Coefficients of similarity of Sørensen and Jaccard (Table 3) show weak differences in the floristic composition type of the three plots. The values of the coefficient of similarity of Jaccard oscillate between 41.4% and 57.1% and those of Sørensen from 58.5% to 72.7%.
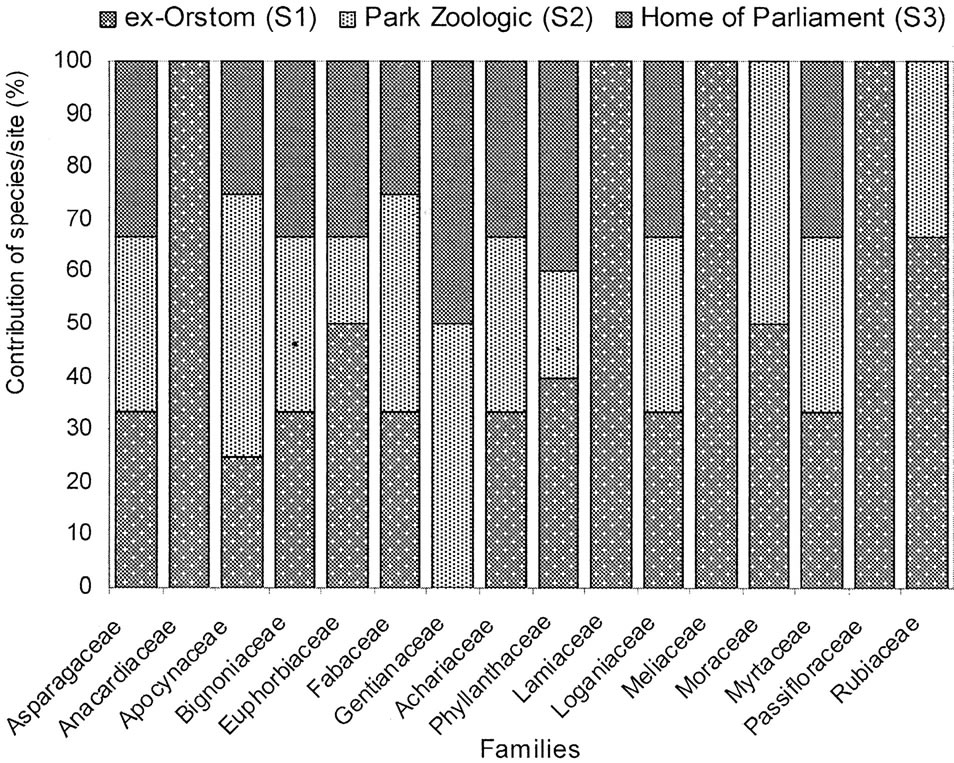
Figure 3. Rough spectrum of specific diversity by family and forest islets.
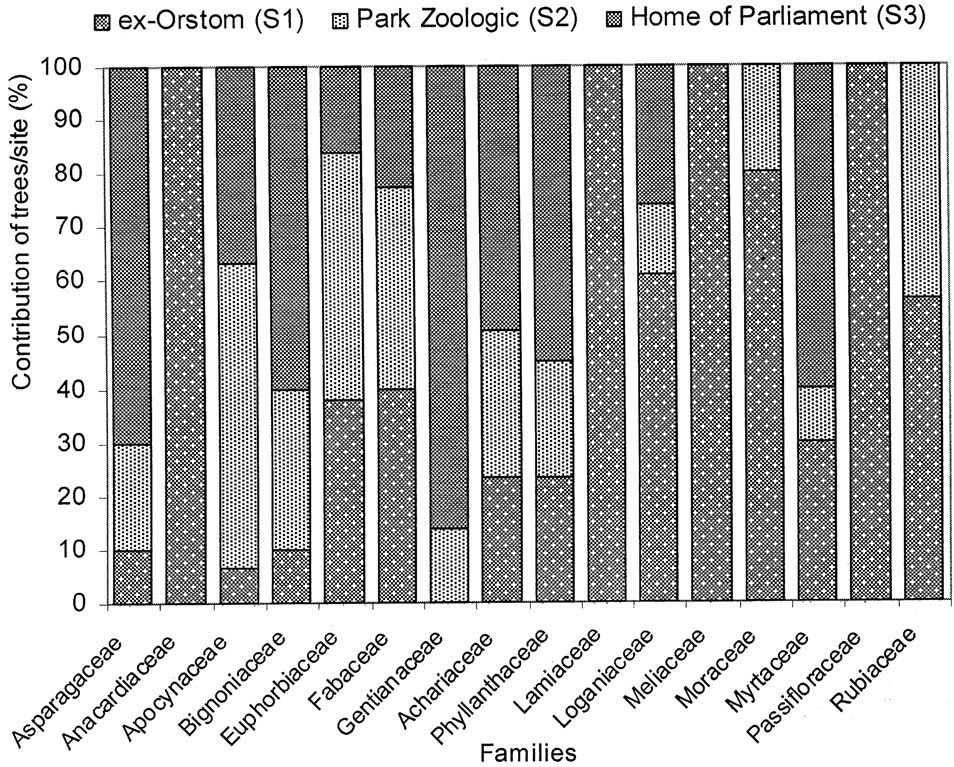
Figure 4. Balanced spectrum of the woody according to the families and the forest islets.
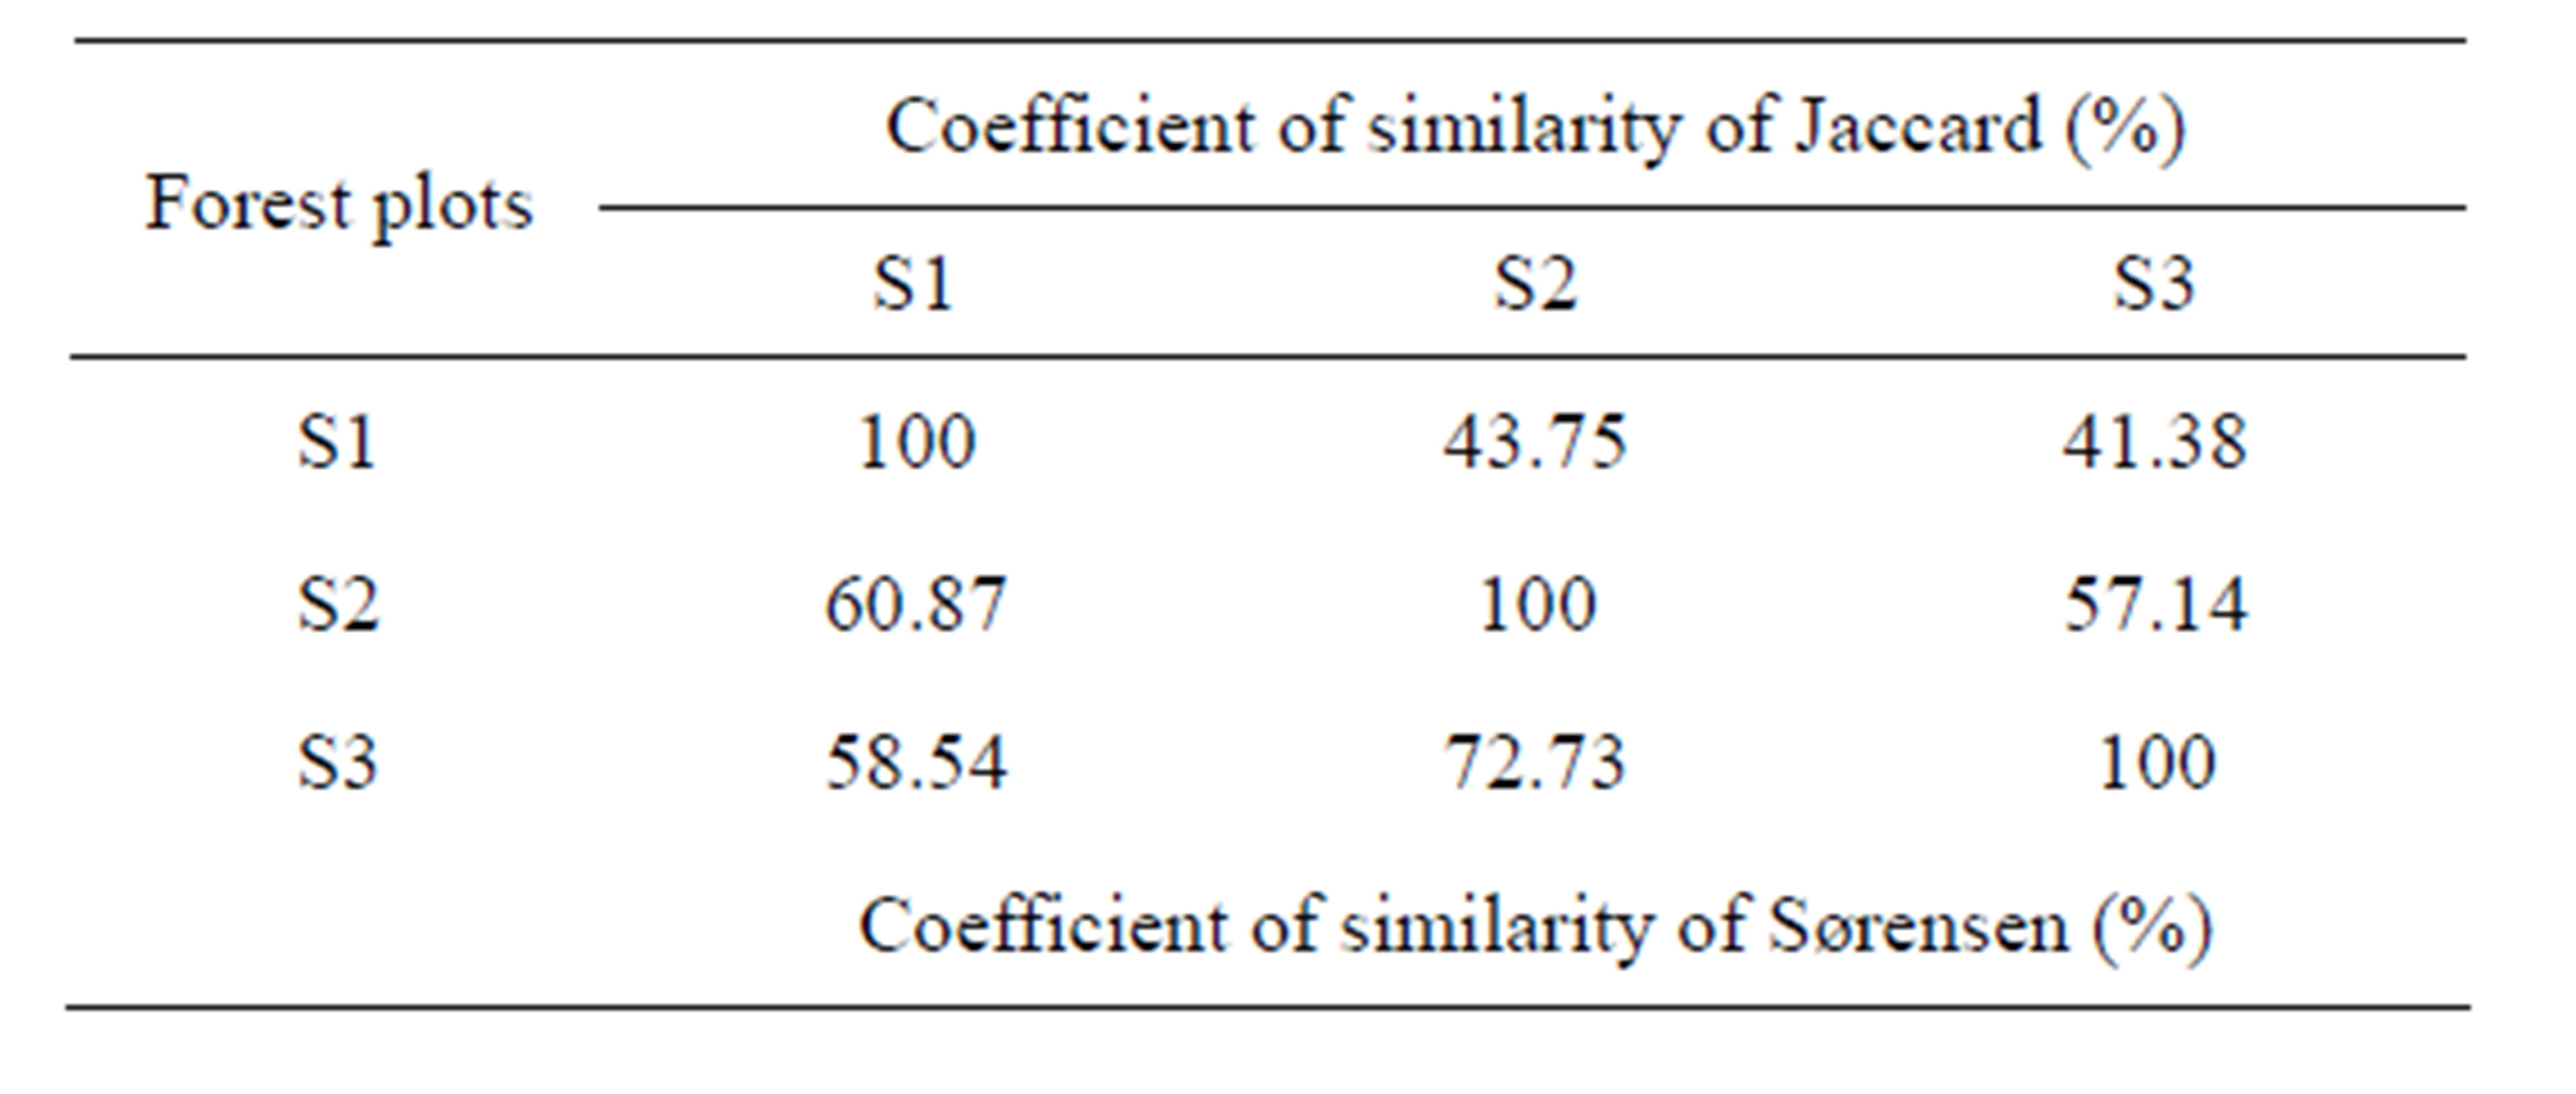
Table 3. Variation of Jaccard and Sørensen coefficients of similarity between the three forest plots.
3.2.4. Coefficient of Abundance-Predominance
Coefficients of abundance-predominance (Table 4) highlight Caloncoba welwitschii, Millettia eetveldeana and Millettia laurentii, in almost all plots. The average covering of these species lies between 37.5% and 87.5%. In the ex-Orstom plot, one underlines the presence of Strychnos variabilis, Macaranga spinosa and Bosqueiopsis gilletii whose average covering lies between 15% and 37.5%. In the facies of the zoological gardens (S2), Voacanga chalotiana and Macaranga spinosa are the two species which are predominant with an average covering of 37.5% each one. In the Parliament home plot (S3), it is Voacanga chalotiana, Hymenocardia ulmoides and Albizia ferruginea are species which dissociate with a covering of 15% each one.
Data on the classes of presence (Table 4) reveal that the constant species, in the three plots, are almost the same. It concerns Caloncoba welwitschii, Voacanga chalotiana, Macaranga spinosa, Millettia eetveldeana, Millettia laurentii and Hymenocardia ulmoides. As for the accidental species, the proportion varies depending on plot. In the ex-Orstom plot, the rate of the accidental species is of 52%, whereas it is 58% in the zoological gardens plot and 21% in the Parliament home plot.
3.2.5. Indices of Biological Diversity
The index of diversity of Simpson varies from 88% to 92% per plot, with an average of 0.9. As for the Shannon index, it oscillates from 2.1 to 3.3 (2.6 on average) per facies. Lastly, the equitability lies between 0.8 and 1, with an average of 0.9 (Table 5). Absolute diversity oscillates from 8 to 27 species per plot, with 15 species on average.
The index of the values of importance (Table 4) highlights Caloncoba welwitschii, Macaranga spinosa, Hymenocardia ulmoides, Millettia eetveldeana and Millettia laurentii, in almost all plots. However, the analysis by site reveals variations in floristic composition: in the exOrstom plot, these species are followed by Strychnos variabilis, Bosqueiopsis gilletii and Psydrax arnoldiana; in the zoological gardens plot, Voacanga chalotiana and Albizia ferruginea are the most characteristic species; in the Parliament home plot, to the characteristic species is added Dracaena arborea, Voacanga chalotiana, Anthocleista vogelii, Syzygium brazzavillense and Strychnos variabilis. The index of the values of importance of the families (Table 4) reveals that Achariaceae, Euphorbiaceae, Fabaceae, Phyllanthaceae and Rubiaceae characterize flora of the three plots. In addition to these families, Loganiaceae and Moraceae are most representative in the ex-Orstom plot; of Apocynaceae, Bignoniaceae, Gentianaceae, Loganiaceae and Myrtaceae in the Parliment home plot.
3.3. Structural Parameters
3.3.1. Diametric Distribution of the Woody
The diametric structure in the plots shows that the passage of a class of diameter to another is not regular (Figure 5). The trees of small diameters, in particular of classes one and two, are most numerous corresponding at 84% (either 385 trees) of total. The class seven is represented with an individual, corresponding at 0.2% of total trees.
3.3.2. Basal Area
Basal area (Table 5) of Patte d’Oie forest plots, varies from 11.2 to 15.6 m2∙ha−1, corresponding at an average of 13.4 m2∙ha−1. The contribution of the immigrant flora, by plot, varies from 4.8 to 9 m2∙ha−1 corresponding at a rate ranging between 35.8% to 57.7% of the total islet basal area. In this proportion of the immigrants species, Millettia laurentii represents only 16.1% to 43.6% per site.
4. DISCUSSION
4.1. Floristic Diversity Analysis
The data analysis floristic of the three plots of Patte d’Oie forest reveals a very low level of diversification. The inventory brings out 31 species for an area of 1.5 ha (Table 2). This value is understood in the interval of the data obtained by Kimpouni et al. [31], Heckestweiler and Mokoko-Ikonga [36] in the Aucoumea klaineana monodominante forest of the Atlantic area 4 to 25 species∙ha−1. However, it is lower than that is found by Kimpouni [37] in the dry mesophile forests of the Plateaux des Cataractes, in particular at Aubeville and Boko-Songho areas (56 to 90 species∙ha−1). Compared to the specific richness of the wet dense forests of Asia, of America and Africa where several authors like Gonmadje et al. [38], Kouka [32,39], Puig [40] and Koubouana [41] underline a richness from 102 to 134 species∙ha−1, the Patte d’Oie forest is poor in species. This floristic data can be interpreted like an authentication of the existence of particular forest facies, within the dry mesophile forests of the Basin of Congo.
The density of the three plots is about 153 trees∙ha−1. This value does not integrate the range of the values (265 to 547 trees∙ha−1) known of the tropical ombrophilous forests [31,37,38,40,42,43]. Owing to the fact that this density is lower than the data of the tropical dense forests, a fine analysis of the flora shows that the majority of taxa characterize the secondary formations (disturbed) and their contribution is approximately 70%. This predominance of heliophilous, ensured by Anthocleista vogelii, Chaetocarpus africanus, Hymenocardia ulmoides, Macaranga sp., Markhamia tomentosa and Caloncoba welwitschii, shows the deficit into longevity woody in
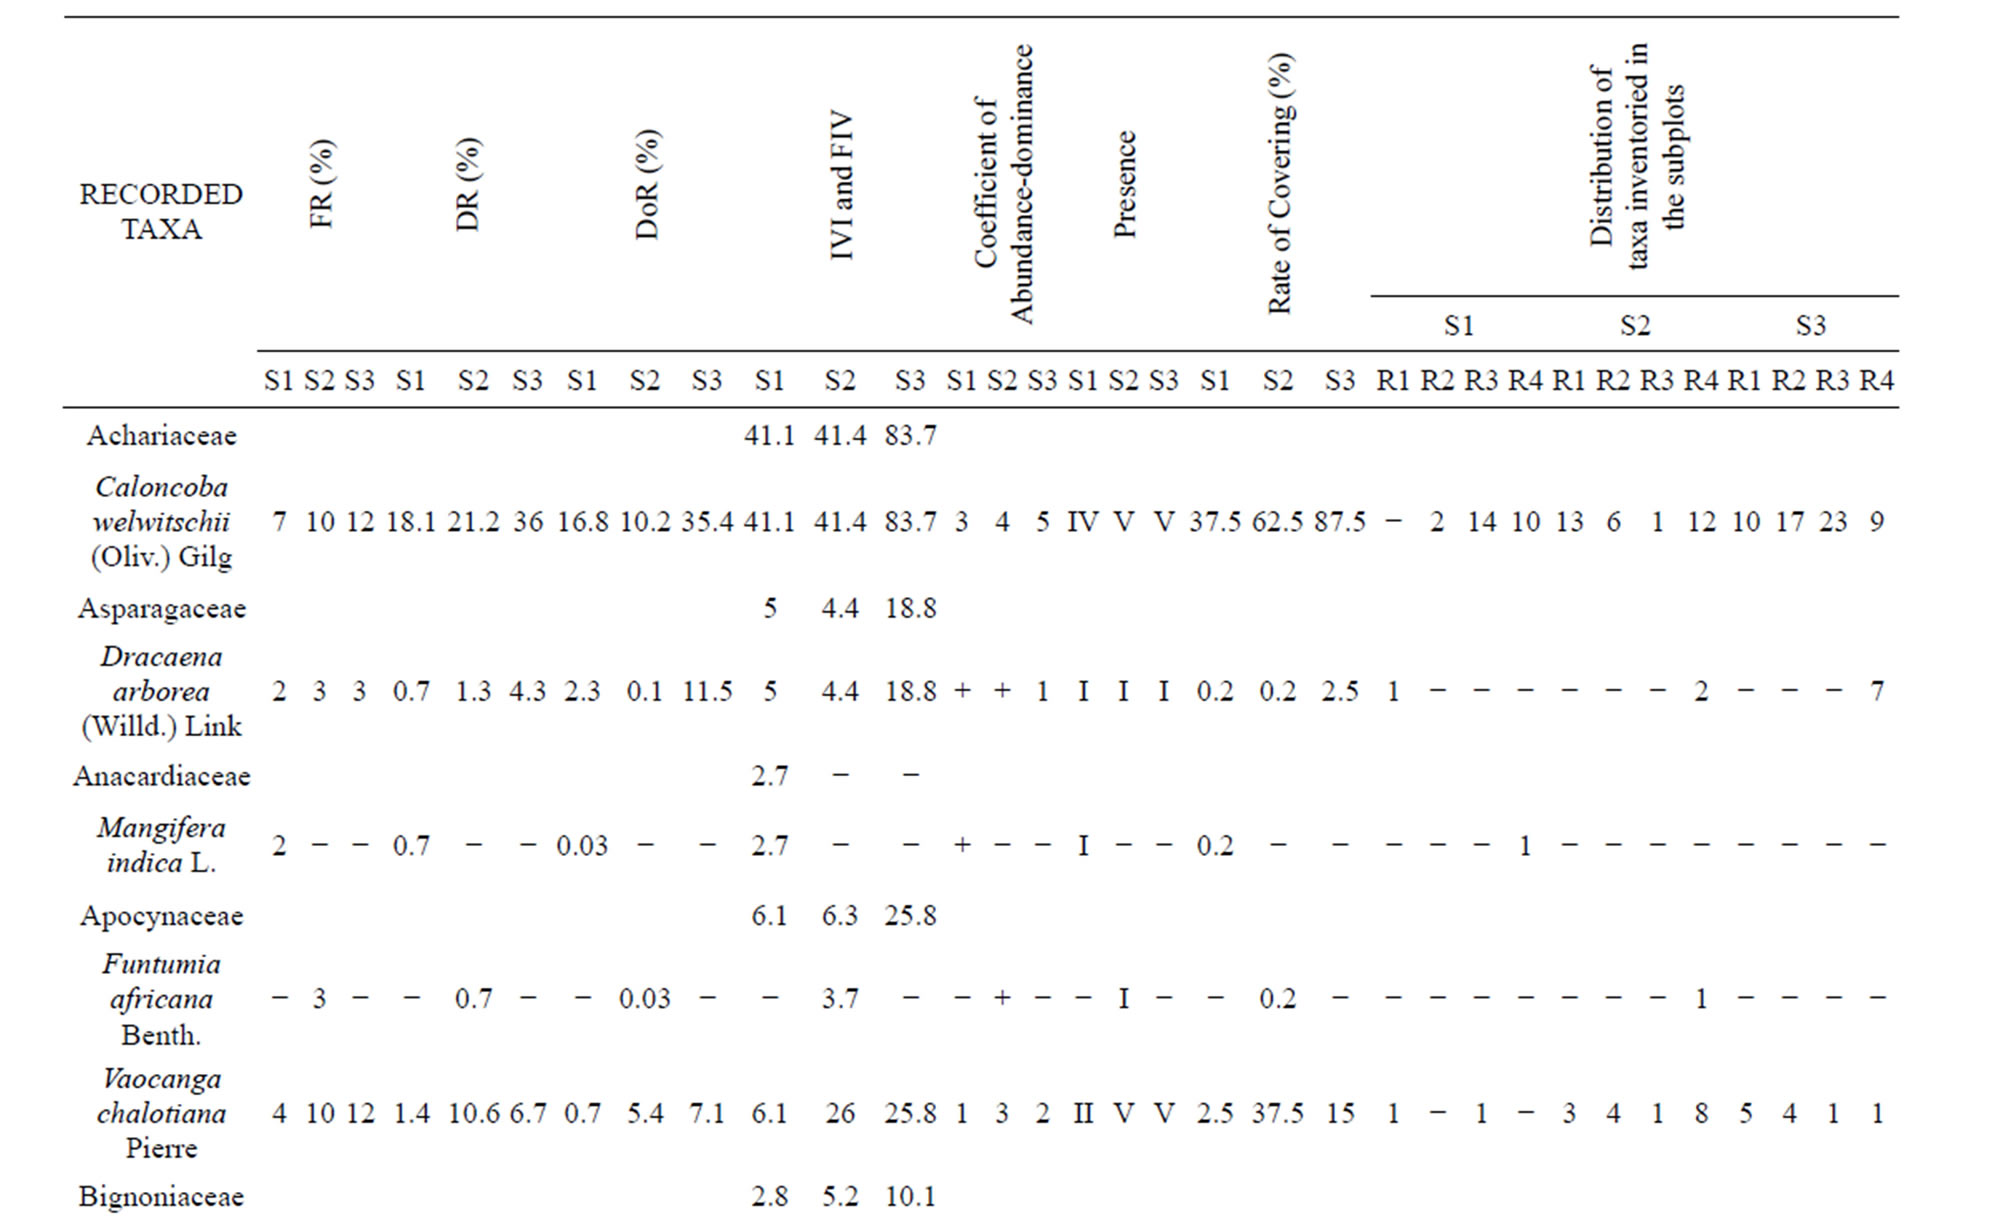
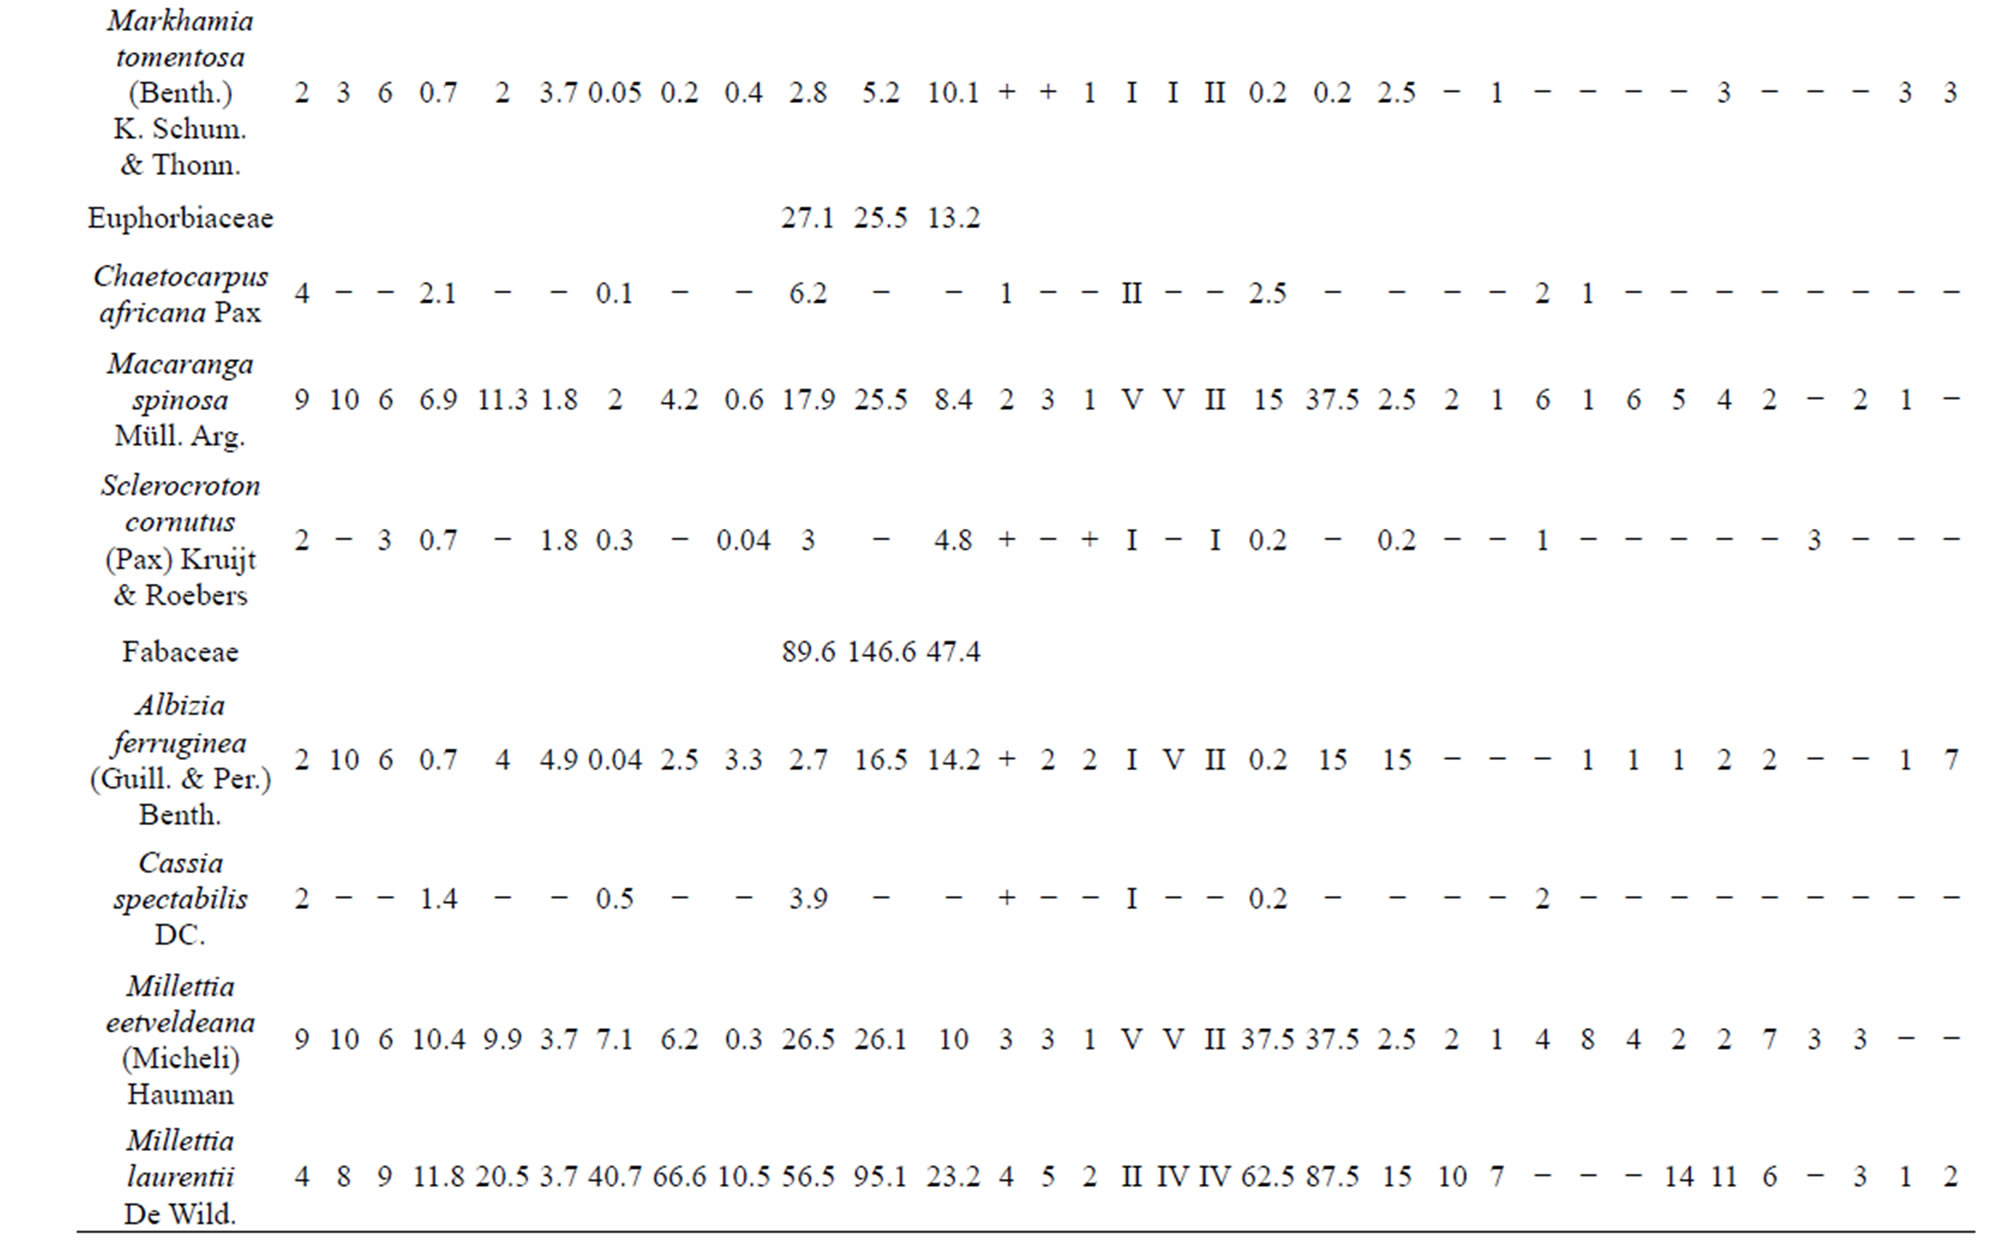
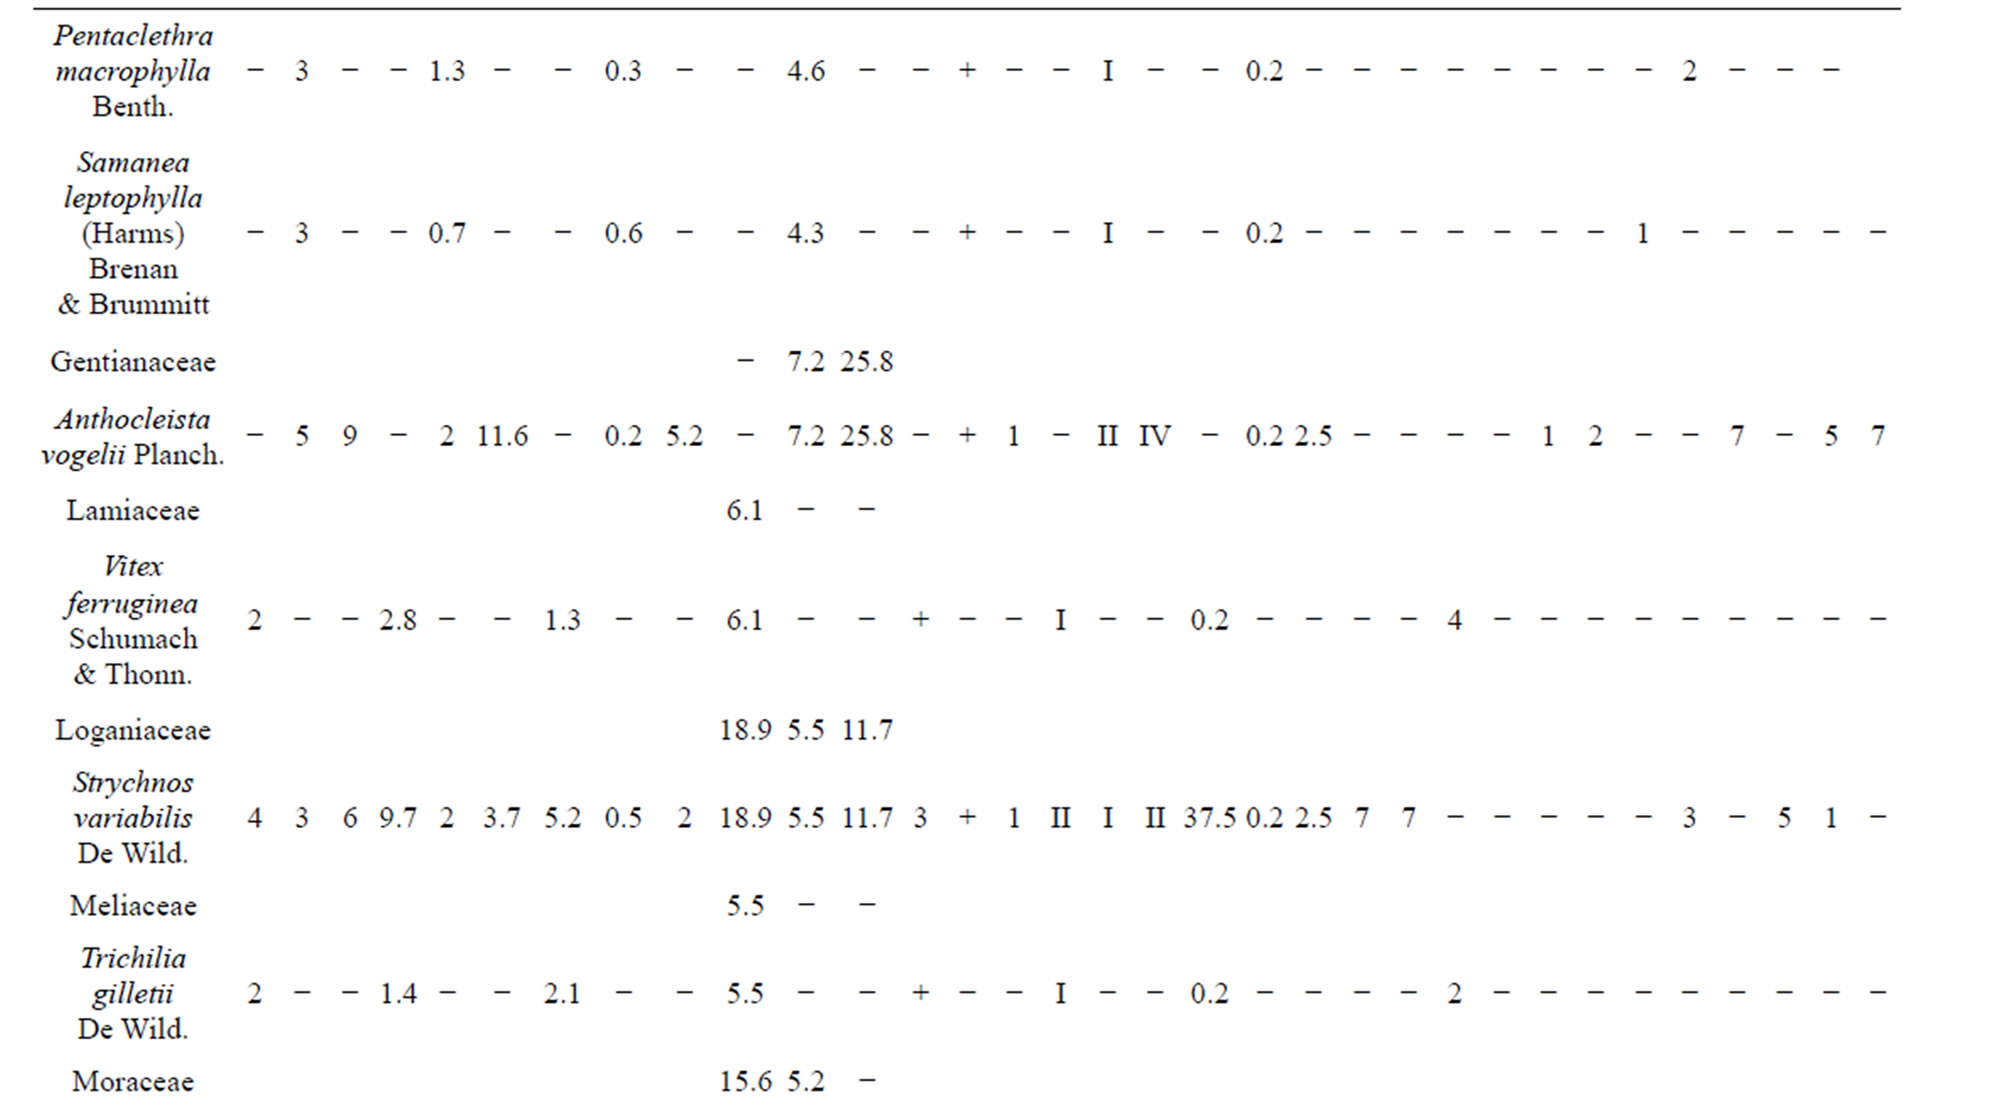
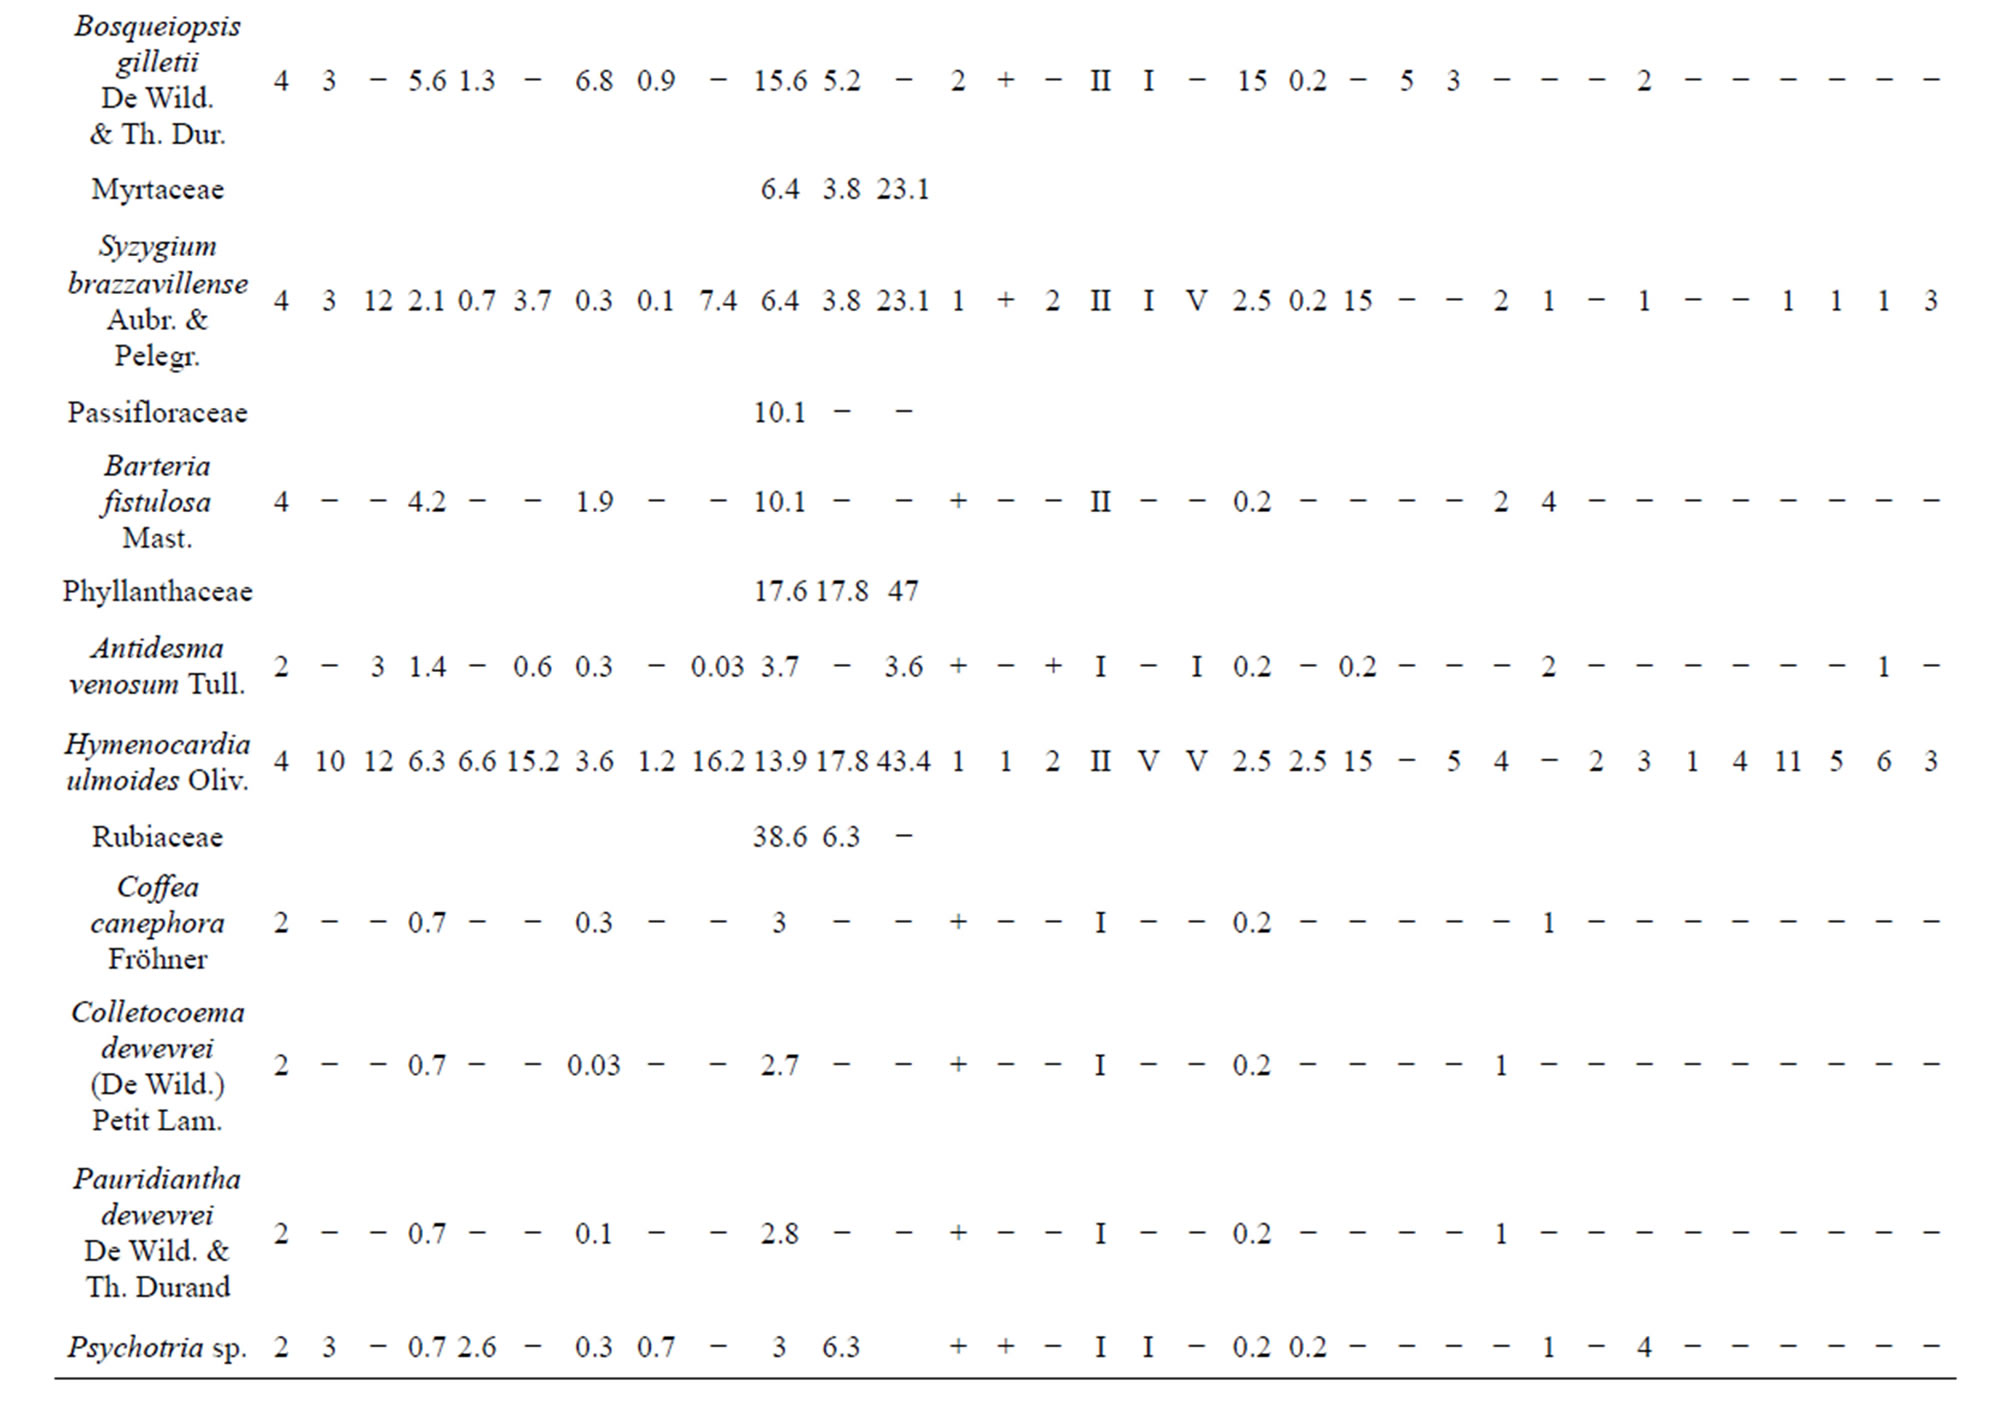
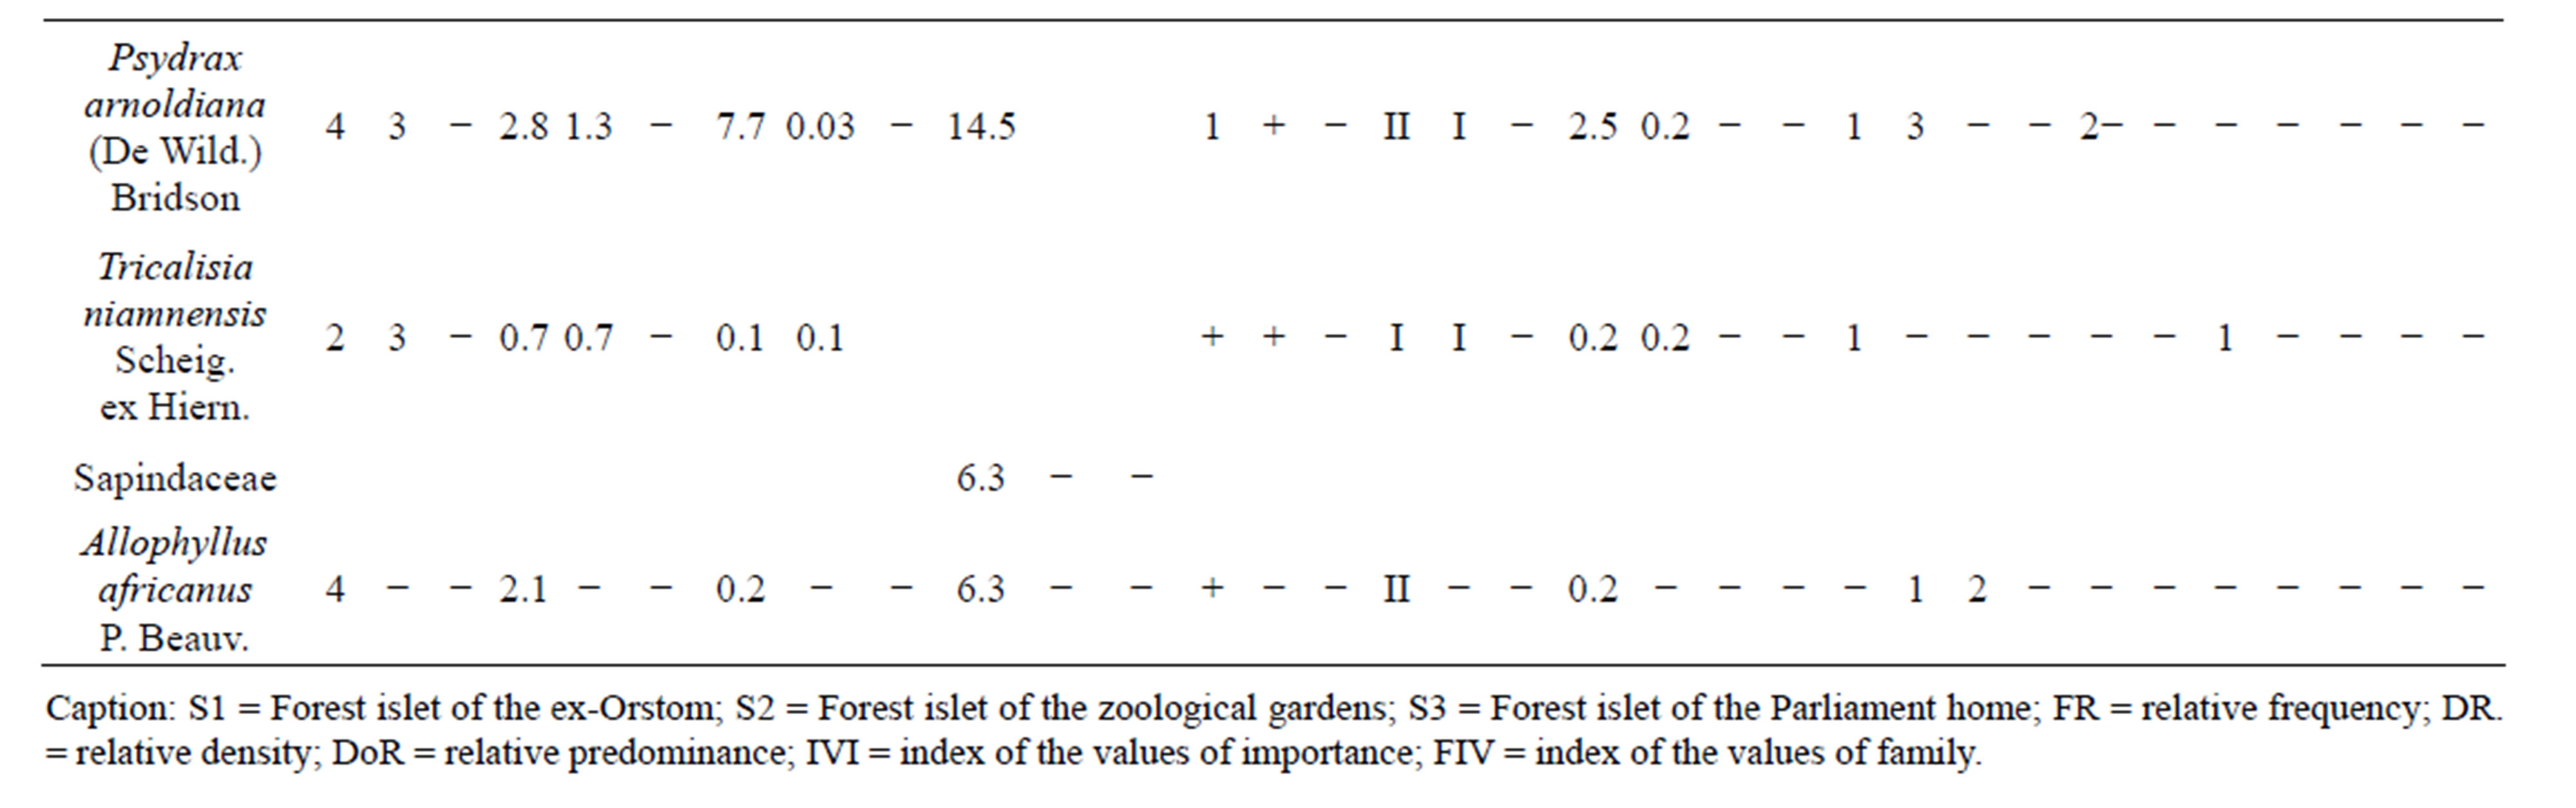
Table 4. General data on the inventoried species in the Patte d’Oie forest and the number of trees per plot.
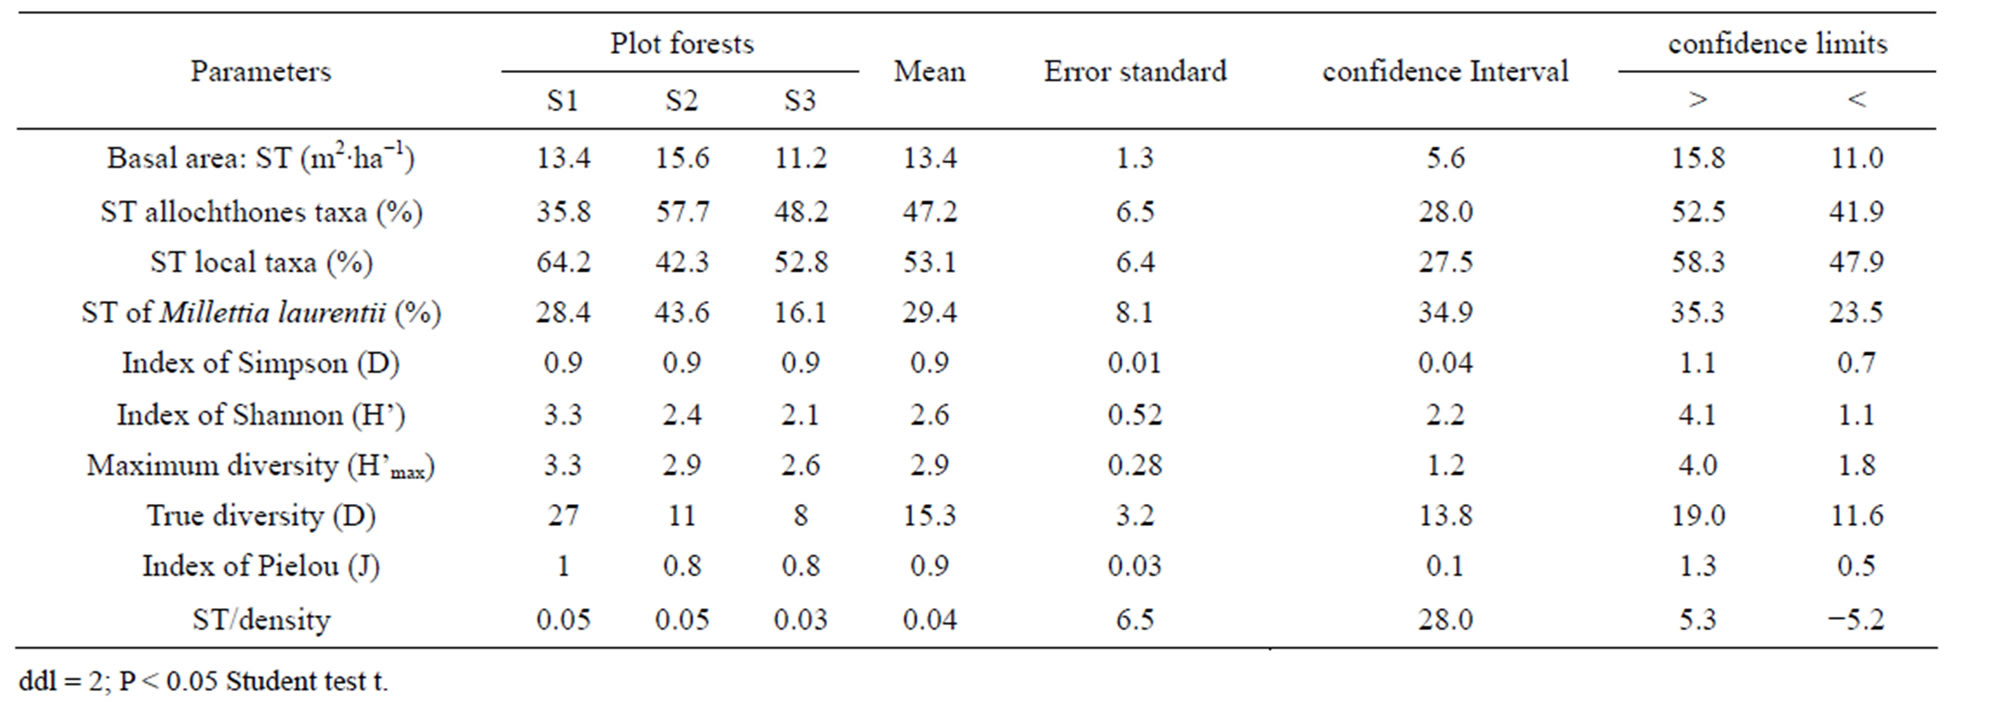
Table 5. Ecological parameters and contribution of the principal species on the basal area.
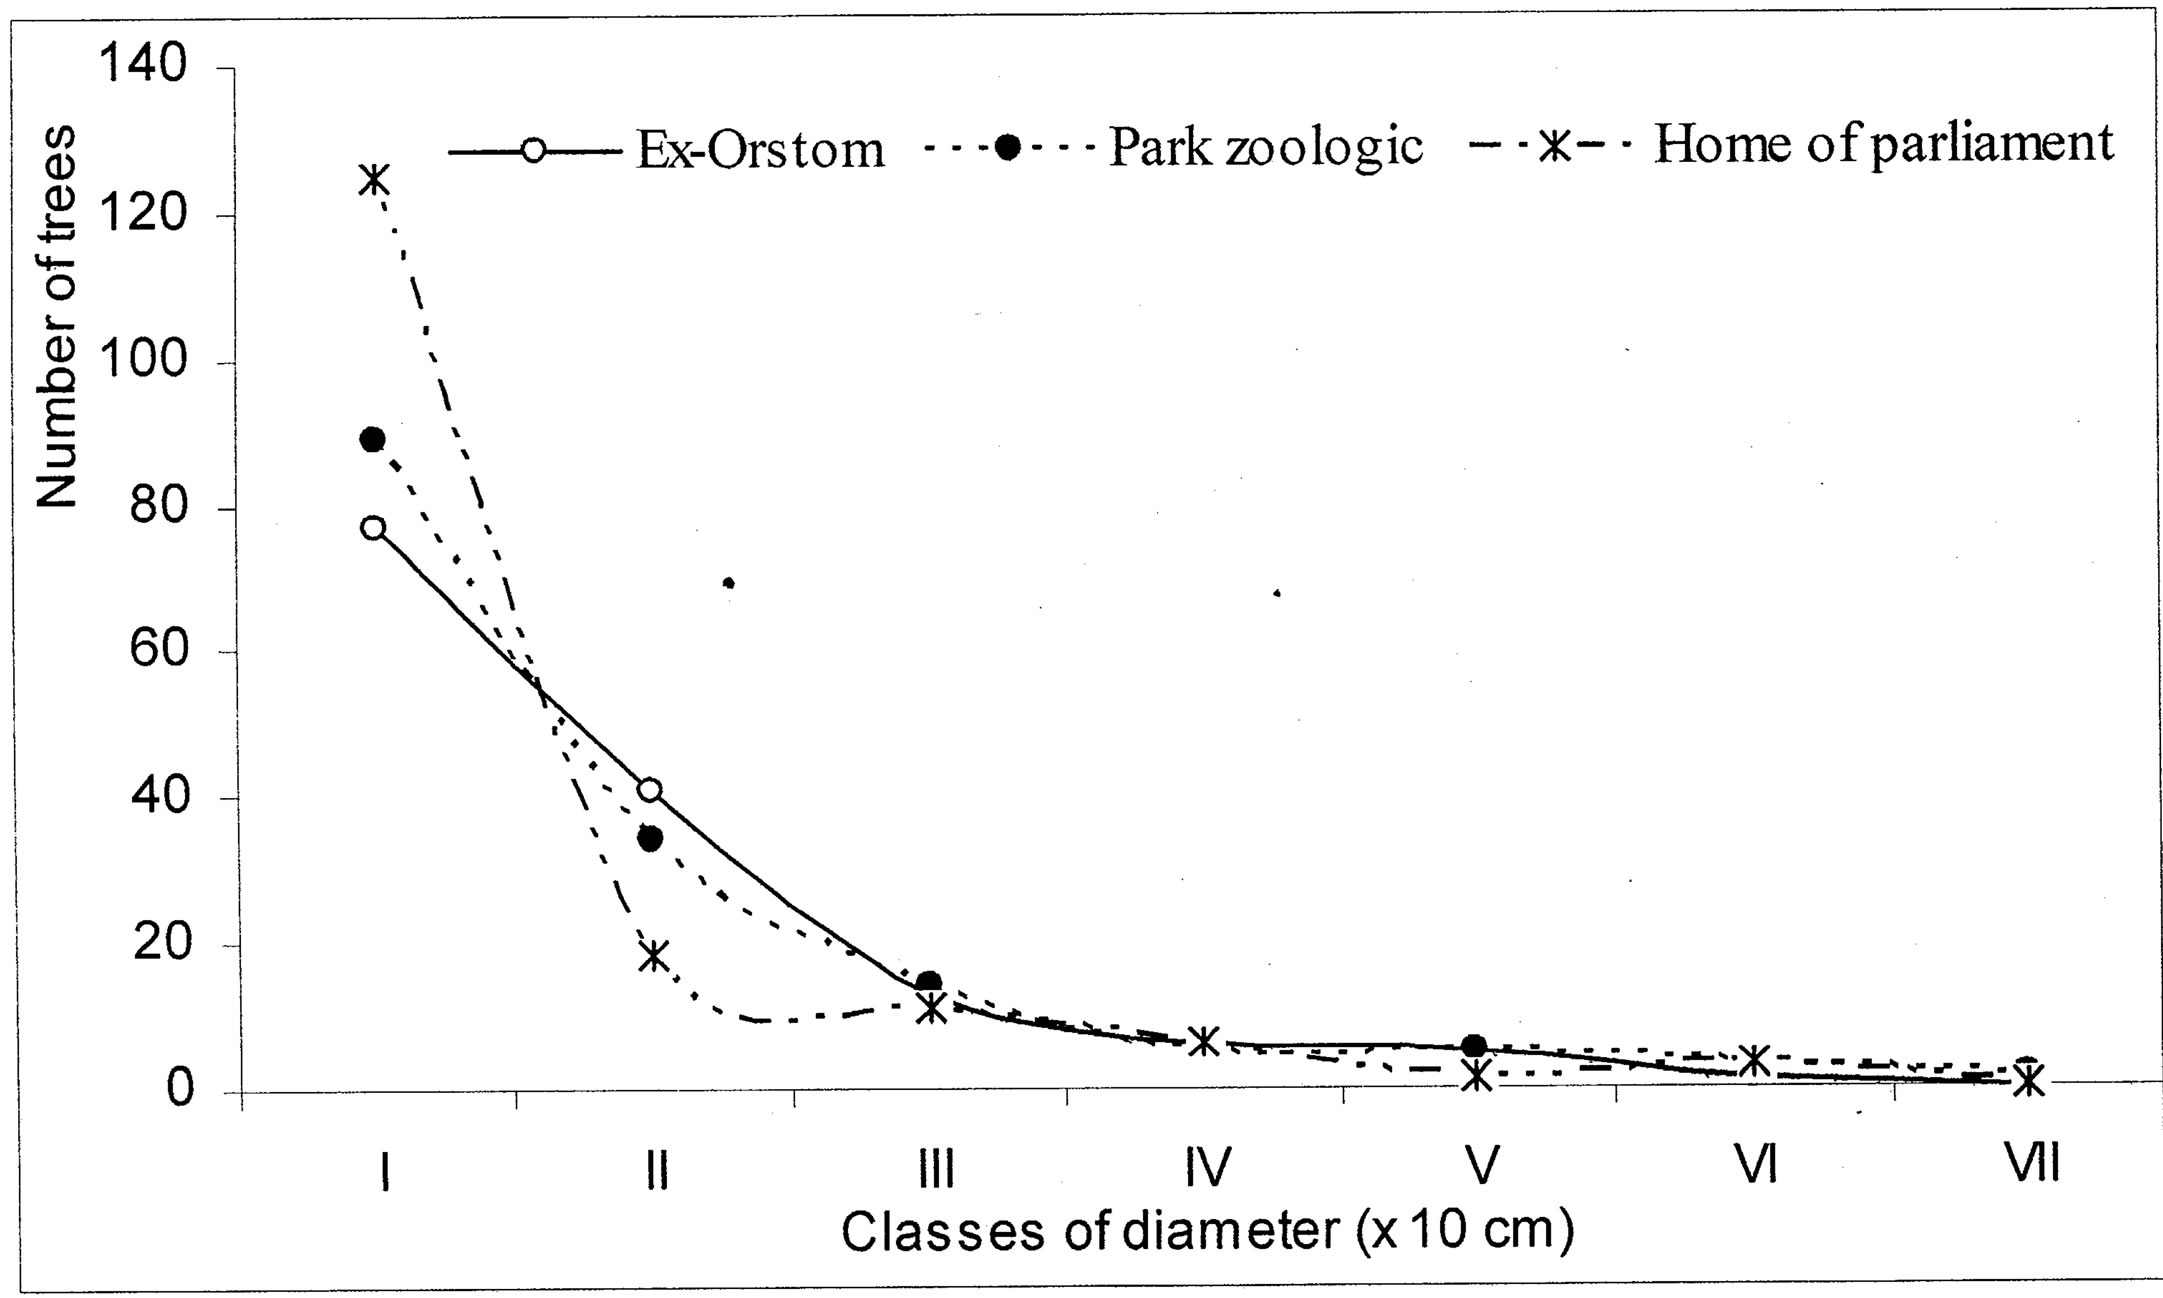
Figure 5. Comparison of the diametric structure of the woody enters the three forest islets.
these plots of forests. These ecosystems which are presented in the form of young systems (pioneers) in full dynamics of development, would be the resultant of the effects combined of enrichment in woody species, on the one hand, and, on the other hand, the artisanal exploitation, in particular of the woody plant, on a system less complexed and diversified.
A comparison of diversities alpha (α), beta (β) and gamma (γ), shows the floristic nuances between the forest plots. Diversity α varying from 14 to 27 is on average of 20 species whereas a diversity γ of 31 species (Table 2). As for diversity β, the number of different species between forests oscillates from 9 to 16, with 13.3 on average. The lowest diversity β is observed between the plot S2 and the plot S3 which are almost contiguous and have similar flora composition, whereas the difference between the plot S1 (completely insulated) and the two others is only one species. In keeping with subplots, diversity alpha (α) varies from 7 to 16 species in the exOrstom plot (S1), from 7 to 12 in the site of the zoological gardens plot (S2) and from 7 to 10 in the Parliament home plot (S3). However, diversity beta (β) between subplots oscillates from 3 to 9 species in the S1 site, from 0 to 5 in the S2 site and from 1 to 3 in the S3 site. The data of diversity beta reflect, as well on the level of the plot as of the subplots, a floristic variability. Rising from the deforestation of the same forest, this divergent evolution of the three plots of forests is due to human activities of different width, like the type of installation and enrichment. These observations are backed up by the indices of biological diversity and especially by the absolute diversity (15 on average) which mark floristic variability between the forest plots (Table 5). Indeed, the value of the entropy (H') of the index of diversity of Shannon is not a priori a measurement of diversity [34, 35]. Indices of biological diversity (Table 5) which are noted in plot S1 (D = 92% and H' = 3.3), whereas in S3 we have the weakest indices of diversity (D = 90% and H' = 2.1). The alpha diversity (α) data show that the three plots are slightly diversified, in spite of the fact that they did not know the same extent of the anthropic activities. The fact that an important portion of the forest was cut to white, in the plot S3, for afforestation with Eucalyptus, the not planted zone is recolonised by the heliophilous ones. Forest environment is ensured by Hymenocardia ulmoides, Anthocleista vogelii, Caloncoba welwitschii and Syzygium brazzavillense. The indices of biological diversity are inferior than the values found in certain forests of the Basin of Congo, in particular by Priso et al. [44] and Sunderland et al. [45] in Cameroon, on the one hand, Kimpouni et al. [31] and Kouka [32], on the other hand, in Congo, attest the low representativeness of several species in the studied forest plots. The index of regularity on average (0.9) is high in the three plots (Table 5), which testifies a balanced distribution to taxa with the various species. The coefficients of similarity from Sørensen (58.5% - 72.7%) and of Jaccard (41.4% - 57.1%) reveal that the floristic composition of plot S1 is different compared to others, which are almost juxtaposed. These values spread out the ecosystemic fluctuations of diversity beta (β) between the three plots, on the one hand, and, on the other hand, confirm the heterogeneous character of the flora:
• The forest of the ex-Orstom (plot S1) was used as field of experimentation since the installation of the IRSC in 1962 [5,8,46]. In this context, several species like Coffea sp., Psychotria sp., Phyllocosmus africanus, Cassia javanica, Samanea saman, Millettia laurentii, Pancovia laurentii, Delonix regia, Cananga odorata, Pinus sp., Pentaclethra macrophylla, were introduced. The follow-up of these species watch which they completed the process of naturalization, with the placement of sowings without human intervention;
• In the forest of the Zoological gardens (plot S2), the service in charge of the forests carried out since 1956 the enrichment of the station [5,46] with Albizia adianthifolia, Elaeis guineensis, Eucalyptus sp., Millettia laurentii, Samanea leptophylla, Terminalia superba, Pentaclethra macrophylla, Phyllocosmus africanus, etc.;
• The installation of Eucalyptus forests in the Parliament home forest (plot S3) is at the origin of the destruction of the natural forest. The zone where the Eucalyptus did not grow is recolonised by the pioneer species unknown life span. In addition to the Eucalyptus, an enrichment of this forest is in hand with longevity species of the wet dense forests like Terminalia superba, Entandrophragma sp., etc. [5,46].
As for basal area, the mean value of the three forest plots is of 13.4 m2∙ha−1 (Table 5). An analysis coupling the data of basal area and floristic diversity shows that these values are supported by the immigrant flora whose contribution oscillates from 13.8% to 69.7% (Table 5). Millettia laurentii which completed its process of naturalization with in Brazzaville, only ensure it 10.5% to 66.6% of basal area of the plots. The data of basal area confirm the deficit observed in the diametric distribution of the trees of large diameter, particularly of the indigenous flora, and specify the characteristic of this ecosystem. In addition to the contribution of the immigrant species, the value of basal area are as a whole rather close to those of the wet dense forests. They are of the order de 31 m2∙ha−1 for the Yapo forest in Ivory Coast [40] and in the Basin of Congo, from 21.2 to 67.6 m2∙ha−1 for the Cameroonian forests [38,45,47]; in R.D. Congo, Mosango [42] in the Kongolo island forest finds 39.7 m2∙ha−1; finally, in the Congo forest formations, Kimpouni et al. [31] and Hecketsweiler and Mokoko-Ikonga [36] the values are between 22.4 and 34.8 m2∙ha−1 in the Aucoumea klaineana Atlantic forests. However, the floristic composition being dominated by the pioneer species, basal area of the typical woody species is lower than those of the dry mesophile formations of the Plateaux des Cataractes, which is around 19.7 m2∙ha−1, but with a floristic composition definitely different and reflecting that from the wet dense forests [37].
4.2. Diametric Structure of the Woody Species Analysis
The distribution in classes of diameter of the listed trees (Figure 5) gives irregular curves. This structure of population is characteristic of the disturbed forests, which do not maintain a constant rhythm of installation of sowing [37,40,48]. We can then think to a young forest in full installation, considering the high proportion of the species marking regeneration. However, an analysis of the floristic composition of the woody species, in relation with regeneration, reveals 70% of pioneer species (Caloncoba welwitschii, Macaranga spinosa, Anthocleista vogelii and Hymenocardia ulmoides) very widespread and whose individuals mark the first two classes of diameter. The typical trees of the African tropical forest account for 30% of species (Millettia laurentii, M. eetveldeana, Voacanga chalotiana, Funtumia africana, Vitex ferruginea, Dracaena arborea, Syzygium brazzavillense and Bosqueiopsis gilletii), in the first two classes of diameter (Figure 5). Following competition intraand interspecific, very few individuals of the species characteristic of the dense forest of central Africa, will become large trees, from where rupture in recruitment within the classes of diameter.
4.3. Structure of Population for the Characteristic Species
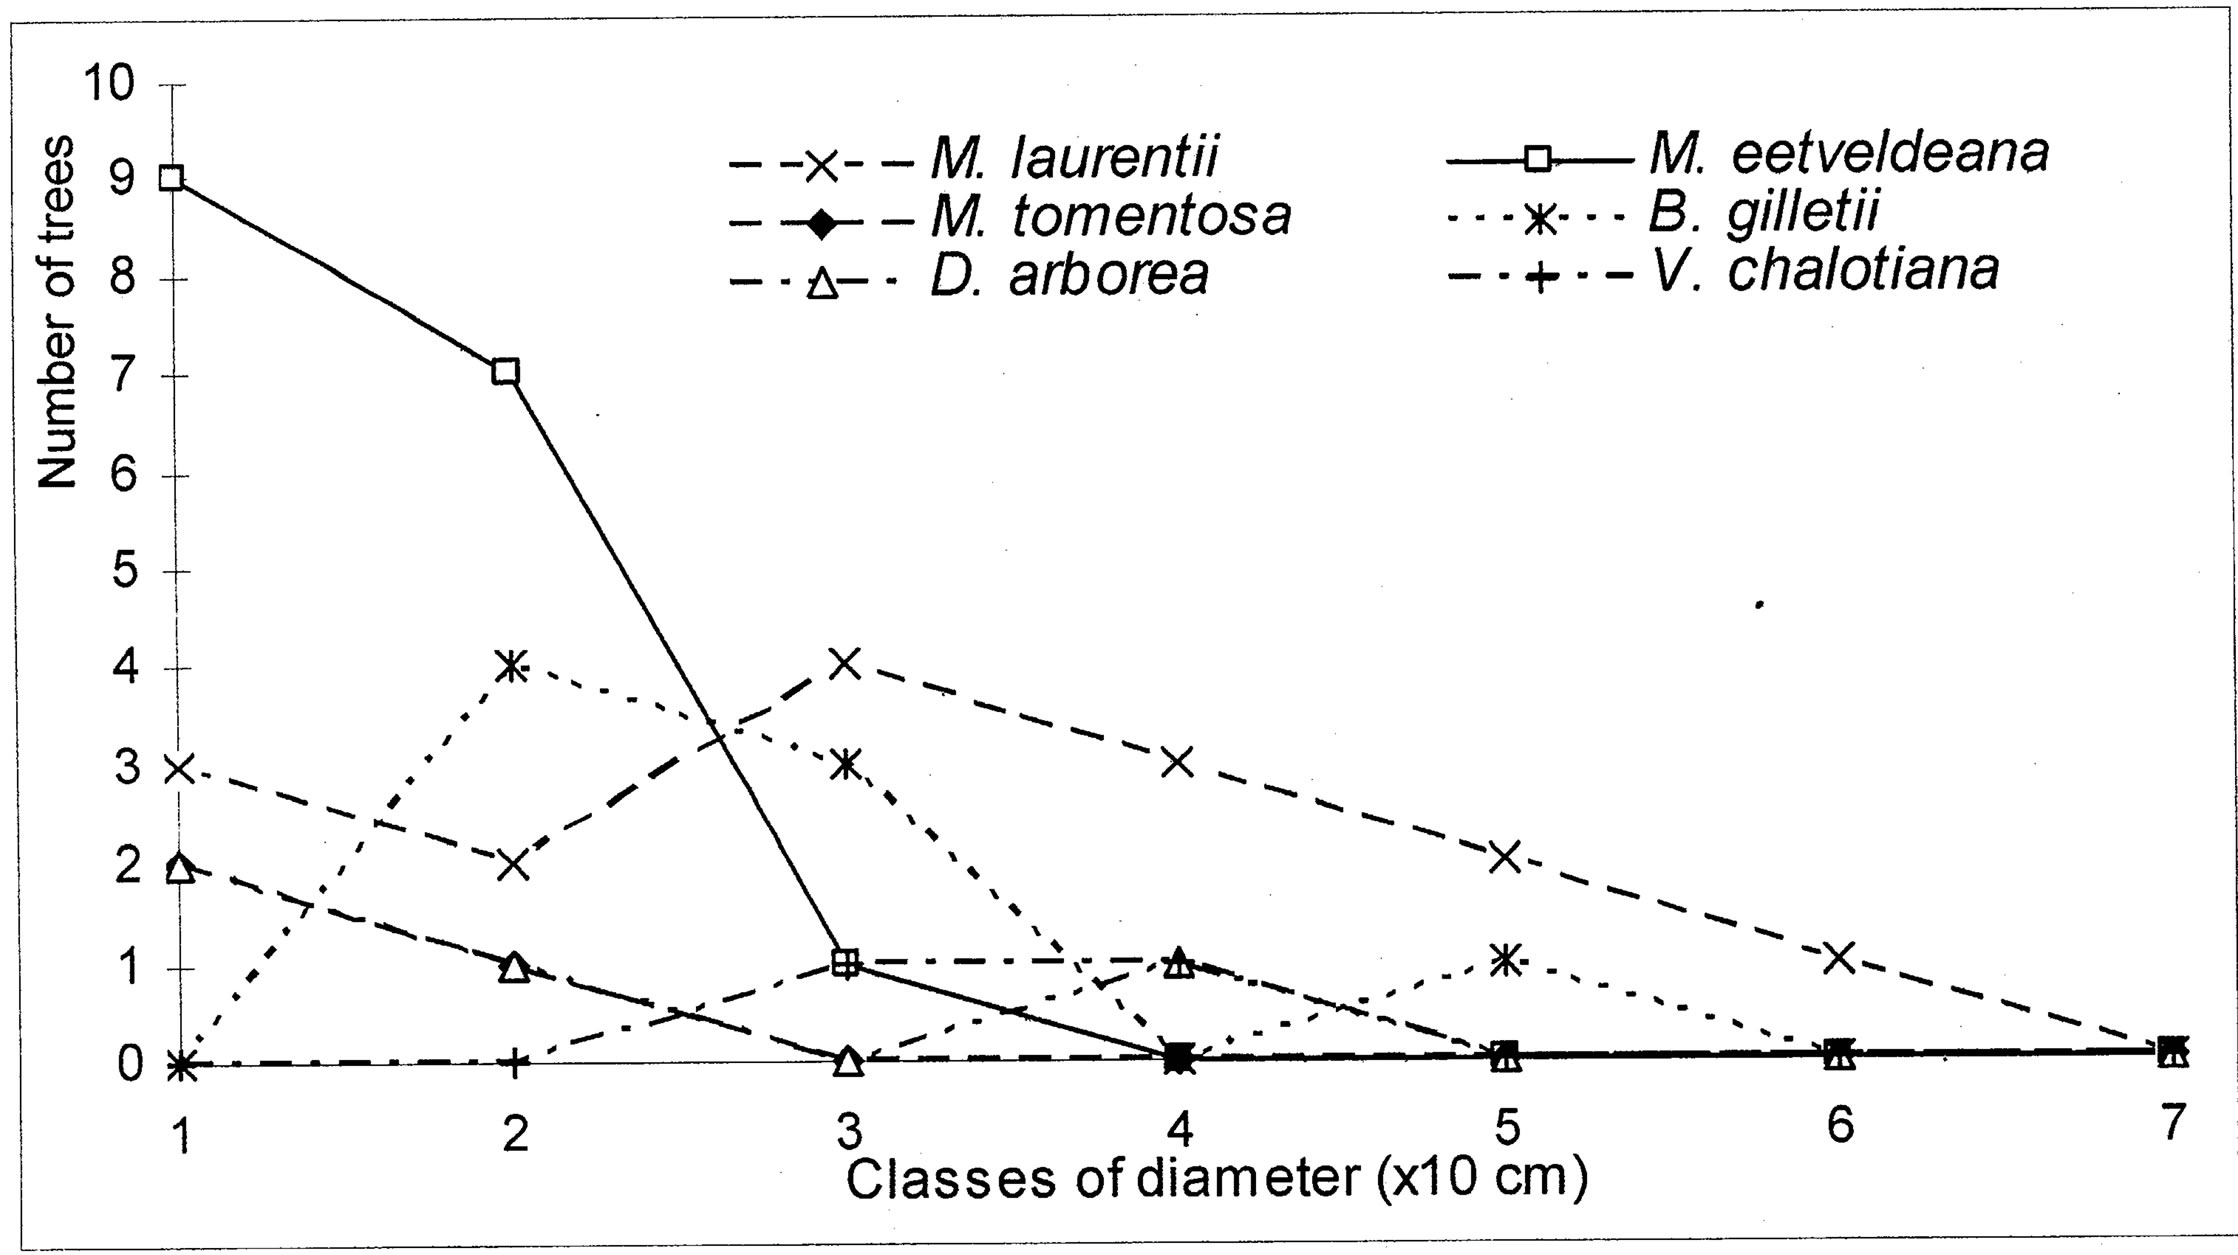
The evolution of the dbh of the most representative woody species (Markhamia tomentosa, Millettia laurentii, M. eetveldeana, Bosqueiopsis gilletii, Dracaena arborea and Voacanga chalotiana), in the three plots, reveals an erratic structure for each one of them (Figures 6(a)-(c)). This structure of population is the sign of a bad natural regeneration of this woody species. It is the consequence of an irregular recruitment within the classes of diameter [40,48]. This deficit of natural regeneration will be accentuated, in spite of the intrinsic and extrinsic factors to the plants, by the anthropic activities (crafts) requiring the cut of the small trees.
The floristic diversity distribution shows that the three plots did not undergo with the same intensity the anthropic action. Indeed, it is by order of more marked importance on the parliament home forest (plot S3) and zoological forest (plot S2) that on the ex-Orstom forest (plot S1). The level of degradation, of each forest islet, would be in relation with the statute which rules over it. The ex-Orstom and zoological gardens plots are respectively under the responsibility of the scientific research (after Orstom), for the first, and of the ministry in charge of the forests, for the second. Until a recent past, the access to these two sites was regulated, contrary to the parliament home forest which though managed by the ministry in charge of the forests did not profit from the same assets as the zoological garden forest. The comparison of the structural parameters of Millettia laurentii, with those of the other immigrant species and autochthones, in the three islets of the Patte d’Oie forest, would be the sign which confirms that this species is that which will characterize them in the future. Indeed, the analysis of basal area translates a phenomenon of change of the local flora by the immigrant flora. This observation is supported by the report of basal area on the density which, in the three plots, varies from 3 × 10⁻² to 5 × 10⁻². This ecological index which reveals taxa them the least represented in the inventory does not characterize only the individuals of large diameter. It reveals the dynamics of the diametric evolution, on the one hand, and on the other hand, the dynamics of the structure of the population and the change of the floristic composition [49]. Thus it is an indicator of the succession and evolution of the woody. The value of this index in the three plots being lower than 1 (Table 5), mark a predominance of the trees of small diameter. This phase characterizes the installation of a group of immigrant forest species, in particular Millettia laurentii. This species indicates the major sign of the replacement of the autochthones woody by a subspontenous population, better adapted to the new conditions of the station [33,49].
5. CONCLUSION
The islets of forest of Brazzaville, relics of the forest of the Patte d’Oie, associate an extreme specific poverty and a very low number of woody species of dbh ≥ 10 cm. Primarily composed of species pioneers, these plots of natural forest have a low level of impact strength. In addition, the strong density of the heliophilous species in the first two classes of diameters, confirms the high level of degradation of these forests and the deficit of natural regeneration of the longevity woody species of this ecosystem. Indeed, these individuals have a very high mortality rate because of the competition intra and interspecific natural and also of the anthropic action. The listed trees have erratic diametric structures, as a result of a high anthropisation of the station. It appears by trampling, wood-cuttings of crafts and the deposits of rubbish. In comparison with the state of degradation of the last vestiges of the natural forest of a particular type, all the ecological parameters back up the thesis of genetic and ecosystemic erosion. The presence of the herbaceous species and the artificiality of some zones are signs marking the change of the flora, so exceptional measures of management rational and sustainable are not taken for the safeguard of these natural forests. With the glance as of combined effects of the climate change on the biodiversity and the very marked level of degradation of the three plots of the Patte d’Oie forest, an analysis of the processes and evolutionary trajectories of these “urban forests” can prove to be relevant. This kind of dry mesophile forest which presents a particular floristic composition is not known, no elsewhere in the Republic of
 (a)
(a)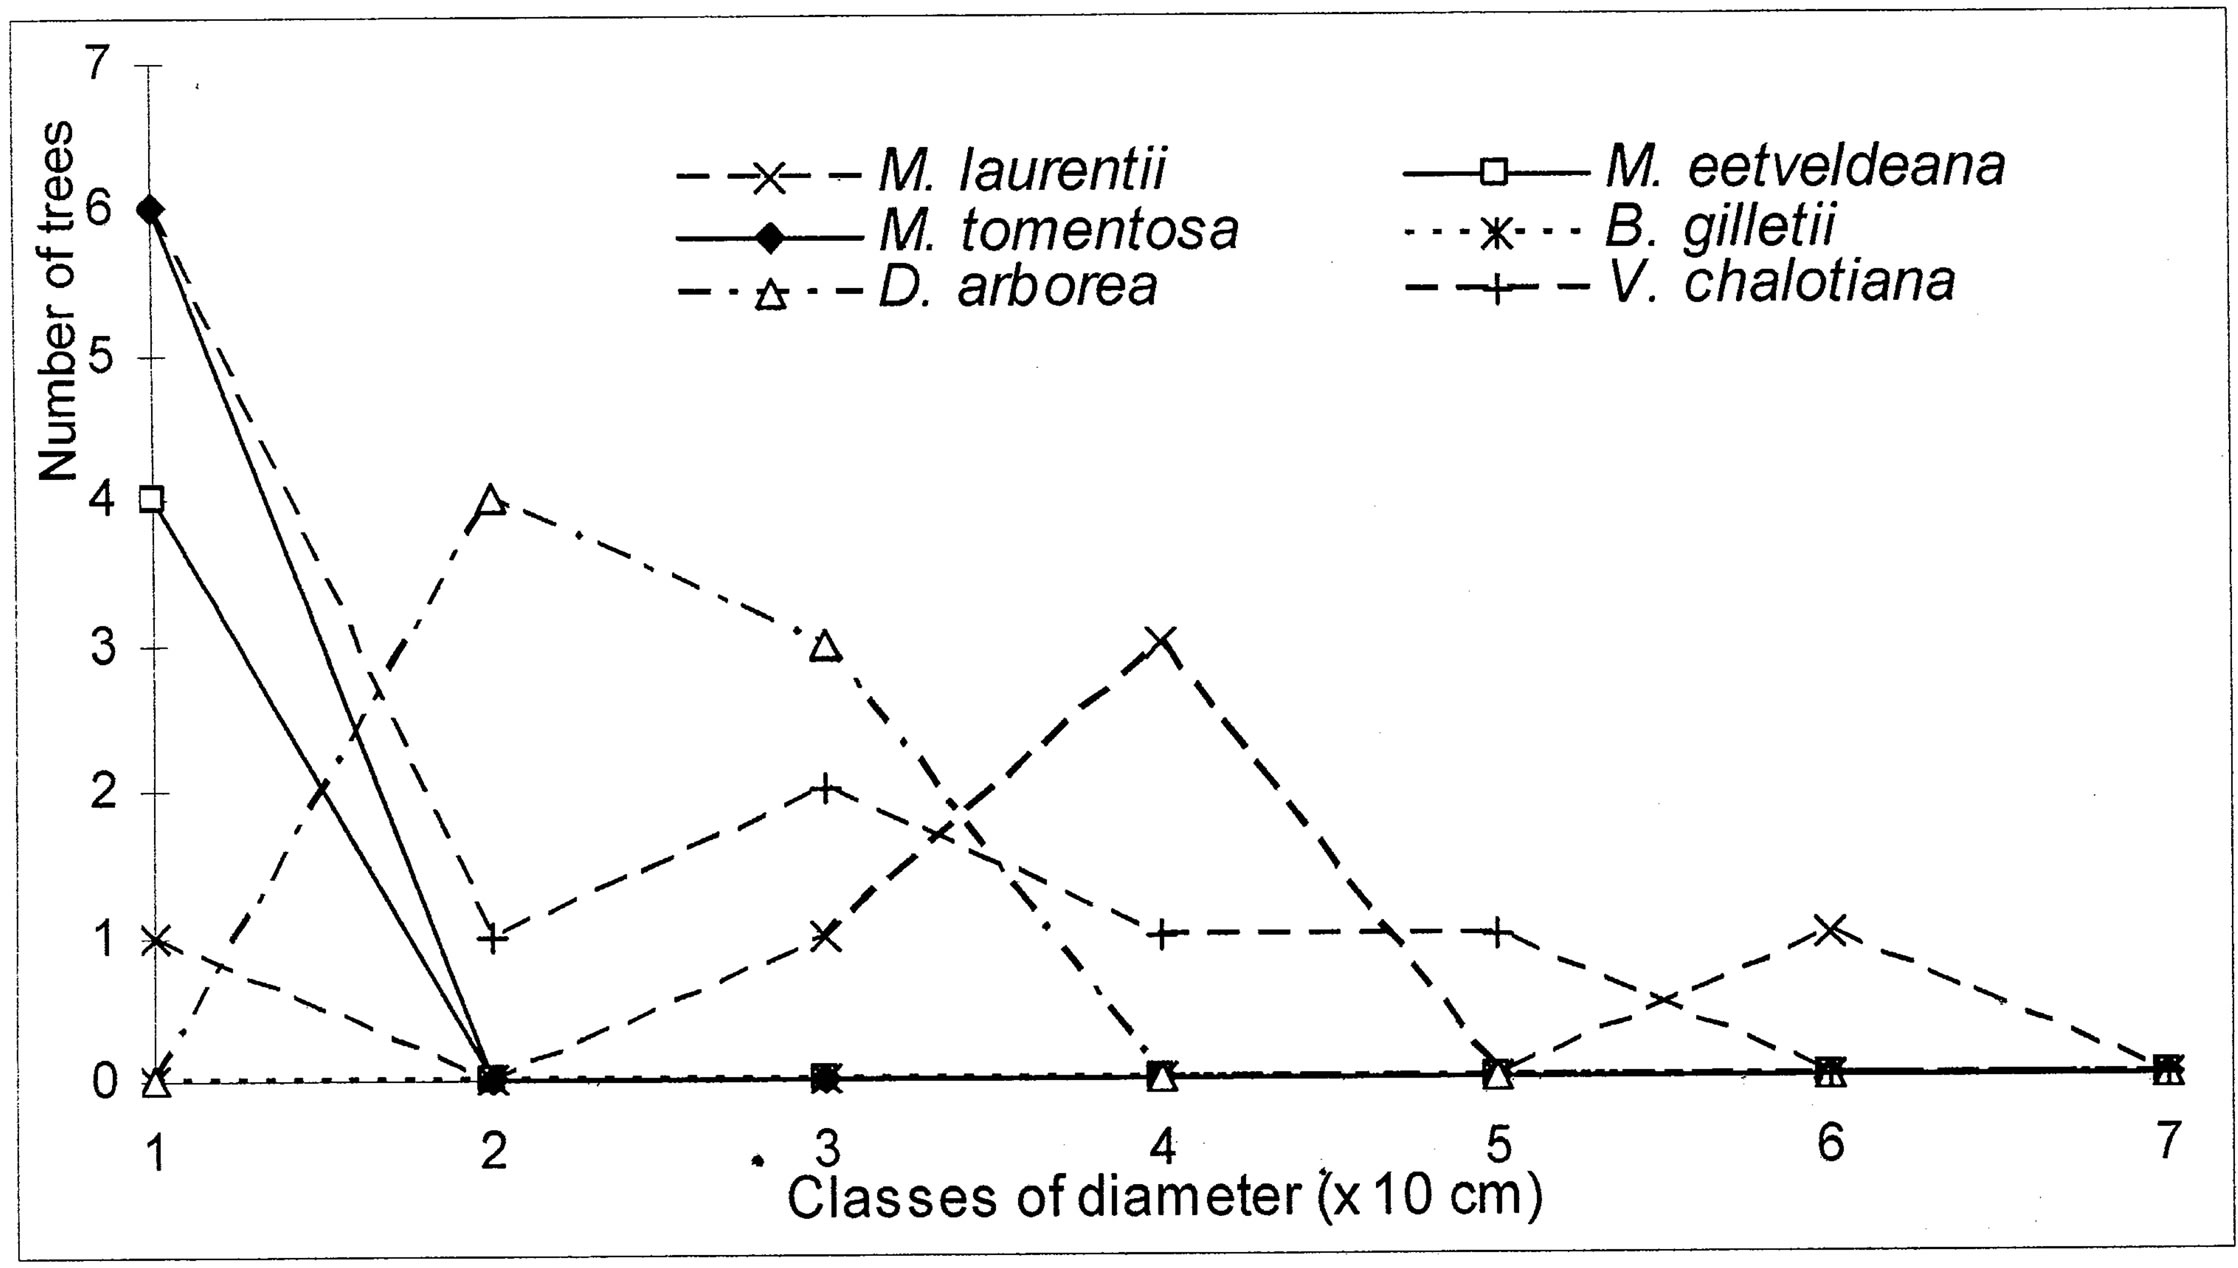 (b)
(b)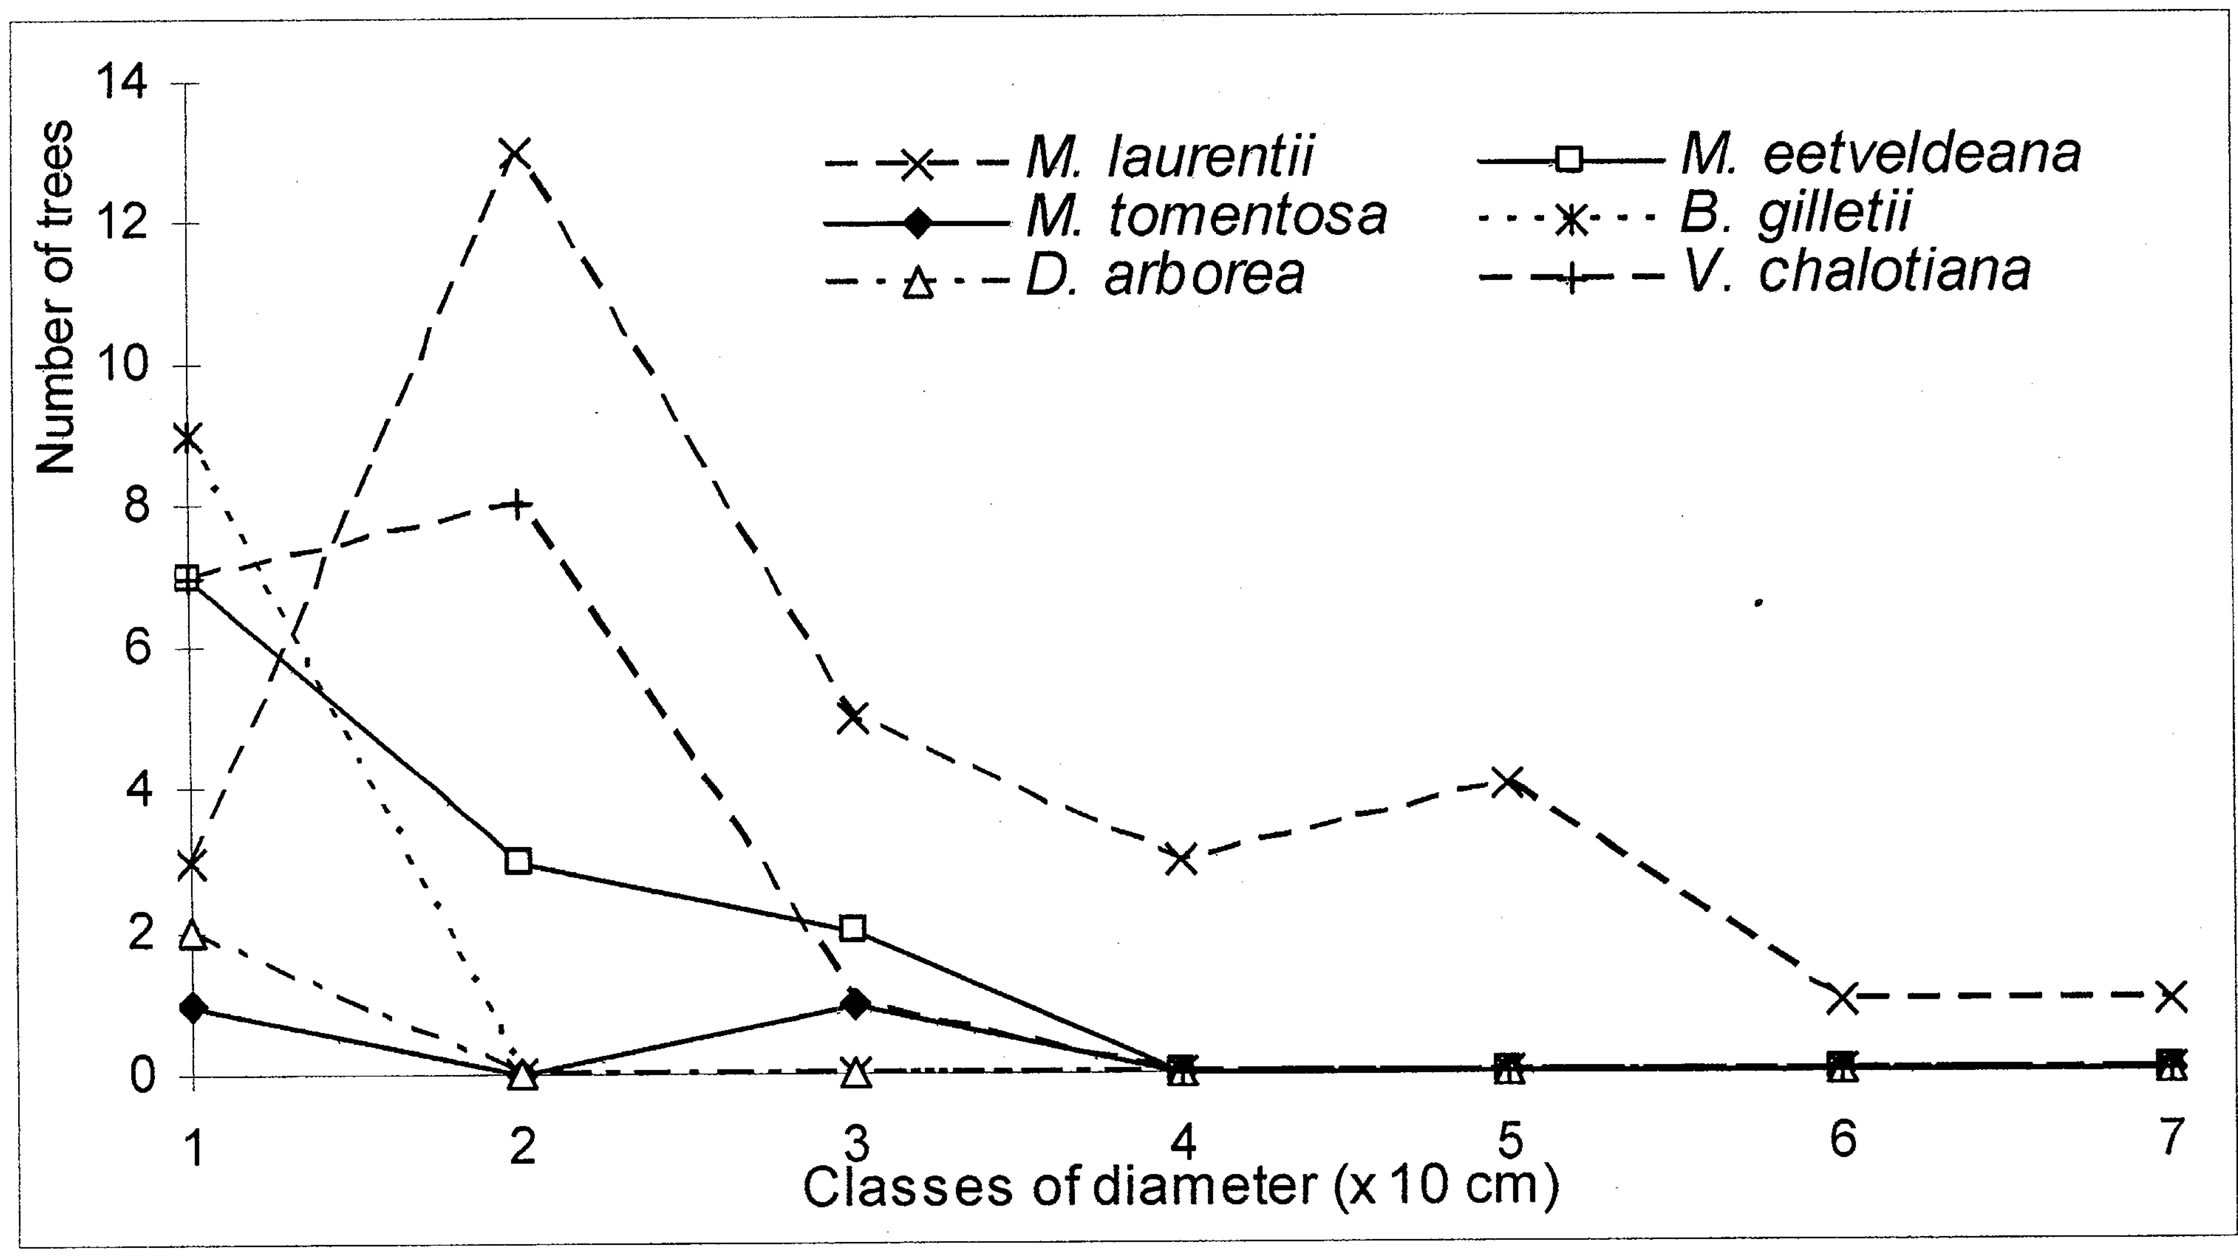 (c)
(c)
Figure 6. (a) Diametric structure of the principal species in the S1 site. (b) Diametric structure of the principal species in the S2 site. (c) Diametric structure of the principal species in the S3 site.
Congo, that in Brazzaville.
REFERENCES
- UICN (1996) L’atlas pour la conservation des forêts tropicales d’Afrique. UICN, Gland.
- Vennetier, P. (1977) Atlas de la République Populaire du Congo. Editions Jeune Afrique, Paris.
- Makany, L. (1976) Végétation des Plateaux téké (Congo). Collection des travaux de l’Université de Brazzaville, Brazzaville.
- Kimpouni, V., Lejoly, J. and Lisowski, S. (1992) Les Eriocaulaceae du Congo. Fragmenta Floristica Geobotanica, 37, 127-145.
- N’zala, D. and Miankodila, P. (2002) Arbres et espaces verts à Brazzaville (Congo). Bois et Forêts des Tropiques, 272, 88-92.
- Makoumbou, C. and Massamba-Kengue, A.A. (1999) Inventaire floristique et mode de dissémination des espèces végétales dans le Parc zoologique de Brazzaville. Mémoire CAPES, ENS/U.M.NG., Brazzaville.
- Ndinga, J.E. and Loupet-Mayitoukou, L.B. (1999) Dynamique de régénération de la forêt du Parc zoologique de Brazzaville. Mémoire CAPES, ENS/U.M.NG., Brazzaville.
- Gnendo, B. and Banzoulou, M. (1998) Étude de la vé- gétation de l’ORSTOM. Mémoire CAPES, ENS/U.M.NG, Brazzaville.
- Taty-Dekanga, C. and Mombouli, R. (1998) Étude quantitative et qualitative de la forêt du parc zoologique de Brazzaville. Mémoire CAPES, ENS/U.M.NG, Brazzaville.
- Aubréville, A. (1949). Climat, forêt et désertification de l’Afrique tropicale. La Rose, Paris.
- Samba-Kimbata, M.-J. (1978) Le climat bas-Congolais. Thèse de Doctorat, Université de Dijon, Dijon.
- Samba, G. and Nganga, D. (2011) Rainfall variability in Congo-Brazzaville: 1932-2007. International Journal of Climatology, 32, 854-873. http://dx.doi.org/10.1002/joc.2311
- Samba, G., Nganga, D. and Mpounza, M. (2008) Rainfall and temperature variations over Congo-Brazzaville, between 1950 and 1998. Theoretical and Applied Climatology, 91, 85-97. http://dx.doi.org/10.1007/s00704-007-0298-0
- Cosson, J. (1955) Notice explicative sur les feuilles, Pointe-Noire et Brazzaville. Carte de reconnaissance à l’échelle 1/50000, ORSTOM, Paris.
- Denis, B. (1970) Les sols de la région de Brazzaville. ORSTOM, Brazzaville.
- Zinga, J.J. (1992) Intérêt économique et aspects structuraux d’une forêt dense équatoriale: La forêt à Okoumé et ses savanes inclusives (Congo). Thèse de doctorat, Université de Rennes 1, Rennes.
- Pauwels, L. (1993) Nzayilu-Nti: Guide des arbres et arbustes de la région de Kinshasa—Brazzaville. Jardin Botanique de Meise, Belgique.
- APG III (2009) An update of the Angiosperm phylogeny group classification for the orders and families of flowering plants: APG III. Botanical Journal of the Linnean Society, 161, 105-121. http://dx.doi.org/10.1111/j.1095-8339.2009.00996.x
- Lebrun, J.P. and Stork, L. (1991-1997) Enumération des plantes à fleurs d’Afrique tropicale. Editions des conservatoire et Jardin botaniques de Genève, Genève.
- Dallmeier, F. (1992) Long-term monitoring of biological diversity in tropical forest areas, method of establishment and inventory of permanent plots. UNESCO, Paris.
- Martin, G.J. (1995) Ethnobotany: A method manual. Charpman and Hall, London. http://dx.doi.org/10.1007/978-1-4615-2496-0
- Adjanohoun, E.J., Ahyi, A.M.R., Ake Asi, L., Baniakina, J., Chibon, P., Cusset, G., Doulou, V., Enzanza, A., Eyme, J., Goudote, E., Keita, E., Mbemba, C., Mollet, J., Moutsambote, J.M., Mpati, J. and Sita, P. (1988) Contribution aux études ethnobotaniques et floristiques en République Populaire du Congo: Médecine traditionnelle et pharmacopée. ACCT, Paris.
- MCDonald, C., Smith, R., Scott, M. and Dick, J. (2010) Using indices to measure biodiversity change through time. METMAV International Workshop on spatio-temporal modeling, Santiago de Compostela.
- Halvorsen, R. and Edvardsen, A. (2009) The concept of habitat specificity revisited. Landscape Ecology, 24, 851- 861. http://dx.doi.org/10.1007/s10980-009-9363-7
- Jurasinsky, G., Retzer, V. and Beierkuhnlein, C. (2009) Inventory, differentiation, and proportional diversity: A consistent terminology for quantifying species diversity. Oecologia, 159, 15-26.
- Magurran, A.M. (2004) Measuring biological diversity. Blackwell Science Ltd., Oxford.
- Meffe, G.K., Nielsen, L.A., Knight, R.L. and Schenborn, D.A. (2002) Ecosystem management: Adaptive, community-based conservation. Island Press, Washington.
- Roberts, T.R. (1975) Geographical distribution of African freshwater fishes. Zoological Journal of the Linnean Society, 57, 249-319. http://dx.doi.org/10.1111/j.1096-3642.1975.tb01893.x
- Whittaker, R.H. (1972) Evolution and measurement of species diversity. Taxon, 21, 213-251. http://dx.doi.org/10.2307/1218190
- Legendre, L. and Legendre, P. (1984) Écologie numé- rique, Tome 1, traitement multiple des données écologiques. 2nd Edition, Masson, Paris.
- Kimpouni, V., Loumeto, J. and Mizingou, J. (2008) Diversité floristique du faciès forestier à Aucoumea klaineana (Okoumé) du littoral Congolais. Acta Botanica Gallica, 155, 323-334. http://dx.doi.org/10.1080/12538078.2008.10516113
- Kouka, L.A. (2006) Étude floristique des forêts du parc national d’Odzala (Congo Brazzaville). Acta Botanica Gallica, 53, 49-81. http://dx.doi.org/10.1080/12538078.2006.10515522
- Namur, C. (De) (1978) Quelques caractéristiques du développement d’un peuplement ligneux au cours d’une succession secondaire. Cahier ORSTOM, série Biologique, 13, 211-221.
- Jost, L. (2006) Entropy and diversity. Oikos, 113, 363- 375. http://dx.doi.org/10.1111/j.2006.0030-1299.14714.x
- Jost, L. (2009) Mismeasuring biological diversity: Response to Hoffmann and Hoffmann Ecological Economics, 68, 925-928. http://dx.doi.org/10.1016/j.ecolecon.2008.10.015
- Hecketsweiler, P. and Mokoko-Ikonga, J. (1991) La réserve de Conkouati: Congo, le secteur sud-est. UICN, Gland.
- Kimpouni, V. (2008) Premières données sur la diversité floristique de la forêt d’Aubeville (Congo—Brazzaville). Systematics and Geography of Plants, 78, 47-62.
- Gonmadje, C.F., Doumenge, C., Mckey, D., Tchouto, G.P.M., Sunderland, T.C.H., Balinga, M.P.B. and Sonke, B. (2011) Tree diversity and conservation value of Ngovayang’s lowland forests, Cameroon. Biodiversity et Conservation, 20, 2627-2648. http://dx.doi.org/10.1007/s10531-011-0095-z
- Kouka, L.A. (2001) Biotopes et diversité des groupements phytogéographiques dans la flore du parc national d’Odzala (Congo-Brazzaville). Systematics and Geography of Plants, 71, 827-835. http://dx.doi.org/10.2307/3668721
- Puig, H. (2001) La forêt tropicale humide. Belin, Paris.
- Koubouana, F. (1997) Étude de la dynamique de reconstitution des forêts de la réserve de Conkouati: Secteur Ouest. Rapport d’étude, PROGECAP/GEF, Congo.
- Mosango, M. (1991) Contribution à l’étude botanique et géochimique de l’écosystème forêt en région équatoriale (île Kongolo-Zaïre). Belgian Journal of Botany, 124 167- 194.
- Huetz De Lemps, A. (1970) La végétation de la terre. Masson & Cie, Paris.
- Priso, R.J., Din, N., Dibong, S.D., Taffouo, V.D., Kamdem, J.P., Tchachou, M. and Amougou, A. (2010) Biodiversité et paramètres de structure dans la réserve forestière du bois des singes et la zone forestière de Bangué (Douala, Cameroun). In: van der Burgt, X., Van der Maesen, J. and Onana J.-M., Eds., Systématique et Conservation des Plantes Africaines, Royal Botanic Gardens, Kew, 265-272.
- Sunderland, T.C.H., Comiskey, J.A., Besong, S., Mboh, H., Fonwebon, J. and Dione, M.A. (2003) Vegetation assessment of Takamanda forest reserve, Cameroon. In: Comiskey, J.A., Sunderland, T.C.H. and Sunderland, G.J.L., Eds., Takamanda: The Biodiversity of an African Rainforest, Smithsonian Institution, SI/MAB series 8, Washington, 19-53.
- Mbou, P. (2009) Structure et typologie des îlots forestiers naturels de la Patte d’Oie (Brazzaville). Mémoire CAPES, ENS, UMNG, Brazzaville.
- Dibong, S.D., Din, N. and Priso, R.J. (2003) Diversité floristique et structure des forêts entre la plaine littorale et le plateau sud camerounais. Science and Technology Development, 10, 7-15.
- Peters, C.M. (1997) Exploitation soutenue des produits forestiers autre que le bois en forêt tropicale humide: Manuel d’initiation écologique. BSP, Washington.
- Doumenge, C. (1990) Contribution à l’étude des structures des populations d’arbres des forêts d’Afrique Centrale (Exemples du Gabon, Cameroun et Congo). Thèse de doctorat d’État, Université de Montpellier II, Montpellier.