Open Journal of Genetics
Vol.4 No.4(2014), Article
ID:48052,16
pages
DOI:10.4236/ojgen.2014.44029
The Development and Application of an Indirect ELISA Test for the Detection of Chicken Anaemia Virus (CAV) by VP1 in Chicken Flock Serum
Elham O. Mahgoub
Alneelain Medical Research Center, Faculty of Medicine Department of Microbiology and Unit of Immunology, Al-Neelain University, Khartoum, Sudan
Email: ilhamomer@yahoo.com
Copyright © 2014 by author and Scientific Research Publishing Inc.
This work is licensed under the Creative Commons Attribution International License (CC BY).
http://creativecommons.org/licenses/by/4.0/


Received 4 May 2014; revised 3 June 2014; accepted 2 July 2014
ABSTRACT
Chicken anaemia virus (CAV) causes a viral disease in chickens worldwide and thus has economic importance. The main aim of this study was to develop a rapid, sensitive and specific VP1-CAVI indirect ELISA for the detection of CAV infection. The CAV-VP1, was separately cloned and expressed in recombinant E. coli. The purified recombinant CAV-VP1 protein was then coated as an antigen on an ELISA plates to evaluate its reactivity against chicken sera. The resulting indirect ELISA was then compared with a commercial ELISA. The specificity and sensitivity of the indirect ELISA were measured as 93.3% and 100%, respectively. A t-test produced a t-value of 15.805 for the indirect ELISA and revealed a significant difference between CAV-positive serum and CAV-negative serum (p-value of 0.001). For the second variable (i.e., a commercial ELISA), the t-test yielded a t-value of 5.063, which revealed a significant difference between CAV-positive serum and CAV-negative serum (p-value of 0.015). This intervention produces statistically significant improvements in both variables (p-values < 0.05). The correlation coefficient for the indirect ELISA was r = 0.93. Therefore, this work can be considered as a new achievement in diagnosis for Chicken anaemia virus in chicken flocks.
Keywords:Indirect ELISA, Commercial ELISA, Chicken Anaemia Virus, Recombinant Protein VP1, Sensitivity, Specificity, Standard Curve for Indirect ELISA

1. Introduction
Chicken anaemia virus (CAV) is an important disease infecting chicken worldwide. It kills chicken by causing plastic anaemia in chicken [1] . It is small, (2.3 kb) and icosahedra in shape. The virus contains single stranded, circular DNA-genome [2] [3] . It produces a clinical disease that usually affects young chicks following vertical transmition in eggs. Infected chicks show increased mortality associated with anaemia, hyperplasia of bone marrow and lymphoid depletion. CAV also causes a sub-clinical disease predominant problem in affected farm [4] . CAV has three immunogenic major proteins. First is the viral protein 1 (VP1), which is the only component found in the capsid viral protein [5] [6] . Second is viral protein 2 (VP2) which was suggested an early gene regulatory protein [7] or a scaffold protein that interacts transiently with VPI [6] [8] . The protein has an important role in the formation of the CAV neutralizing epitope on VP1. Third is viral protein 3 (VP3), which causes apotosis in avian transformed lymphoblastoid infected cells as well as several human tumour cells [6] [9] .
However, economic losses of anaemia dermatitis syndrome can be attributed to many factors such as: stem from increased animal mortality rates, the cost of antibiotics used to control secondary bacterial infections and poor animal growth as described by Mcllory et al. [10] . It reported that broiler flocks with anaemia dermatitis, which contained an average of 29% of birds from vertically transmitting parent flocks, yielded 17.3% - 19.6% lower numbers than that of unaffected flocks. Furthermore, the variation in the distribution of average weights in the affected broiler flocks was significantly greater than the variation in the normal flocks. The economic loss from flocks that developed clinical disease was greater than that of flocks that were sub-clinically infected. Epidemiological studies have shown that almost all 1-day-old chicks, but not adult chickens, are susceptible to CAV infection as a clinical syndrome [11] [12] . Therefore, the immunisation of mother chickens with a vaccine that elicits virus neutralising antibodies is the major approach used to protect chicken flocks.
Several methods have been employed to develop conventional assays to detect CAV infection, such as serological tests for the identification of CAV antibodies. Recently, immune-histochemistry (IHC) and immunofluorescence (IF) have been used as alternative methods for detecting CAV antigen [4] [11] [13] -[15] . Sun et al., [16] described an indirect ELISA, coated with VP1-CAV fusion protein, as a useful method for screening large numbers of the avian population. However, an Indirect ELISA has disadvantages, including that the target proteins can be denatured relatively easily during processing [17] , and therefore, the target protein epitopes may not be present or detectable by the secondary antibodies.
The aim of this study was to develop an indirect ELISA coated with VP1-CAV antigen that is more sensitive and specific for the detection of Chicken Anaemia Virus (CAV). Enzyme-linked immunosorbent assay (ELISA) is a serological detection technique that is based on the use of enzyme-labelled antigens and antibodies where the resulting conjugates have both immunological and enzyme activity. The antigen-antibody complex becomes immobilised by having one component (either antigen or antibody) labelled with enzyme and bound to the immunosorbent support [14] [18] [19] . Therefore, the optimum enzyme conjugate used in developed VP1-CAV indirect ELISA test to get better specificity, is less economic loss and useful for diagnosis of CAV in big population of chicken flocks.
2. Materials and Methods
2.1. VP1-CAV Gene
The VP1-CAV gene of the chicken anaemia virus (CAV) was amplified from CAV DNA extracted from paraffin-embedded tissues.
2.2. Polymerase Chain Reaction (PCR) of the VP1-CAV Gene
A pair of primers based on the published nucleotide sequence of the VP1-CAV Malaysian isolate was prepared. The primer sequences are as follows: forward 5’GGGGTACCCCATGGCAAGACGAGCTCGCAGA3’ and reverse 5’TACATGACCCCCTGCGTCGGGCCTTAAGGC3’. These primers were used with KpnI and EcoRI, respectively, and were used to obtain a full-length VP1-CAV fragment (1.4 kb) from the VP1-CAV isolate. Additionally, VP1-CAV-CAV was sub-cloned into the pet47b plasmid with different sets of primers and was then transformed into E. coli DE21 for expression. The reaction was carried out in 50 ml volumes containing 1 ml of each primer (5 mM), ten ml of 10X reaction buffer (promega, USA), 2 ml of dNTPs (Promega, USA), and 2 ml of taq polymerase (Promega, USA), followed by 5 ml of MgCl2 (2.5 mM) and adjusted to 50 ml with distilled water.
The mixture was mixed thoroughly by vortexing and was then briefly spun down. The PCR cycle profile was as follows: a denaturing temperature of 94˚C for 5 min, then 5 cycles of 94˚C for 1 min followed by an annealing temperature of 74˚C for 2 min and an extension temperature of 72˚C for 2 min; t these steps were followed by 25 cycles of 94˚C for 1 min, 60˚C for 1 min and 72˚C for 1 min and 30 sec. Prior to gel electrophoresis, the PCR products were analysed by running 10 ml of the PCR reaction on a 1% agarose gel by electrophoresis. The remaining samples were stored at −20˚C for later use.
2.3. Cloning and Transformation of the VP1-CAV-CAV Gene
One ligation reaction was prepared. The prset-b vector (Invitrogen, usa) and the VP1-CAV-CAV insert was ligated in a reaction mixture containing 1 ml (80 ng/ml) of KpnIand EcoR1-digested vector, 3 ml (40 ng/ml) of VP1-CAV-CAV insert, 1 ml of 10X ligation buffer and 1 ml of T4 dna ligase (0.4 Weiss unit) (New England Biolabs, Inc.). The final volume of each reaction mixture was adjusted with distilled water to 10 ml, and the reactions were incubated at 16˚C overnight. Using the same procedure, a separate ligation reaction was prepared using Pet47b (Novagen, Germany).
These cloning mixtures were transformed into competent cells using the following heat shock method: competent bacteria cells were mixed with 2 ml of ligated plasmid containing the VP1-CAV gene and were placed on ice. The mixture was stirred gently and incubated on ice for 30 min and then incubated in a water bath at 42˚C for 90 sec. The incubated mixture was then placed immediately on ice. Lb broth (250 ml) was added to the mixture and incubated at 37˚C for 1 hour. Fifty and 100 ml of the mixture were spread on culture plates and were incubated overnight. On the following day, several colonies were picked from the plates and were inoculated into 25 ml LB broth. The colonies were then analysed by a double digestion of the recombinant plasmid with restriction enzymes (EcoRI and KpnI) for further confirmation of positive cloning. The insertion of the gene was further investigated by PCR amplification and double restriction enzyme digestion of the VP1-CAV gene.
2.4. Detection of Protein Expression in E. coli by SDS-PAGE and Western Blotting
Twenty ml of bacterial stock was placed into 25 ml LB medium, which was then incubated at 37˚C for 18 - 24 hours until the optical density (OD600) reached 0.6. LB medium (250 ml) was added to the culture and incubated for 5 hr to (OD600) 2.0. IPTG (0.1 mM) was added to induce VP1-CAV protein expression, and the mixture was incubated for another 5 hours. Bacterial cells were harvested by centrifugation at 12,000 rpm at 4˚C for 30 min. The cell pellet was resuspended in hepes, pH 7.6. To lyse the cells, the suspension was sonicated using a sonicator. The cell suspension was then washed with distilled water. The cell suspension was spun at 12,000 rpm for 30 min, and the purity and concentration of the supernatant containing soluble VP1-CAV protein was measured as 10 mg/ml. The sample was loaded into SDS polyacrylamide gel electrophoresis and run at 100 V for 1.5 hours. The gel was stained with Coomassie Blue (0.1% Coomassie Blue, 40% methanol and 10% glacial acetic acid) and then destained with buffer (10% methanol and 10% glacial acetic acid) overnight.
The protein gel was transferred to a PVDF membrane (Immobilon-P, Millipore Corp, USA) for western blot analysis using a semi-dry electro-blotting system (Bio-Rad Laboratories, USA) for 45 min at 15 V in transfer buffer (25 mM Tris-Base, 192 mM glycine, and 20% (w/v) methanol). The membrane was blocked with blocking buffer (1% bovine serum albumin in PBS) for one hour and washed in washing buffer (0.05% Tween 20 in PBS). The membrane was then incubated with an anti-VP1-CAV monoclonal antibody (Trop Bio) for two hours in blocking buffer at 37˚C with gentle mixing. The membrane was washed three times in washing buffer for 5 min and incubated with a conjugated antibody (goat anti-mouse IgG-AP (BioRad) for two hours at 37˚C. The conjugated antibody was prepared in blocking buffer containing 100 mM Tris and 150 mM NaCl. The membrane was washed, and the DAB substrate was then added to the membrane. After 5 min, the reaction was stopped by adding distilled water. The membrane was examined for the correctly sized protein band (50 kDa).
2.5. The Elisa Test
The indirect ELISA test was carried out as previously described by Todd [14] and was performed using ELISA plates (USA, biotechnology grad) and TMB substrate mixed with peroxidase solution B. The reproducibility of the ELISA was calculated from the optical density (OD650) readings of the control serum.
2.6. Serum Samples
The cav serum samples (n = 100) were obtained from 8 farms (chicken village). The sera were detected using a commercial ELISA kit (I-DEXX, Australia). The commercial ELISA kit employed antigens to the entire CAV protein. The serum samples were used to establish and evaluate the new indirect ELISA, which uses recombinant VP1 protein as an antigen. Serum samples were diluted 1:100 in washing buffer. Sera from SPF chickens were used as negative controls.
2.7. CAV ELISA Procedure for Antibody Detection
The CAV-coated antigen plate was prepared and used to detect the presence of CAV antibodies. Negative serum (100 ml) was added to plates A1 and A2, while 100 ml of positive serum was added to plates A3 and A4. Additionally, 100 ml of the diluted serum samples (1:50) was added into each well, and in duplicate plates, which were then incubated at 37˚C for 60 min. The plates were then washed three times with 350 ml of washing solution. Goat anti-chicken horseradish peroxidase conjugate (100 ml) was then added to each well, and the plate was incubated at 37˚C for 30 min and then washed with washing solution. A volume of 100 ml of the TMB substrate was added to each well, and the plate was incubated for 15 min at room temperature. The absorbance was then read by an ELISA reader (dynatech, MR7000, USA) with the absorbance value set at a wavelength of 650 nm. The evaluation of a commercial IDEXX ELISA was carried out using xChek software (IDEXX Laboratories). The presence or absence of antibody recognising CAV was determined by the sample to negative (S/N) ratio for each sample by the following:

2.8. Antigen Optimisation
Purified VP1 protein was diluted in 0.05 M coated buffer (Appendix D2) at dilutions 1:10, 1:50 and 1:100 (v/v). One hundred ml of each diluted antigen was coated onto the plates, and the plates were then covered with parafilm paper and incubated at 4˚C overnight. The coated plates were then washed three times with washing buffer (Appendix D3). The plates were tapped dry. The plates were then blocked with 100 ml of 2% bovine serum albumin (BSA) (prepared in washing buffer) overnight at 4˚C and were then washed three times with washing buffer.
2.9. Conjugate Optimisation
The goat anti-chicken IgG-HRP (KPL, USA) conjugate was used in the ELISA test. The conjugate was diluted in washing buffer at 1:1000, 1:2000, 1:4000, 1:8000 and 1:16,000. The optimum incubation reaction time was then determined.
2.10. Determination of an OD Level Threshold
A threshold should be determined to evaluate the performance of an ELISA. A total number of 23 negative sera were obtained from SPF chickens. The mean OD was calculated, and the standard deviation (SD) was then determined. The threshold for the OD level was determined as the following: threshold OD level = mean OD + 3SD.
2.11. Standard Curve of Indirect ELISA
Three sera were used as reference sera in serial dilutions to obtain the standard curve. The following serial dilutions were made: 1:200, 1:400, 1:800, 1:1600, 1:3200, 1:6400, 1:12,800, 1:25600, 1:51,200, 1:102,400, 1:409,600, 1:819,200, 1:1,638,400 and 1:3,276,800. The serum ODs of the three reference sera were 0.75, 0.812 and 0.852, respectively, as measured with the IDEXX commercial ELISA kit (IDEXX, Australia). The reference sera were diluted with washing buffer. The negative sera from SPF chickens were diluted at 1:500 and used as negative controls. The positive sera from the SPF chickens, with ODs measured by IDEXX, were diluted at 1:500 and used as positive controls. Two wells per plate were used for each positive and negative control. When the test assays were run, the absorbance value for the serially diluted individual reference sera were obtained and then converted to sample-to-positive (S/P) ratio values according to the following:

The standard curve relating optical density (OD650) to S/P was obtained. The curve regression estimation was calculated using the software of statistical programme for social science (spss, 1999, version 10.0) to generate the regression equation line from the indirect ELISA standard curve.
2.12. Indirect ELISA Procedure for Antibody Detection
Diluted VP1 protein of 1:100 (100 ml) was coated into each well, covered with parafilm paper and incubated at 4˚C overnight. The plate was then washed three times with washing buffer. The plate was tapped to dry and blocked with 100 ml of 2% BSA (prepared in washing buffer) and incubated at 37˚C for 2 h. The plate was washed again with washing buffer three times. The diluted serum samples of 1:100 were added to each well and incubated at 37˚C for 90 min. The plate was then washed with washing buffer three times. Goat anti-chicken IgG-HRP conjugate (100 ml) diluted at 1:8000 was then added to each well. The plate was then incubated at 37˚C for 1 hour and then washed three times with washing buffer.
The substrate tetra methybenzidine (TMB) was used for the enzyme reaction. The substrate and peroxidase solution B (KPL, USA) were mixed in equal volumes immediately prior to use. A total 100 ml volume of the substrate was added to each well and the plates were incubated for 10 min at room temperature. The reaction was then measured using an ELISA reader (dynatech, MR7000, USA) at a 650 nm absorbance.
The serum samples of other avian viruses, namely, Newcastle disease virus (NDV) and infectious bursal disease virus (ibdv) were used as controls to determine the specificity of the indirect ELISA.
The sensitivity and specificity was calculated using the formulas given by Anon [20] :

or


or

These two equations were used in Table 1 calculation for Sensitivity and Specificity
3. Results
3.1. VP1-CAV Gene Amplification
Primers for VP1-CAV gene amplification were derived from published complete sequences of a CAV isolate. Both primers were designed to amplify the full-length VP1-CAV gene. The first strand of the VP1-CAV gene was successfully synthesised using PCR amplification and optimised with a MgCl2 concentration of 2.5 mM. The PCR products were 1.4 kb, similar to the expected size of the published CAV isolate (Figure 1, lanes 1 and 2). After DNA purification, the concentration and the purity of the VP1-CAV gene were determined to be 40 ng/ml and 1.8 (ratio A260/A280), respectively. Figure 1 shows PCR products of the VP1-CAV gene that are 1.4 kb. The PCR amplification was performed at high fidelity conditions to reduce primer-dimer formation and non-specific product amplification. These results indicated that the primers and PCR conditions employed were

Table 1 . Calculations for sensitivity and specificity.
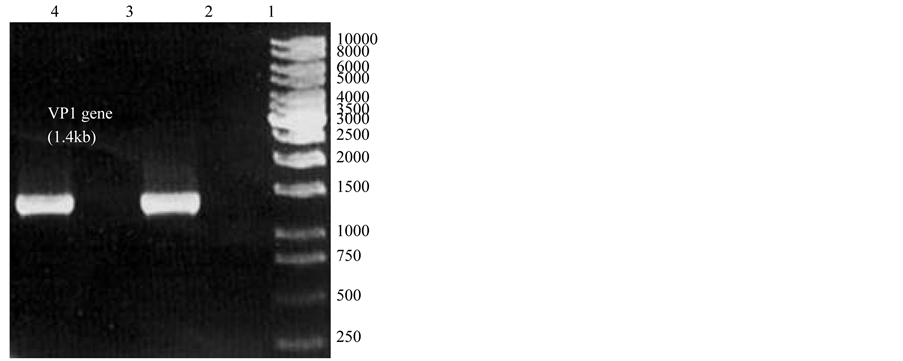
Figure 1. Lane M is a 1 kb marker. Lanes 1 and 2 consist of a 1.4 kb PCR product of the VP1 gene.
indeed specific.
3.2. Analysis of Cloning Product
Recombinant plasmid DNA was transformed into E. coli top 10 and E. coli BL12 DE3 cells by the heat shock method. The PCR product was inserted within the lacz gene, which resulted in the insertional inactivation of the gene. The transformants containing a putative VP1-CAV-CAV fragment could only produce white colour colonies. The next step was to clone VP1-CAV into the pet47b plasmid and transform the resulting plasmid into E, coli BL12 DE3 for expression. Transformants were screened by PCR with two primer sets (Figure 2). The VP1-CAV insert was successfully cloned into the (pRSET-B) vector (1 - 10 white colonies) as well as the (pet47b) vector, which yielded 11 - 15 white colonies that were positive for the VP1-CAV gene. The concentration and the purity of purified recombinant plasmid were determined to be 80 ng/ml and 1.8 ng/ml, respectively. The transformants contained the putative VP1-CAV gene, which was demonstrated by a digestion with EcoRI and KpnI and illustrated by agarose gel electrophoresis shown in Figure 3. The VP1-CAV DNA was 1.4 kb, the pRSET-B vector was 2.9 kb, and the pet47b vector was 5.2 kb. However, Figure 4 shown a possible 100% identical between the VP1-CAV DNA sequence and the UPM-CAV published sequence.
3.3. Expression of VP1-CAV Protein in E. coli
Figure 5(a) shows the protein from bacterial soluble extracts generated before and after induction of the recombinant VP1-CAV protein with IPTG. The VP1-CAV protein was successfully expressed in E. coli, which is stained with Coomassie Blue on SDS Page-gels. SDS-PAGE analysis of bacterially expressed VP1-CAV protein revealed the presence of a predominant band that migrated with an approximate molecular weight of 50 kDa in the induced lanes (Figure 5(b), lanes 2 and 3). In the lanes that held non-induced cells, the VP1-CAV protein was also produced, although at lower levels, in the absence of IPTG (Figure 5(b), lane 1).
The VP1-CAV protein can diffuse and be lost during treatment with acetic acid and methanol, which follows staining with Coomassie Blue. Therefore, expression of the VP1-CAV protein was further confirmed by western blot analysis using a PVDF membrane, as shown in Figure 5(b). The high specificity of anti-VP1-CAV monoclonal antibody not only recognises the native and recombinant protein with high fidelity but also the 50 kDa
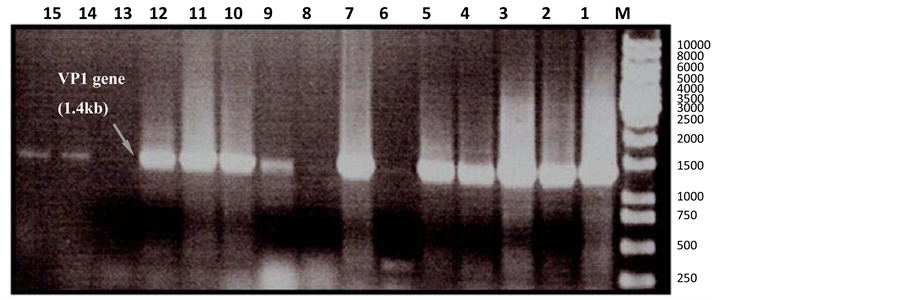
Figure 2. PCR screening on 15 white colonies. Eleven colonies were positive for the 1.4 kb product of the VP1 gene inserted into the pET47B plasmid. Lane M is a 1 kb marker. Lanes 1 - 11 are white colonies that are positive for the 1.4 kb VP1 gene product. Lanes 11 and 15 consist of white colonies that were cloned into the pet47b plasmid.
VP1-CAV fusion protein, regardless of whether the latter is purified or is from a crude extract. A protein with a molecular weight of 50 kDa was detected and found to correspond in size to the band detected by SDS-PAGE. No proteins were detected in the supernatant of non-induced cultures, which is shown in Figure 5(a), lane 1.
3.4. Optimisation of the Indirect ELISA
3.4.1. Antigen Optimisation
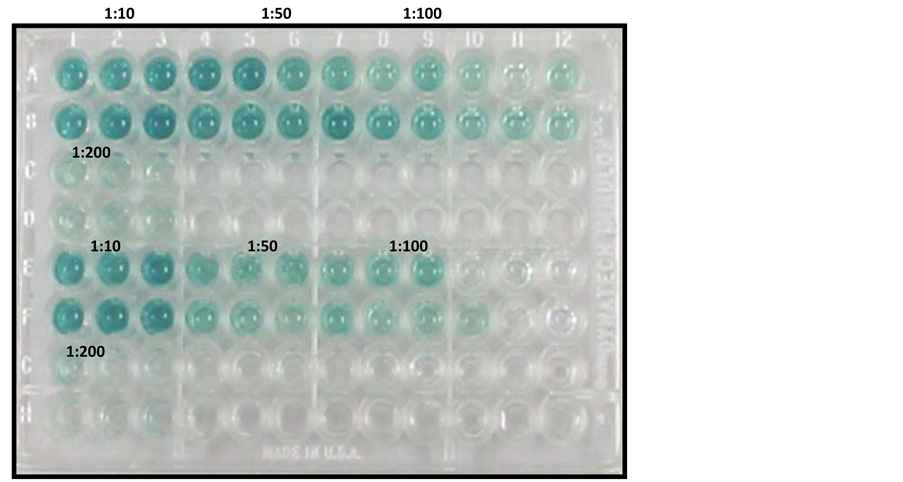
Antigen optimisation was carried out in Figure 6(a), in which Rows A-B contained CAV-positive serum against VP1 antigen and Rows E-F contained SPF CAV-negative serum against VP1 antigen. Figure 6(b) lists the optical densities, with an absorbance of 650 nm, of the samples and the antigen dilutions. The optimal antigen concentration for coating a plate was 1:100. Additionally, wells that were coated with antigen, specifically the negative control samples, exhibited the lowest absorbance values at a dilution of 1:100 compared to the 1:10 and 1:50 dilutions.
3.4.2. Conjugate Optimisation
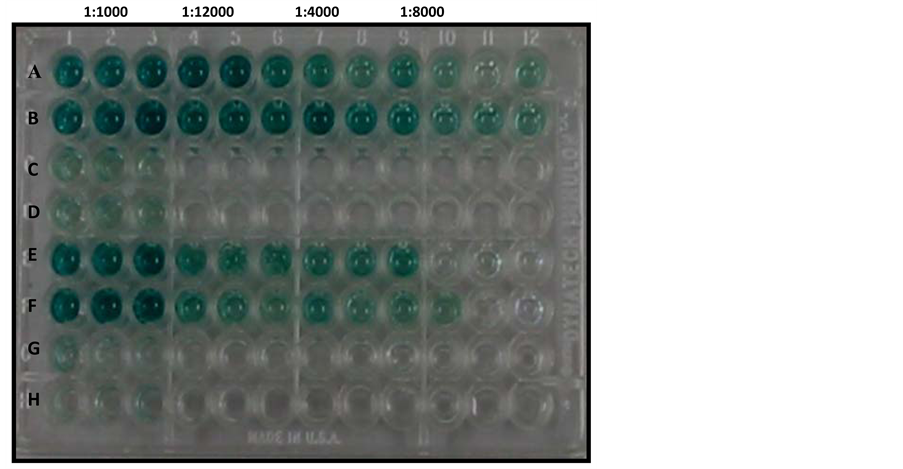
Conjugate optimisation was carried out in Figure 7(a), in which Rows A-B contained CAV-positive serum against VP1 antigen and Rows E-F contained SPF CAV-negative serum against VP1 antigen. Figure 7(b) shows the dependence of optical density on the dilution of the conjugate. Notably, the optimum conjugate concentration used in this indirect ELISA was 1:8000. The conjugate at 1:8000 and 1:16,000 dilutions gave similar results. Moreover, the conjugate at 1:1000 and 1:2000 dilutions resulted in too high of a resolution in the absorbance value.
3.5. Determination of Thresholds for OD Levels
A threshold od value of 0.1375 was established to determine whether the ELISA result was positive or negative by obtaining background values using laboratory chicken serum. The calculated mean OD value was 0.1375 with an SD value of ±0.0381. The threshold OD was 0.2520 (the mean OD plus three times the SD).
3.6. Standard Curve of the Indirect Elisa
The standard curve of the new indirect ELISA is shown in Figure 8. The formula and R2 of the standard curve were obtained using the inverse model to estimate the regression using the SPSS software. The curve formula was y = 0.075 Log10 (S/P) + 0.9158 with R2 = 0.9332 and was used with an S/P ratio between 0.2 and 7.
3.7. Statistical Analysis
Figure 9 shows mean optical densities, at an absorbance of 650 nm, for serum samples against S/P values. Statistical analysis was carried out using SPSS software. The t-test produced a t-value of 15.805 for the indirect
 (a)
(a)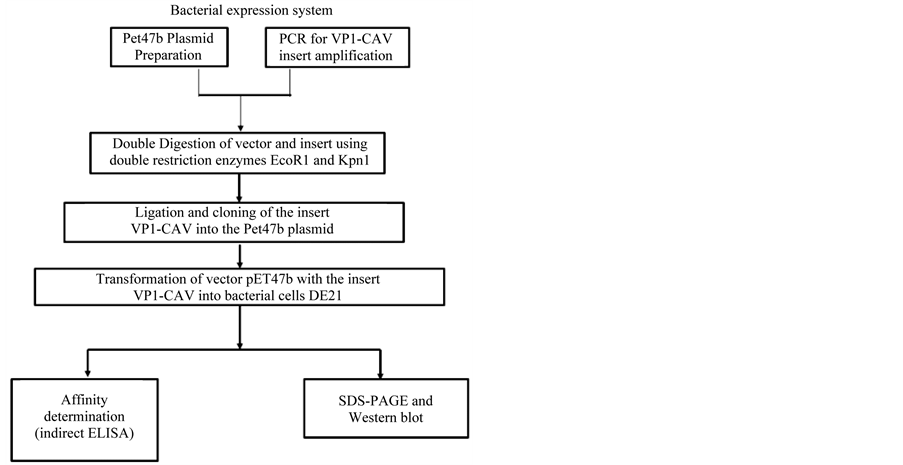 (b)
(b)
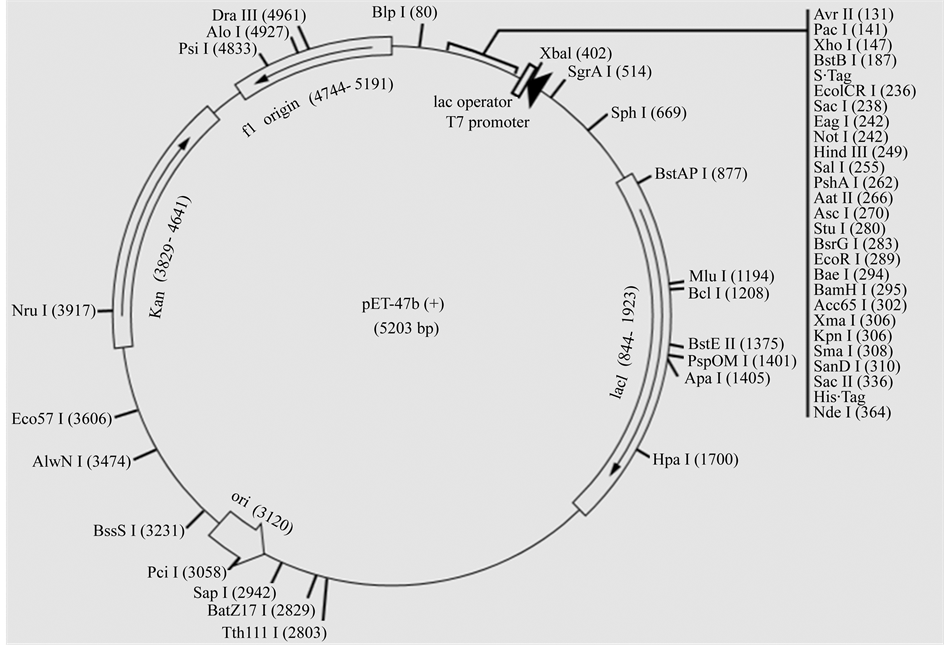
Figure 3. (a) pet47b plasmid contains C-terminal thrombin recognition site followed by an S∙Tag™ coding sequence. Unique restriction sites are shown on the circle map. Also, the sequence is numbered by the pBR322 convention, so the T7 expression region is reversed on the circle map. The cloning/expression region of the coding strand transcribed by T7 RNA polymerase is shown; (b) The flowchart shows the steps of cloning and expression of the VP1-CAV inserted into pET47b plasmid. VP1 gene inside the pET47b plasmid was transformed into DE21 bacterial competent cell. Gene positive cloning was detected using double digestion and PCR tests also protein expression inside the bacterial system was detected using SDS-PAGE and western blot.
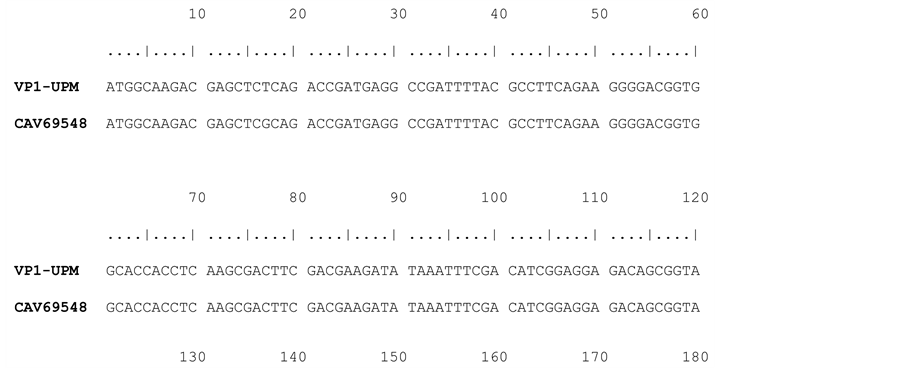
Figure 4. Nucleotide sequence alignment of the VP1 gene of CAV UPM isolate compared to published CAV69548 nucleotide sequence. The sequence of the VP1 gene (from nucleotide 1 - 263) from the published CAV69548 sequence is compared to the consensus sequence. A dot indicates the position where the sequence is identical to that of the consensus sequence. The identity was 100%.
 (a)
(a)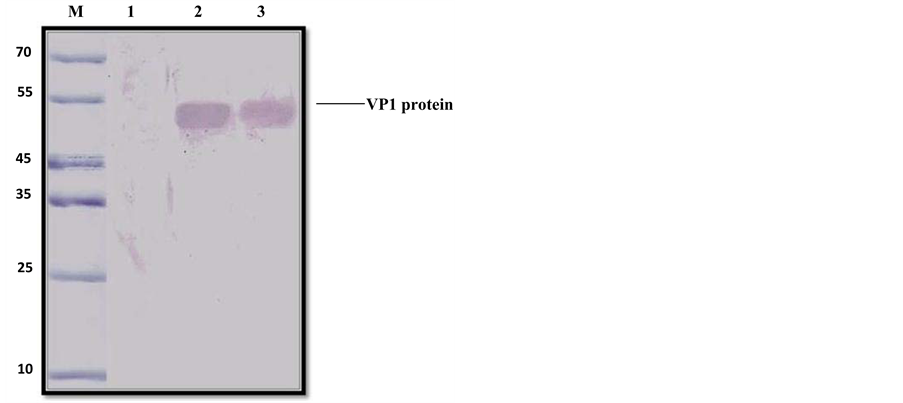 (b)
(b)
Figure 5. (a) Expression of the recombinant VP1 protein in E. coli on a Coomassie-stained 12.5% SDS-PAGE gel. Lane M has a 10 kDa protein ladder. Lane 1 consists of a whole cell extract from a culture of B12DE3 E. coli transformed with empty pET47b plasmid. Lane 2 consists of whole cell extract from an induced bacterial culture expressing VP1 protein. Lane 3 consists of 5 mg/ml of soluble protein extract from an induced bacterial culture expressing VP1 protein; (b) Detection of the VP1 protein band in E. coli using an anti-VP1 monoclonal antibody. SDS-PAGE and Western blot on 12.5% gradient gels. Lane M has molecular weight markers. Lane 1 consists of a plasmid control. Lanes 2 and 3 have 10 mg/ml of VP1 soluble protein fraction. An anti-VP1 monoclonal antibody (1:50) and a goat anti-mouse IgG-AP (BioRad) conjugate (1:1000) were used, and DAB was used as a substrate.
 (a)
(a) (b)
(b)
Figure 6. (a) Antigen optimisation. Rows A-B include (1:100) positive sera exposed to VP1 antigen. Rows E-F include SPF-negative sera (1:100) exposed to VP1 antigen; (b) Antigen dilutions (1:10, 1:50 and 1:100) reacted with positive and negative sera. The results were plotted against optical density values at an absorbance of 650 nm. Ratios shown refer to antigen dilutions.
 (a)
(a)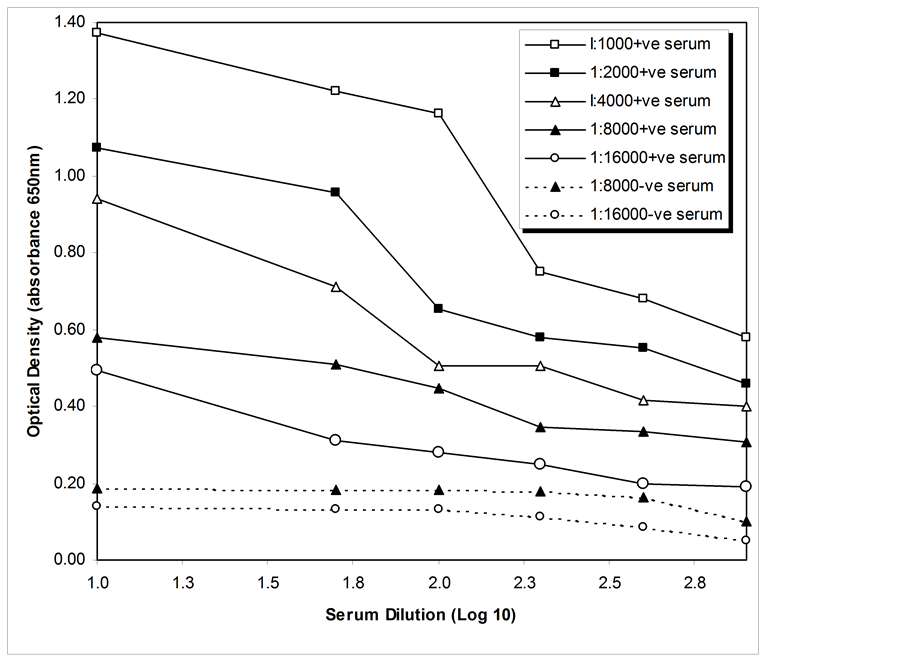 (b)
(b)
Figure 7. (a) Conjugate optimisation. Rows A-B consist of positive sera (1:100) exposed to VP1 antigen. Rows E-F consist of SPF-negative sera (1:100) exposed to VP1 antigen; (b) Conjugate dilutions (1:1000, 1:2000, 1:F000, 1:8000, and 1:16,000) reacted with positive (1:100) and negative sera (1:100) in an ELISA plate coated with antigen. The results were plotted against optical density values at an absorbance of 650 nm. Ratios shown refer to conjugate dilutions.
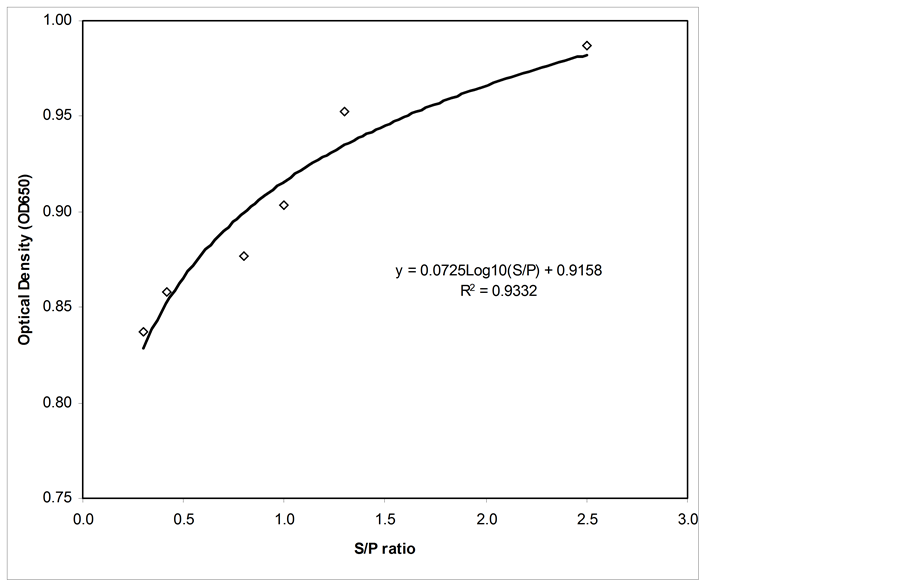
Figure 8. Standard curve for the indirect ELISA.
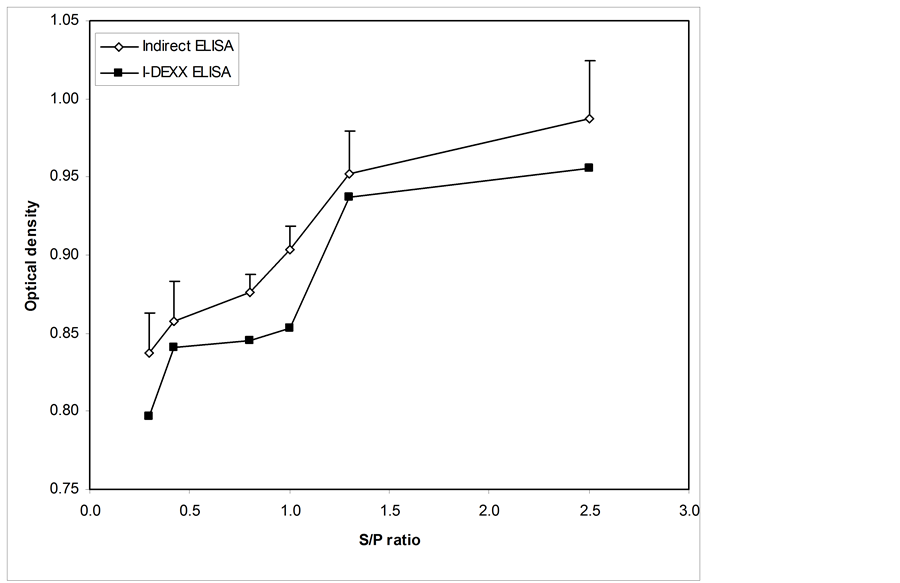
Figure 9. Comparison between the indirect ELISA and an IDEXX commercial Elisa, which used 4 serum samples for each mean. Mean optical density values were measured at an absorbance of 650 nm and were plotted against S/P values. The y-error bars represent the standard error (Mean OD ± SD) for the indirect ELISA.
ELISA, which revealed a significant difference between CAV-positive serum and CAV-negative serum (p-value of 0.001). For the second variable (i.e., a commercial ELISA), the t-test yielded a t-value of 5.063, which revealed a significant difference between CAV-positive serum and CAV-negative serum (p-value of 0.015). The intervention produces a statistically significant improvement in both variables with respect to the p-value (p-value < 0.05). Moreover, Figure 9 shows that the indirect elisa test had increasing optical densities and displayed high optical density values compared to the commercial Elisa kit. The mean optical densities of the serum samples of chickens with S/P values of 0.3, 0.5, 0.8 and 1.0 were clearly more significant than the S/P values of 1.5 and 2.8 that represented the commercial samples.
3.8. Sensitivity and Specificity
As described earlier, a total of 100 sera samples were tested to determine the sensitivity and specificity to CAV protein using a commercial ELISA and the new indirect ELISA as listed in Table 2 and Table 3 respectively. Moreover, NDV and IBDV sera samples showed negative reactions against VP1 protein, which indicates there was no cross reactivity with common chicken viruses, particularly IBDV or NDV.
4. Discussion
In previous years, several expression systems have been used to express VP1-CAV, including E. coli, baculovirus-insect cells, and plant cells [21] -[24] . However, expressing full-length VP1-CAV protein has been difficult because of the cytotoxicity of the N-terminal portion of the VP1-CAV gene [25] . Moreover, production of the recombinant full-length VP1-CAV protein has generally been unsuccessful because of a failure to express a span of amino acids at the N-terminus that is highly rich in arginine residues [22] [25] . These amino acids may be encoded by codons that are rarely used by E. coli. Most viral capsid proteins of circoviruses, such as the porcine circovirus and pigeon circovirus, which include the rare codons found in E. coli at the N-terminus, have been investigated in previous studies. Truncation of the N-terminus of capsid proteins has therefore become an alternative approach to produce these recombinant viral proteins [26] [27] . The expressed protein is toxic to the host that can lead to produce the heterogous product such as inclusions bodies. That would lead to incorrect folding and cell stress, which may be caused by heat shock, wrong nutrition or some other environmental causes. Those factors can cause reduction of soluble protein that produced by DE21 bacteria as shown in Figure 5(b). Also N-terminally truncated clone of VP1-CAV expressed in E. coli has been used, even though VP1-CAV protein has been successfully produced and purified to coat ELISA plates and several diagnostic methods have been developed and refined for detecting CAV infection. These methods include electron microscopy, nucleic acidbased analysis, and antigen-antibody assays [4] [5] [11] [14] .
In this study, the optimum antigen dilution was determined as 1:100, as shown in Figure 6(a). At this dilution, a high optical density value was recorded for positive sera, and acceptable low non-specific background values were recorded at this dilution with negative sera. This result is also supported by the fact that an antigen concentration that is too low reduces sensitivity, and too much antigen may result in high background levels with negative serum samples. Furthermore, over-coating the antigen onto the solid phase might also lead to non-specific
Table 2 . Sensitivity and specificity of ELISA by using recombinant VP1 protein as anchored antigen.
Table 3. Sensitivity and specificity of the commercial ELISA kit I-DEXX, Australia.
trapping of conjugate. Pallister et al., [22] cloned, sequenced and expressed the VP1 protein in a bacterial expression vector, pgex, to develop an ELISA for the detection of a serum antibody to CAV. Their results showed that the indirect ELISA performed better than the commercial elisa with the whole CAV antigen.
Because the sensitivity of the indirect ELISA is high, serum samples at low dilutions should not be used [25] . Therefore, in this study, test sera diluted to 1:100 were determined to be most appropriate for the indirect ELISA. The antibody dilution buffer used to dilute the test serum contained 2% BSA and 0.05% Tween 20 in PBS. The use of PBS-Tween for washing, diluting sera and making conjugate dilutions significantly reduced background reactions, including non-specific adsorption.
Acceptable background levels and improved specificity were attributed to the quality of the antibody sera that was used. To ensure good quality of the antibodies, freezing and thawing of the serum samples should be minimised to avoid antibody precipitation, which can cause a loss in antibody activity by steric interference of the antigen-combining site or by the generation of insoluble material that is lost during centrifugation or filtration [28] .
The goat anti-chicken IgG-HRP (KPL, USA) conjugate used in this study was of high quality because it could be used at a dilution of 1:16,000. This observation is clearly demonstrated in Figure 7(b). The optical densities of the conjugate at 1:16,000 and 1:8000 dilutions exhibited high resolutions in positive sera and had acceptably low non-specific background with negative sera. Doumit et al., [29] described attributed major problems that usually occur with ELISA to deficient labelling of conjugates, loss of enzymatic or immunological activity or an incorrect conjugate. Conjugate concentrations that are greater than optimum values can lead to false positive results, while concentrations that are less can produce false negatives [17] [20] .
Statistical analysis was carried out using SPSS software. The t-test produced a t-value of 15.805 for the indirect ELISA, with an associated single-sided (“tailed”) p-value of 0.001. For the second variable (i.e., a commercial ELISA), the t-test gave a t-value of 5.063 and a p-value of 0.015. The intervention produces statistically significant improvements in both variables with respect to the p-value (p-value < 0.05). Figure 8 shows that the mean optical densities for the chicken serum samples with S/P values of 0.3, 0.5, 0.8 and 1.0 were more significant than 1.5 and 2.8. A comparison of indirect and commercial ELISAs, as shown in Figure 9, demonstrates that the optical densities for the indirect elisa test continually increased and displayed high optical density values compared to the commercial Elisa kit.
The standard curve for the indirect ELISA was determined and is shown in Figure 7(b). From the standard curve, the equation for the regression line was determined. The coefficient of correlation for the indirect ELISA was R = 0.93. The newly developed indirect ELISA showed a significant correlation compared to the IDEXX ELISA, which indicates that the indirect ELISA could be used for the detection and measurement of CAV antibodies in chickens.
Traditional approaches to estimate test sensitivity and specificity depend on testing populations of both diseased and non-diseased animals [30] . The status of animals is determined by a standard test. For many diseases, the use of a standard is too expensive to allow large populations to be studied. In this study, the specificity and sensitivity of the indirect ELISA for the diagnosis of CAV were determined. The sensitivity of a commercial ELISA (100%) had a greater value than the indirect ELISA (93.3%), which was most likely because a whole CAV antigen was used in the commercial ELISA. On the other hand, the specificity of the indirect ELISA (100%) was greater than the commercial ELISA (95%). This result is attributed to the fact that the coated antigen in the indirect ELISA was VP1 antigen. Additionally, there was no cross reactivity with chicken viruses, particularly the IBDV and NDV viruses. This result, in turn, improved the specificity by removing cross-reactive antibodies.
These findings are in agreement with studies which have shown that the ELISA test failed to determine seroconversion, and an SN test proved to be the most effective assay to determine sero-conversion [31] [32] . The cause of the failure of the ELISA test in demonstrating sero-conversion following an experimental infection may be due to the use of class-specific (anti-IgG) conjugates, which are incapable of detecting class IgM antibodies. In this experiment, IgM class antibodies were detected 8 to 10 days post-infection (PI), while IgG class antibodies were detected 13 to 17 days PI [33] . Similar results were obtained in the experiment reported here, where IgG class antibodies were detected 10 to 16 days PI. IgM class antibodies were detected 10 days PI, and their levels peaked on the 16th day PI; subsequently, their levels fell sharply until the 38th day PI when they were undetectable.
In this paper, the indirect ELISA that utilised VP1 protein was successfully applied. The protein that was produced served as a crucial antigen for the detection of CAV polyclonal antibody in chickens. The results demonstrated that the indirect ELISA possesses a number of advantages: the indirect ELISA system is rapid, sensitive and specific for the detection of serum antibodies to CAV and it is well-suited for the serological diagnosis of CAV in SPF and commercial chicken flocks.
References
- Yuasa, N., Taniguchi, T., Imada, T. and Hihara, H. (1983) Distribution of Chicken Anemia Agent (CAA) and Detection of Neutralizing Antibody in Chicks Experimentally Inoculated with CAA. National Institute of Animal Health Quarterly (Tokyo), 23, 78-81.
- Engstrom, B.E. (1988) Blue Wing Disease of Chickens: Isolation of Avian Reovirus and Chicken Anaemia Agent. Avian Pathology, 17, 23-32. http://dx.doi.org/10.1080/03079458808436425
- Lurkert, P., Boer, D. and McNulty, M.S. (1995) Virus Taxonomy-Classification and Nomenclature of Viruses: Sixth Report of International Committee on Taxonomy of Viruses. Springer-Verlag, Vienna, 25, 166-168.
- McNulty, M.S., Curran, W.L., Todd, D. and Mackie, D.P. (1990) Chicken Anemia Agent: An Electron Microscopic Study. Avian Diseases, 34, 736-743. http://dx.doi.org/10.2307/1591272
- Todd, D., Mawhinney, K.A. and McNulty, M.S. (1990) Detection and Differentiation of Chicken Anemia Virus Isolates by Using the Polymerase Chain Reaction. Journal of Clinical Microbiology, 30, 1661-1666.
- Noteborn, M.H.M., de Boer, G.F., van Roozelaar, D.J., Karreman, C., Kranenburg, O., Vos, J.G., Jeurissen, S.H.M., Hoeben, R.C., Zantema, A., Koch, G., van Ormondt, H. and van der Eb, A.J. (1991) Characterization of Cloned Chicken Anemia Virus DNA that Contains All Elements for the Infectious Replication cycle. Journal of Virology, 65, 3131-3139.
- Cardona, C.J. and Schat, W.B. (2000) Distribution of Chicken Anaemia Virus in Reproductive Tissues of Specific Pathogen Free Chicken. Journal of General Virology, 45, 2067-2072.
- Koch, G., Van Roozelaar, D.J., Verschueren, C.A.J., Vander, E.A.J. and Neteborne, M.H.M. (1995) Immunogenic and Protective Properties of Chicken Anaemia Virus Protein Expressed by Baculovirus. Vaccine, 13, 763-770. http://dx.doi.org/10.1016/0264-410X(94)00034-K
- Novak, R. and Ragland, W.L. (2001) Competitive DNA Hybridization in Microtitre Plates for Chicken Anaemia Virus. Molecular and Cellular Probes, 15, 1-11. http://dx.doi.org/10.1006/mcpr.2000.0331
- Mcllory, S.G., McNulty, M.S., Bruce, D.W., Smyth, J.A., Goodall, E.A. and Alcorn, M.J. (1992) Economic Effect of Clinical Chicken Anaemia Agent Infection on Profitable Broiler Production. Avian Diseases, 36, 566-574.http://dx.doi.org/10.2307/1591750
- McNulty, M.S., Connor, T.J., McNeilly, F. and Spackman, D. (1989) Chicken Anemia Agent in the United States: Isolation of the Virus and Detection of Antibody in Broiler Breeder Flocks. Avian Diseases, 33, 691-694. http://dx.doi.org/10.2307/1591146
- Kurian, A.J. and Lackner, C. (2011) Effects of Blood Sample Mishandling on ELISA Results for Infectious Bronchitis Virus, Avian Encephalomyelitis Virus and Chicken Anaemia Virus. The Veterinary Journal, 192, 378-381.http://dx.doi.org/10.1016/j.tvjl.2011.08.028
- Brentano, L., Lazzarin, S., Bassi, S.S., Klein, T.A.P. and Schat, K.A. (2005) Detection of Chicken Anemia Virus in the Gonads and in the Progeny of Broiler Breeder Hens with High Neutralizing Antibody Titers. Veterinary Microbiology, 105, 65-72. http://dx.doi.org/10.1016/j.vetmic.2004.09.019
- Todd, D., Creelan, J.L. and McNulty, M.S. (1991) Dot Blot Hybridization Assay for Chicken Anemia Agent Using a Cloned DNA Probe. Journal of Clinical Microbiology, 29, 933-939.
- Lien, Y.-Y., Huang, C.-H., Sun, F.-C., Sheu, S.-C., Lu, T.-C., Lee, M.-S., Hsueh, S.-C., Chen, H.-J. and Lee, M.-S. (2012) Development and Characterization of a Potential Diagnostic Monoclonal Antibody against Capsid Protein VP1 of the Chicken Anemia Virus. Journal of Veterinary Science, 13, 73-79.http://dx.doi.org/10.4142/jvs.2012.13.1.73
- Sun, S.Q., Guo, H.C., Sun, D.H., Yin, S.H., Shang, Y.J., Cai, X.P. and Liu, X.T. (2010) Development and Validation of an ELISA Using a Protein Encoded by ORF2 Antigenic Domain of Porcine Circovirus Type 2. Virology Journal, 7, 274-280. http://dx.doi.org/10.1186/1743-422X-7-274
- Kessler, E.H., Matthes, E. and Schein, M.W. (2003) Detection of Antibodies in Sera of Weaned Pigs after Contact Infection with Sarcoptes scabiei var. suis and after Treatment with an Antiparasitic Agent by Three Different Indirect ELISAs. Veterinary Parasitology, 114, 63-73. http://dx.doi.org/10.1016/S0304-4017(03)00098-0
- Schlosser, U., Lackner, K.J., Scheckenhofer, C. and Schmitz, G. (1996) Calpastatin Autoantibodies: Detection, Epitope Mapping, and Development of a Specific Peptide ELISA. Clinical Chemistry, 42, 1250-1256.
- Köhler, G. and Milstein, C. (1976) Derivation of Specific Antibody Producing Tissue Culture and Tumor Lines by Cell Fusion. European Journal of Immunology, 6, 511-519. http://dx.doi.org/10.1002/eji.1830060713
- Anon (1998) Rules and Guidelines of the Australian Johne’s Disease Market Assurance Program for Cattle. Australian Animal Health Council Ltd and Veterinary Committee, 14, 54.
- Iwata, N., Fujino, M., Tuchiya, K., Iwata, A., Otaki, Y. and Ueda, S. (1998) Development of an Enzyme-Linked Immunosorbent Assay Using Recombinant Chicken Anemia Virus Proteins Expressed in a Baculovirus Vector System. Journal of Veterinary Medical Science, 60, 175-180. http://dx.doi.org/10.1292/jvms.60.175
- Pallister, J., Fahey, K.J. and Sheppard, M. (1994) Cloning and Sequencing of the Chicken Anaemia Virus (CAV) ORF-3 Gene, and the Development of an ELISA for the Detection of Serum Antibody to CAV. Veterinary Microbiology, 39, 167-178. http://dx.doi.org/10.1016/0378-1135(94)90097-3
- Huang, C.H., Lai G.H., Lee M.S., Lin, W.H., Lien, Y.Y., Hsueh, S.C., Kao, J.Y., Chang, W.T., Lu, T.C., Lin, W.N., Chen, H.J. and Lee, M.S. (2010) Development and Evaluation of a Loop-Mediated Isothermal Amplification Assay for Rapid Detection of Chicken Anaemia Virus. Journal of Applied Microbiology, 108, 917-924. http://dx.doi.org/10.1111/j.1365-2672.2009.04481.x
- Lee, M.S., Lien, Y.Y., Feng, S.H., Huang, R.L., Tsai, M.C., Chang, W.T. and Chen, H.J. (2009) Production of Chicken Anemia Virus (CAV) VP1 and VP2 Protein Expressed by Recombinant Escherichia coli. Process Biochemistry, 44, 390-395. http://dx.doi.org/10.1016/j.procbio.2008.11.016
- Rourke, D., Michalski, W.P. and Bagust, T.J. (1994) Chicken Anaemia Virus Antibody ELISA Reactions Practical Experiences and Problems in High-Security SPF Flocks. Avian Diseases, 12, 456-464.
- Daum, I., Finsterbusch, T., Härtle, S., Göbel, T.W., Mankertz, A., Korbel, R. and Grund, C. (2009) Cloning and Expression of a Truncated Pigeon Circovirus Capsid Protein Suitable for Antibody Detection in Infected Pigeons. Avian Pathology, 38, 135-141. http://dx.doi.org/10.1080/03079450902737797
- Lou, Z., Li, X., Li, Z., Yin, X., Li, B., Lan, X., Yang, B., Zhang, Y. and Liu, J. (2011) Expression and Antigenicity Characterization for Truncated Capsid Protein of Porcine Circovirus Type 2. Canadian Journal of Veterinary Research, 75, 61-64.
- Shapira, R., Paster, N., Menasherov, M., Eyal, O., Mett, A., Meiron, T., Kuttin, E. and Salomon, R. (1997) Development of Polyclonal Antibodies for Detection of Aflatoxigenic Molds Involving Culture Filtrate and Chimeric Proteins Expressed in Escherichia Coli. Applied and Environmental Microbiology, 15, 990-995.
- Doumit, S.M., Calpastatin, M.E., Lonergan, J.R., Killefer, A.J. and Ohmaraie, M. (1996) Development of an Enzyme-Linked Immunosorbent Assay (ELISA) for Quantification of Skeletal Muscle. Journal of Animal Science, 74, 2679-2686.
- Gillette, K.G. (1983) Enzyme-Linked Immunosorbent Assay Used to Monitor Serum Antibodies to Bovine Respiratory Syncytial Virus: Comparison with Complement Fixation and Neutralization Tests. American Journal of Veterinary Research, 44, 2251-2255.
- Kovarcik, K. (2001) The Development and Application of an Indirect ELISA Test for the Detection of Antibodies to Bovine Respiratory Syncytial Virus in Blood Serum. Veterinary Medicine Czech, 46, 29-34.
- Kimman, T.G., Westebrink, F., Schreuder, B.E.C. and Straver, P.J. (1987) Local and Systematic Antibody Response to Bovine Respiratory Syncytial Virus Infection and Reinfection in Calves with and without Maternal Antibodies. Journal of Clinical Microbiology, 2, 1097-1106.
- Florent, G. and Wiseman, A. (1990) An IgM specific ELISA for the Serodiagnostics of Viral Bovine Infections. Comparative Immunology, Microbiology and Infectious Diseases, 13, 203-208. http://dx.doi.org/10.1016/0147-9571(90)90089-C
List of Abbreviations
CAV: Chicken anaemia virus ELISA: Enzyme-linked immunosorbent assay HRP: Horseradish peroxidase IFA: Immunofluorescent test IBDV: Infectious bursal disease virus ndv: Newcastle disease virus ORF: Open reading frame S/P: Sample-to-positive ratio