Open Journal of Molecular and Integrative Physiology
Vol. 3 No. 2 (2013) , Article ID: 31304 , 9 pages DOI:10.4236/ojmip.2013.32011
Cardiac index (CI) versus cardio ankle vascular index (CAVI) at different degrees of head-up tilt (HUT) in healthy subjects
![]()
1Department of Non-Invasive Cardiovascular Studies, Najaf Cardiac Centre, AlSadr-Teaching Hospital, Kufa College of Medicine, Najaf, Iraq
2Department of Clinical Physiology, College of Medicine, University of Kufa, Najaf, Iraq
Email: drzwain@zwayn.com
Copyright © 2013 Akeel A. M. H. Zwain et al. This is an open access article distributed under the Creative Commons Attribution License, which permits unrestricted use, distribution, and reproduction in any medium, provided the original work is properly cited.
Received 30 March 2013; revised 30 April 2013; accepted 7 May 2013
Keywords: Cardiac Index; Cardio-Ankle Vascular Index; Atherosclerosis; Head-Up Tilt
ABSTRACT
The cardio-ankle vascular index (CAVI) is a new index of arterial stiffness that can be measured with a VaSera VS-1000 device. An association between certain arterial stiffness indices and cardiac function has been found but has not yet been validated. The aim of this study was to establish whether any significant relationship exists between cardiac index (CI) and CAVI. Twenty healthy male volunteers with a mean age of 30 ± 5 years and a mean BMI of 23.1 ± 1.1 kg/m² participated in the study. CO was estimated using a Doppler technique, and CAVI was measured with a VaSeraVS-1000 device. A motorised tilting table was used to achieve head-up tilt (HUT) angles of 0˚, 30˚ and 60˚, to modify the peripheral sympathetic outflow. We found that there was a significant inverse correlation between CI and the degree of head-up tilt, ( for 0˚ and 30˚;
  for 0˚ and 60˚, p < 0.001 for both;
  for 30˚ and 60˚,
 ). CAVI showed a significant positive correlation relative with the degree of HUT, (
 for 0˚ and 30˚;
  for 0˚ and 60˚;
  for 30˚ and 60˚,
  for all). A significant negative correlation was found between CI and CAVI r = −0.47, p < 0.05. Additionally, a significant p < 0.001 increase in PVR values was observed for increasing HUT values. In conclusion: An inverse relationship between CI and CAVI was shown; a decrease in cardiac output is associated with an increase in CAVI values at different degrees of HUT. This association provides further insight into the postural link between cardiac output and arterial compliance.
1. INTRODUCTION
The cardiac index (CI) is a normalized metric of cardiac output (CO) and is based on a person’s body size (l/min/ m2); CI increases proportionally with an individual’s body surface area (BSA), which is commonly measured with the Mosteller formula [1]:
 .
.
CO can be calculated from stroke volume (SV) and heart rate (HR) based on the following equation [2]: . CO can be measured non-invasively via the echo-Doppler technique [3]:

(where D is the aortic diameter and VTI is the velocitytime integral).
CI is considered the most important indicator of the cardiovascular system function. The normal range of CI at rest is 2.6 - 4.2 l/min/m [2-4], and an age-related variation in indexed cardiac output has been well established [5,6]. Unlike the left ventricular ejection fraction (LVEF), CI offers a more precise estimate of the pumping action of the heart: because it does not change with increased heart rate or concomitant decreases in stroke volume, when pacing a normal-size heart [7]. Additionally, the maintenance of CI by the IV administration of Ringer’s solution has been implicated in improved postoperative patient outcomes and decreased in-hospital deaths of patients undergoing major surgery [8].
1.1. CI and Arterial Stiffness
Reports linking CI values with overt or subtle changes in arterial compliance are scarce. Studies have related indices of cardiac function, including CI, to neuropsychological impairment [9,10], dementia and cognitive dysfunction among patients with severe cardiomyopathies [11]. In a report on 1504 Framingham Offspring Cohort participants (age, 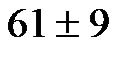 years) who were free of clinical stroke, transient ischemic attack, or dementia, in the absence of end-stage heart disease, subclinical cardiac dysfunction was shown to affect brain aging. Jefferson et al. [12] studied the association between cardiac dysfunction and neuroanatomical/neuropsychological changes in ageing adults with or without prevalent cardiovascular disease. They found that cardiac index was positively correlated with total brain volume; and that CI values <2.54 were associated with significantly lower brain volumes. These authors hypothesized that an adequate CI is essential for stable brain health and that subtle reductions in cardiac function may be associated with accelerated brain ageing.
Interestingly, both obese and non-obese individuals were shown to have similar cardiac indexes, despite an increased LV-EF in the obese individuals [13]. Furthermore, increases in body weight (a key determinant of CI) were not associated with the extent of coronary atherosclerosis and caused no increased risk of total mortality [14,15].
1.2. Arterial Stiffness
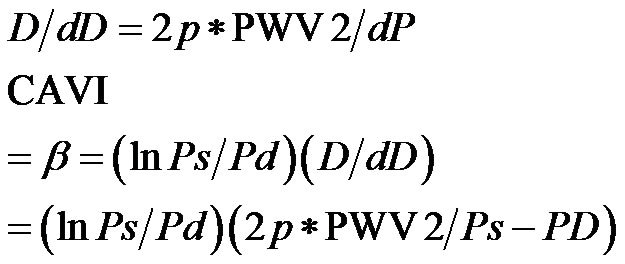
In a population-based study, arterial stiffness was shown to be strongly associated with atherosclerosis at various sites in the vascular tree [16]. Arterial stiffness is predicttive of cardiovascular disease (CVD) and mortality from lifestyle-related diseases [17-19], and it has been increasingly observed in cases of other atherosclerotic disorders, including metabolic syndrome [20-22]. The methods used to estimate arterial stiffness include cardiac ultrasonography and pulsewave velocity (PWV) [23,24]. The cardio-ankle vascular index (CAVI), a new index of arterial stiffness, developed in Japan, measures pulse wave velocity (PWV) and blood pressure (BP). CAVI is adjusted for BP, based on a stiffness parameter β and is reported to be unaffected by BP [25,26]. Therefore, CAVI may be superior to the commonly used brachialankle PWV (baPWV), which is highly dependent on BP and therefore difficult to implement clinically [19,25]. However, the clinical usefulness of CAVI has not yet been fully clarified [26].
Hayashi et al. [27] proposed the stiffness parameter β . Kawasaki et al. [28] defined β as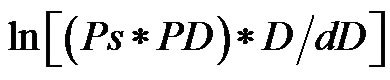 , where Ps is systolic pressure, Pd is diastolic pressure, D is arterial diameter, and dD is change in diameter. The relationship between PWV and the reciprocal of the radius percentage change is calculated as follows.

(where p is blood density, and dP is pulse pressure)
 .
.
PWV is obtained by dividing the vascular length (L) by the time (T) required for a pulse wave to propagate from aortic valve to the ankle. L is obtained by measuring the length between the aortic valve and the ankle [29].
1.3. Aim
The aim of this work was to establish whether a significant relationship exists between CI and CAVI. Furthermore, we aimed to propose a new index, CI/CAVI, as a haemodynemic parameter.
2. MATERIAL AND METHODS
2.1. Subjects and Tilting Table Examination
We created varied levels of vasoconstriction by baroreceptor-sympathetic outflow activation using, graded degrees of HUT [30,31]. This technique caused changes in the arteriolar vascular system stiffness, and simulated a clinical condition of varying degrees of atherosclerosis in the arteries.
Twenty healthy non-smoking male subjects, with, a mean age of 30 ± 5 years were recruited for the study. All the subjects signed an informed consent upon their arrival at the study venue. All were in stable clinical condition, none was on medication, and they all had normal blood pressure, CVS, renal, and hepatic functions, as well as, blood sugar, serum cholesterol and uric acid levels. Prior to beginning the test, all the study subjects were reassured about its safety and non-invasive nature to minimize any anxiety.
The subjects were examined in the supine position on tilt a table, in a quiet, temperature-controlled room. The measurements were performed after at least 10-min of supine rest to achieve a steady state, in which the heart rate changed less than 3 beats/min from one minute to the next [31]. The time needed to achieve this steady state, ranged from 7 - 10 min. A pulse oximeter was fixed to the right index finger to monitor changes in arterial pulse to assess the attainment of a steady state.
2.2. CAVI Estimation
CAVI was measured by a VaSera VS-1000 (Fukuda Denshi, Tokyo, Japan) using soft-ware version 08-01, which assesses the state of the vessels with high accuracy. The reliability of the VaSera VS-1000 in estimating arterial stiffness has been previously validated [32]. This device utilises blood pressure cuffs with sensors on all four limbs to generate plethysmographs, (Figures 1 and 2). The cuffs were placed on the upper arms, the right knee, and both ankles; ECG leads were placed on the wrists; and a phonocardiogram (PCG) transducer was placed at the right sternal border in the intercostal space. The results were calculated separately for the left and the right sides of the body. The final results were obtained by calculating the mean of six consecutive measurements. The parameter of stiffness β, was obtained by the following equation: 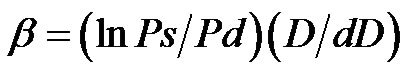 [28], where lnPs/Pd is natural logarithm of the systolic-diastolic pressure ratio, and D/dD is the ratio of wall extensibility.
2.3. Cardiac Output Estimation
Cardiac output was calculated using the Sonos 7500 echo-Doppler equipment (M2424A Ultrasound system, Andover Masssachuses 01810, Philips, made in USA) with a 2.5 MHz phased array cardiac probe, a PW Doppler and a built-in ECG. To obtain the left ventricular outflow tract (LVOT) VTI, the Doppler sample volume was placed at the middle of the LVOT, just below the aortic cusp [3], utilizing an optimal 4- or 5- chamber view. The highest VTI value was used for the CO calculation, as depicted in Figure 3. To obtain the LV out flow diameter (D), a parasternal long axis view was utilized [33], as shown in Figure 4. The stroke volume was cal-
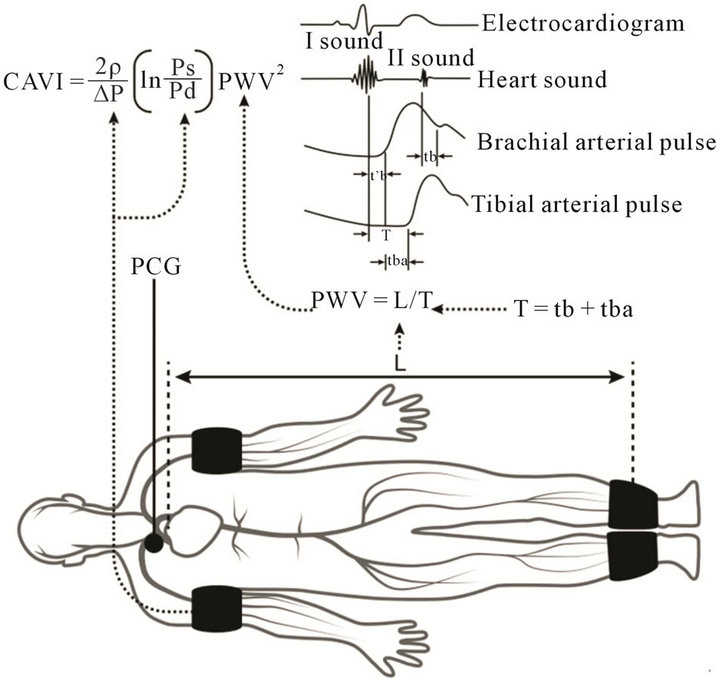
Figure 1. Adapted from Shirai et al. [29], with some modifications. Blood pressure cuffs were placed on the upper arms and both ankles, ECG leads were placed on the wrists, and a phonocardiogram (PCG) transducer was placed at the right sternal border in the intercostal space.
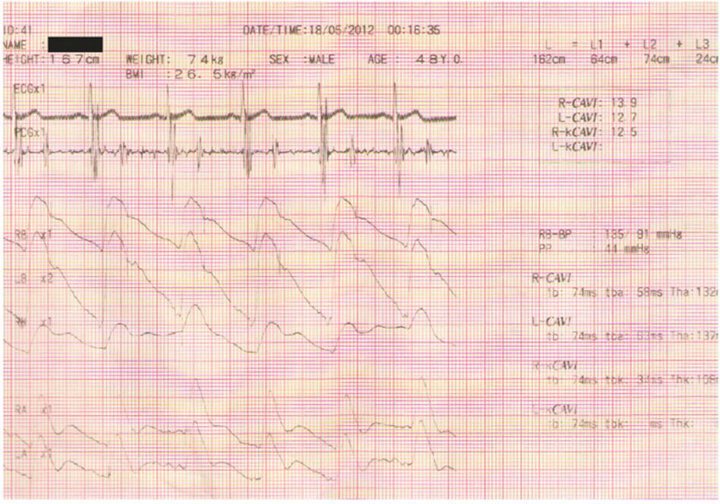
Figure 2. Part of the basic display of the Vasera VS1000, ECG, PCG waveforms, along with pulse waves, are displayed. The pulse waves, induced through cuffs applied to the limbs, correspond to the following locations: RB, right brachial; LB, left brachial; RK, right knee; RA, right ankle; and LA, left ankle. The results of the CAVI estimation are displayed on the right side of the record.
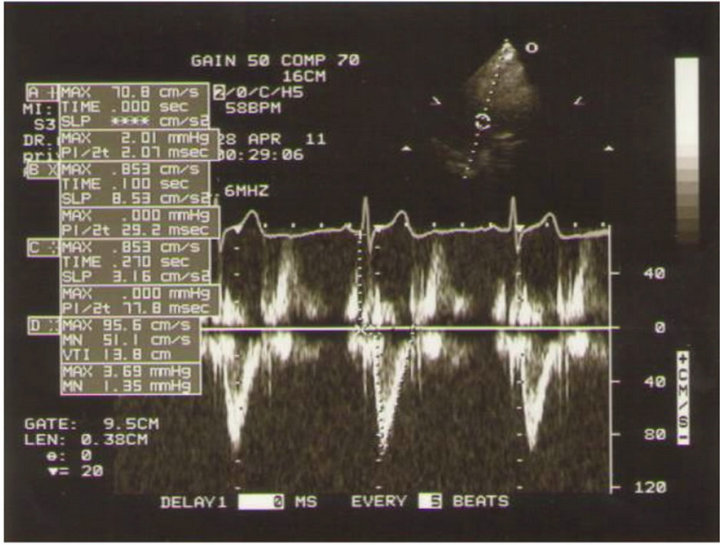
Figure 3. Doppler wave form with the sample volume placed in the LVOT where the VTI can be measured.
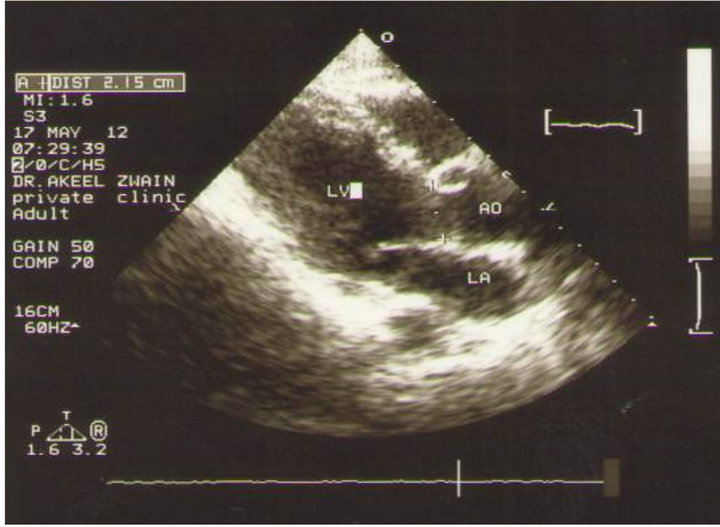
Figure 4. The left parasternal long axis view for the measurement of aortic diameter.
culated using the following equation [3]:
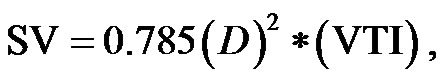
where D is the aortic diameter, and VTI is the velocity time integral. CO was calculated according the equation: . CI was obtained by dividing CO by the body surface area.
The above-cited measurements of VTI using Doppler echocardiography, and CAVI, using the VaSeraVS-1000 were performed after the subject achieved a steady state, with an HUT of 0˚ (the pre-test supine position), 30˚ or 60˚ (Figure 5). These indices were evaluated at incremental degrees of upright tilt.
2.4. Statistical Analysis
The statistical analysis was performed using SPSS, version 12. All values were expressed as the means ± SD. The haemodynamic parameters (CI, CAVI and CI/CAVI) were compared at different degrees of HUT, using Student’s paired t-test, and Pearson’s correlation (r). A p value <0.05 was considered statistically significant.
3. RESULTS
The results were consistent for all twenty participants.
3.1. CI
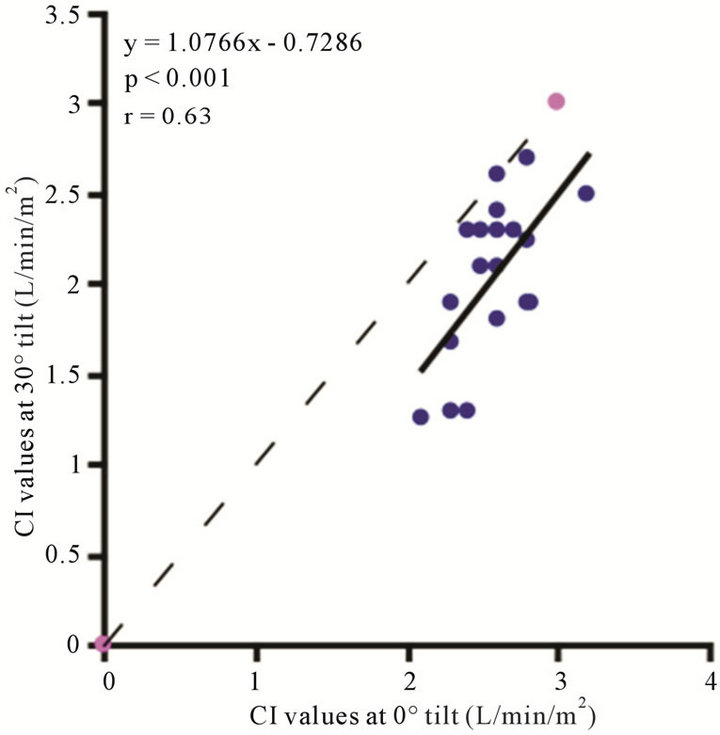
The baseline control value of CI (lying flat in the supine position) was 2.58 ± 0.25 (range, 2.55 - 3.20) l/min/m2. The CI values at 30˚ and 60˚ were 2.06 ± 0.42 (range, 1.30 - 2.90) and 1.85 ± 0.45 (range, 1.20 - 2.70) l/min/ m2, respectively. There were significant correlations between the CI values at 0˚ of HUT and those at 30˚ and 60˚ (0˚ and 30˚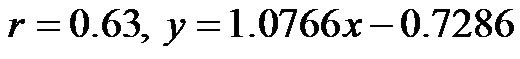 ; 0˚ and 60˚:
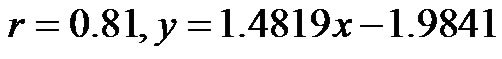 ). A significant correlation existed between CI values at 30˚ and 60˚
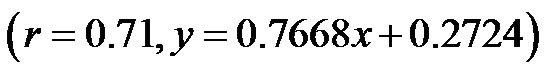 . The CI values at 30˚ and 60˚ of HUT were significantly lower than that at 0˚
 . The CI at 60˚ of HUT was significantly lower than that at 30˚
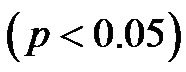 . As demonstrated in Figure 6, there were consistent and significant
  decreases in the CI values with increase ing increments of HUT.
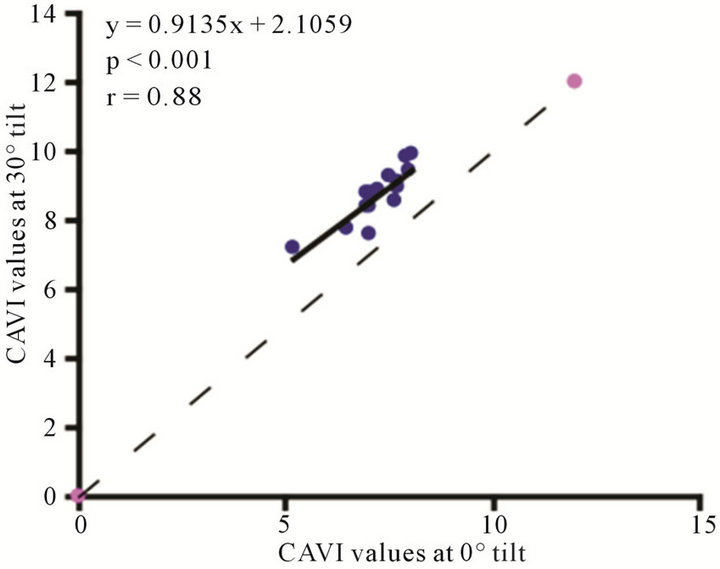
3.2. CAVI
The baseline control value of CAVI was 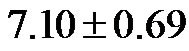 (range, 5.60 - 8.05). The CAVI values at 30˚ and 60˚ were 8.60 ± 0.73 (range, 7.10 - 9.90) and 9.20 ± 0.98 (range, 7.75 - 10.45), respectively. As shown in Figure 7, there was a significant
  and consistent increase in the CAVI values with increasing HUT, (at 0˚ and 30˚:
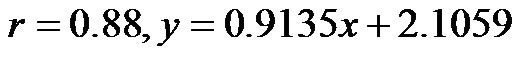 ; at 0˚ and 60˚:
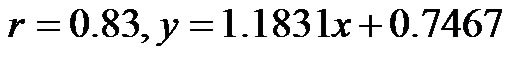 ). Likewise, a significant correlation was observed between the CAVI values at 30˚ and 60˚
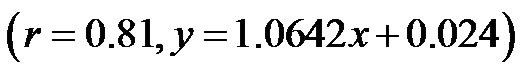 . The correlation between CI and CAVI at different degrees of tilt was studied. The results revealed a negative correlation between CI and CAVI
 , as depicted in Figure 8.
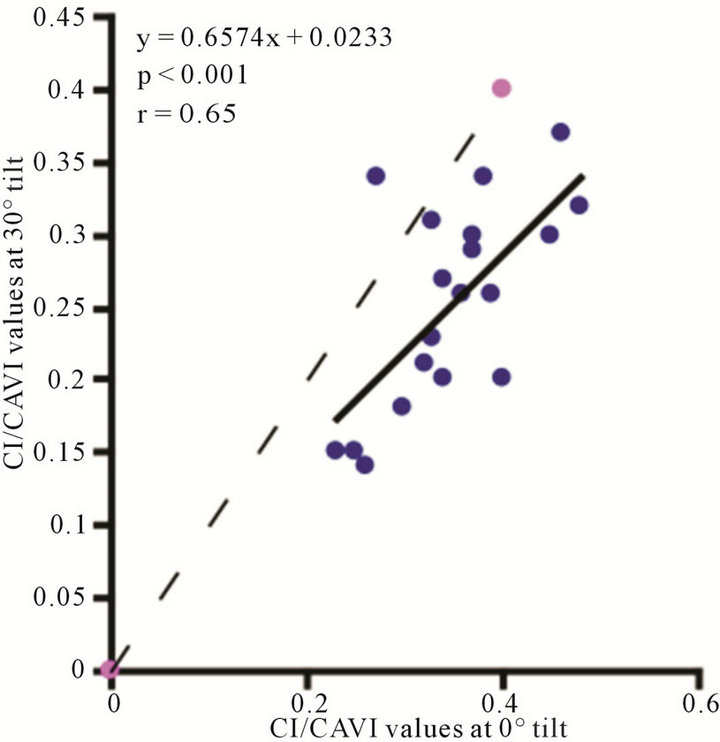
3.3. CI/CAVI (CI Value Divided by CAVI Value)
The value of CI/CAVI at 0˚ of HUT was 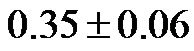 (range, 0.23 - 0.48). The values at 30˚ and 60˚ were 0.25 ± 0.06 (range, 0.14 - 0.37) and 0.19 ± 0.05 (range, 0.12 - 0.30), respectively. There were significant correlations between the CI/CAVI value at 0˚ of HUT and those at 30˚ and 60˚ (
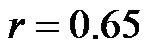 for 0˚ and 30˚,
 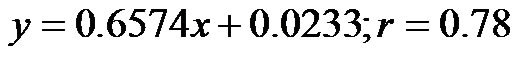 , for 0˚ and 60˚,
 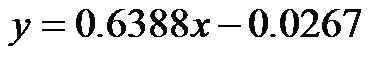 ). In addition, a significant correlation existed between CI/CAVI values at 30˚ and 60˚ (
 , for 30˚ and 60˚,
 ). As demonstrated in Figure 9, the CI/CAVI at 30˚ and 60˚ were significantly lower than that at 0˚
 , and the CI/CAVI at 60˚ was significantly lower than that at 30˚
 .
.
3.4. Peripheral Vascular Resistance (PVR)
There was a significant increase in the PVR (mean arterial blood pressure value divided by cardiac output value) values with increases in HUT. The baseline control value was 25.33 ± 5.01 mmHg·min−1/dl (range 14.4 - 33.6 mmHg·min−1/dl). The PVR values at 30˚ and
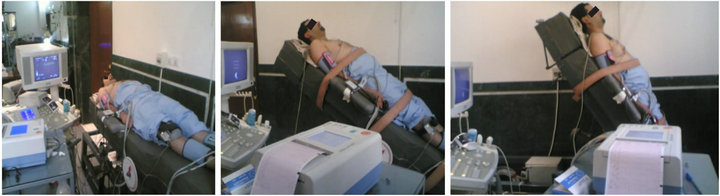
Figure 5. A subject in different degrees of HUT: (a) 0˚; (b) 30˚; (c) 60˚.
(a) (b) (c)
 (a)
(a)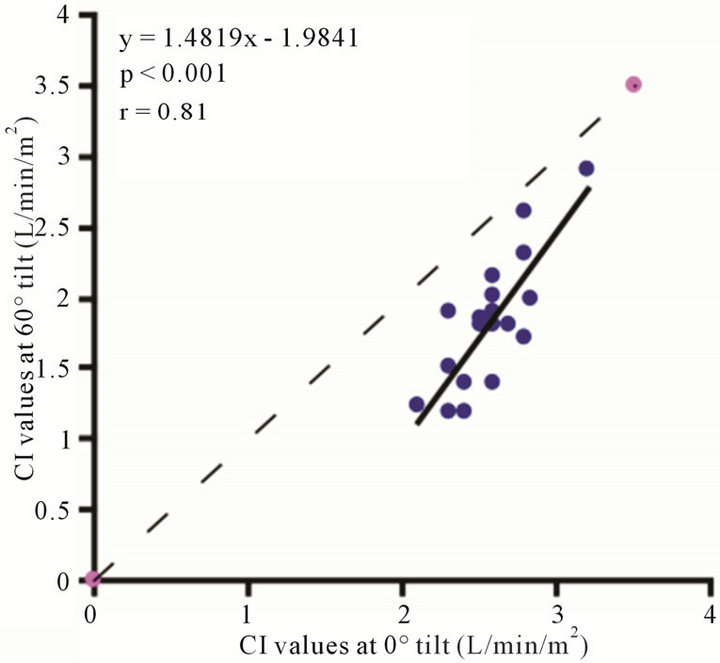 (b)
(b) (c)
(c)
Figure 6. Scatter diagrams illustrating significant correlation between CI values. (a) 0˚ and 30˚; (b) 0˚ and 60˚; and (c) 30˚ and 60˚. Dark lines represent lines of regression, dotted lines: represent lines of identity.
 (a)
(a)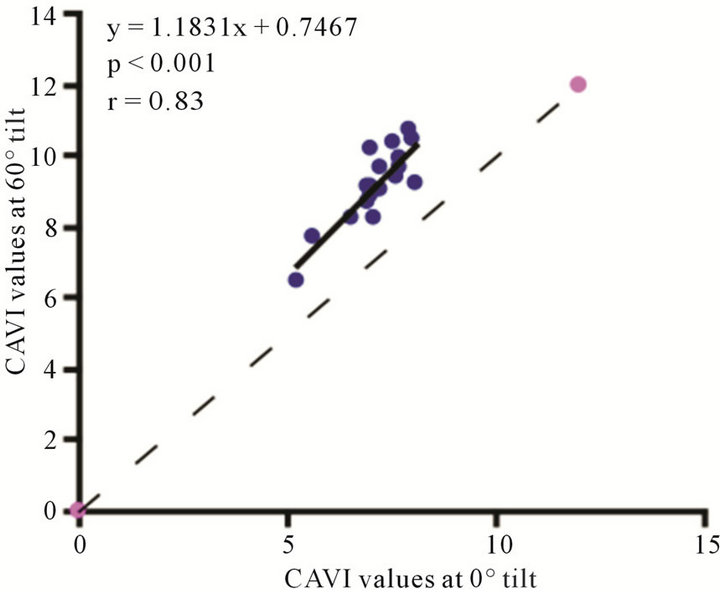 (b)
(b)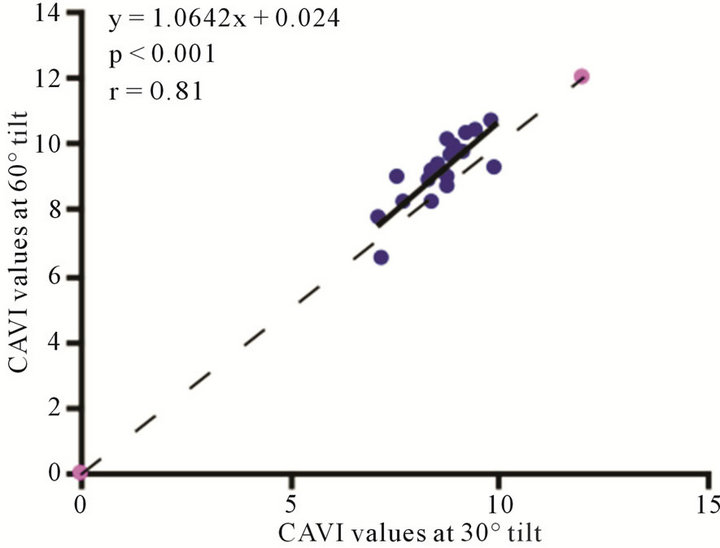 (c)
(c)
Figure 7. Scatter diagrams showing significant correlations between CAVI values at (a) 0˚ and 30˚; (b) 0˚ and 60˚; and (c) 30˚ and 60˚ of HUT. Dark lines represent lines of regression, and dotted lines: represent lines of identity.
60˚ were  mmHg·min−1/dl (range 18.0 - 37.63 mmHg·min−1/dl) and
  mmHg·min−1/dl (range 20.01 - 47.57 mmHg·min−1/dl), respectively.
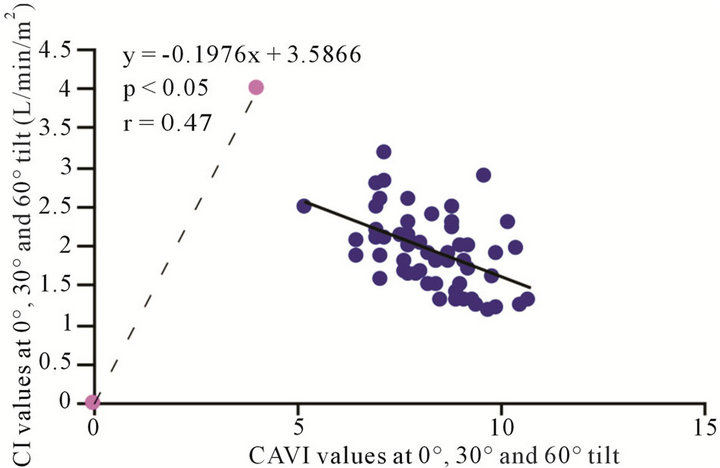
Figure 8. Scatter diagram showing significant negative correlations between CAVI and CI at 0˚, 30˚ and 60˚ of HUT.
4. DISCUSSION
The cardiovascular response to a postural change from the supine to the upright position has been extensively studied. This response reflects both mechanical changes due to the effects of gravity on the circulatory system and the changes caused by the resulting nervous reflex responses [34]. We found CI values to be significantly lower at 30˚and 60˚ of HUT than at 0˚, primarily because of blood pooling in the lower extremities due to gravity [34,35]. This substantial decrease in the central filling pressure would cause a significant drop in stroke volume and potentially, a decrease in cardiac output, even in the presence of the baroreceptor-heart rate reflex [35]. Another well-established baroreceptor mechanism, to keep arterial pressure from decreasing, is the significant peripheral vasoconstriction that occurs when the body position changes from supine to standing [34]. It is apparent from previous investigations that a reduced stroke volume is the result of decreased venous return, and therefore, reduced preload. Regarding HUT, it has been suggested, that a decrease in LV diameter [36], together with an increase in after-load (indicated by increase in peripheral vascular resistance), may also contribute to reducetion in the stroke volume and the eventual decrease in CI [37].
As mentioned previously, the estimation of CAVI is dependent on the pulse wave transmission between the aortic valve and peripheral blood vessels and can be used to express changes in the arterial diameter [27,28]. Such changes in arterial diameter which are evoked by the baroreceptor-sympathetic nerves, in response to incremental changes in the HUT, are precisely expressed by the estimated graded CAVI values at 30˚ and 60˚ of tilt, compared to the baseline supine value (Figures 7(a)-(c)). Thus, CAVI can be used as an index of arterial stiffness, to estimate the degree of vascular bed compliance, which can be altered in various metabolic and/or cardiovascular disorders, as atherosclerosis, which is known to result in
 (a)
(a)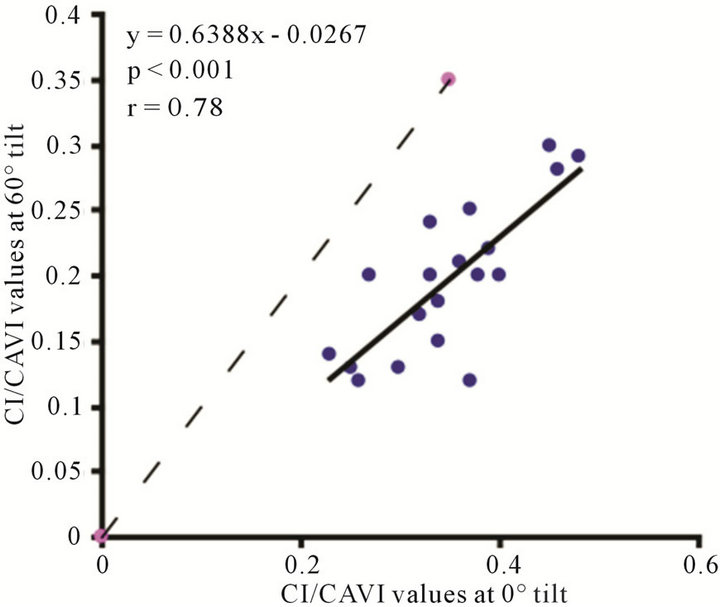 (b)
(b)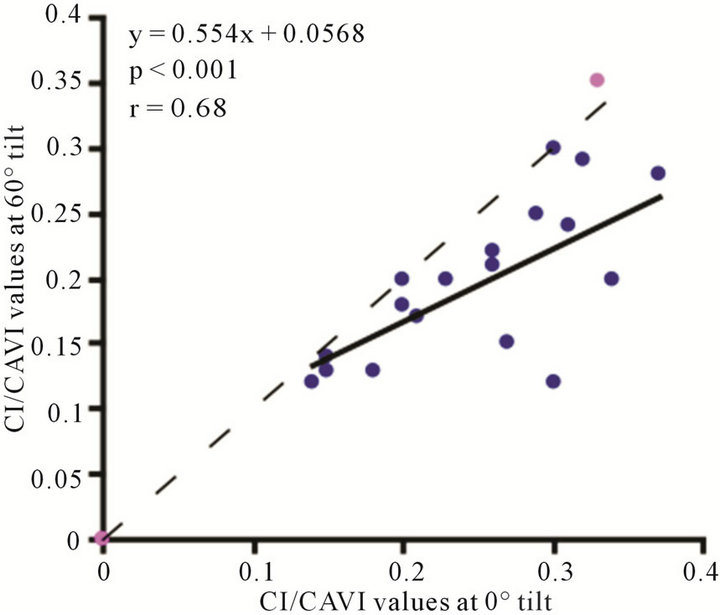 (c)
(c)
Figure 9. Scatter diagrams showing significant correlations between CI/CAVI values at (a) 0˚ and 30˚; (b) 0˚ and 60˚; and (c) 30˚ and 60˚. Dark lines represent lines of regression, and dotted lines: represent lines of identity.
greatly increased vascular stiffness [16]. Moreover, the graded alterations in arterial diameter in response to baroreceptor-sympathetic nerve activity that are induced by changes in HUT, in normal individuals, may provide a novel technique to grade atherosclerosis at different stages. For example, a CAVI of 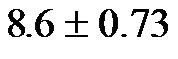 (range, 7.10 - 9.90) obtained at 30˚ may represent modest atherosclerosis and a CAVI of
  (range, 7.75 - 10.45), obtained at 60˚, may represent moderate to severe atherosclerosis. However, a baseline CAVI value of
 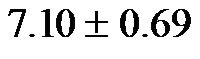 (range, 5.60 - 8.05), with a cut-off of 5.60, obtained at 0˚ may represent the normal value for the younger age group. Larger sample sizes are needed to confirm our findings.
Notably, a considerable body of evidence has implicated both vascular compliance and total peripheral resistance in the determination of after-load, (and, therefore, CO and CI) [38,39]. In this study, we noninvasively demonstrated an inverse correlation between varied degrees of peripheral resistance, reflected by changes in arterial diameter (estimated by CAVI), and overall cardiac performance, expressed as the cardiac index. A consistent and significant inverse relationship was revealed, at different degrees of HUT (Figure 8). However, this correlation was only moderate 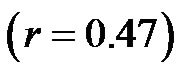 possibly due to the small sample size. In this model, a minor contribution of after-load to the determination of CO can be anticipated; the decreases in CO and CI under HUT were primarily preload dependant. Therefore, it could be argued that the CI/CAVI correlation may apply during only postural changes. Nevertheless, our results are similar to those of a recently published study that evaluated subclinical atherosclerotic processes in 336 Finnish adults between 46 and 76 years of age [40]. In that study, a highly significant inverse relationship was found between increased arterial stiffness (indicated by a decrease in arterial tension time) and stroke volume. However, a multicentre study with a large sample size is needed to further verify the impact of subclinical atherosclerosis on CI. In our CAVI-HUT model, we introduced a new parameter, CI/CAVI. This new index could serve as a parameter for fitness assessment and cardiovascular risk stratification with normal and cut-off values of 0.35 ± 0.06 and 0.23, respectively. Moreover, the CI/CAVI correlation may provide a noninvasive technique to predict CI from the peripheral circulation, using the following equation:
 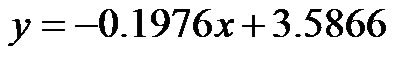 (where y is the CI value and x is the CAVI value). An important limitation of our study is that, antigravity muscle contractions may contribute to the magnitude of increased CAVI measurements during HUT. However, we consistently observed changes in the CAVI values at 30˚ of HUT where the leg muscles have their lowest tone. Furthermore, in paraplegics (who no longer possess any muscle tone), vascular resistance has still been shown to increase at 30˚ of HUT, which is likely to maintain blood pressure [41]. Moreover, during orthostatic stress, an increase in baroreceptor gain contributes to sympathetic nerves hyperactivity and an eventual increase of peripheral resistance [42]. Finally, 60˚ of HUT is designed to achieve modest leg muscle tone [43].
This study was investigative, and we do not advocate CAVI assessments or the use of CI/CAVI correlations in patients with valvular heart diseases or severe obliterative vascular disorders, because CAVI depends on generation of pressure waveforms which are impossible to achieve with these maladies.
5. CONCLUSION
In this investigation, a novel technique (the measurement of CAVI) was employed to assess changes in arterial compliance caused by postural changes in normal individuals, and an inverse correlation between cardiac index (CI) and cardio-ankle vascular index (CAVI) was established Therefore, our approach may have clinical implications for the treatment of patients suffering from metabolic and/or atherosclerotic disorders.
REFERENCES
- Mosteller, R.D. (1987) Simplified calculation of body surface area. The New England Journal of Medicine, 317, 1098. doi:10.1056/NEJM198710223171717
- Ganong, W.F. (2003) Methods of measurement of cardiac output. Review of Medical Physiology, 29, 572-573.
- Feigenbaum, H., Armstrong, W.F. and Ryan, T. (2005) Feigenbaum’s echocardiography. 6th Edition, Hemodynemics, Quantification of Blood Flow, Lippincott Williams & Wilkins, Philadelphia, 2005, 216-221.
- Cardiac Catheterization (2009) Cardiovascular tests and procedures: Merck manual professional. http://www.merckmanuals.com/professional/cardiovascular_disorders/cardiovascular_tests_and_procedures/cardiac_catheterization
- Brandfonbrener, M., landowner, M. and Shock, N.W. (1955) Changes in cardiac output with age. Circulation, 12, 557-566. doi:10.1161/01.CIR.12.4.557
- Kuikka, J.T. and Länsimies, E. (1982) Effect of age on cardiac index, stroke index and left ventricular ejection fraction at rest and during exercise as studied by radiocardiography. Acta Physiologica Scandinavica, 114, 339- 343. doi:10.1111/j.1748-1716.1982.tb06993.x
- Narahara, K.A. and Blettel, M.L. (1983) Effect of rate on left ventricular volumes and ejection fraction during chronic ventricular pacing. Circulation, 67, 323-329. doi:10.1161/01.CIR.67.2.323
- Szturz, P.S., Maca, J.M., Tichy, J.T., Sukenik, P.S., Chylek, V.C., Sklienka, P.S., Jahoda, J.J., and Kula, R.K. (2010) Maintenance of cardiac index within normal range is associated with mortality reduction in patients undergoing major urological surgery. Critical Care, 14, 123. doi:10.1186/cc8355
- Zuccala, G., Cattel, C., Manes-Gravina, E., Di Niro, M.G., Cocchi, A. and Bernabei, R. (1997) Left ventricular dysfunction: A clue to cognitive impairment in older patients with heart failure. Journal of Neurology, Neurosurgery & Psychiatry, 63, 509-512. doi:10.1136/jnnp.63.4.509
- Putzke, J.D., Williams, M.A., Rayburn, B.K., Kirklin, J.K. and Boll, T.J. (1998) The relationship between cardiac function and neuropsychological status among heart transplant candidates. Journal of Cardiac Failure, 4, 295-303. doi:10.1016/S1071-9164(98)90235-4
- Qiu, C., Winblad, B., Marengoni, A., Klarin, I., Fastbom, J. and Fratiglioni, L. (2006) Heart failure and risk of dementia and Alzheimer disease: A population-based cohort study. Archives of Internal Medicine, 166, 1003-1008. doi:10.1001/archinte.166.9.1003
- Jafferson, A.L., Himali, J.J., Beiser, A.S., Au, R., Massaro, J.M., Seshadri, S., Gona, P., Salton, C.J., DeCarli, C., O’Donnell, C.J., Benjamin, E.J., Wolf, P.A. and Manning J. (2010) Cardiac index is associated with brain aging: The Framingham heart study. Circulation Journal, 122, 690-697. doi:10.1161/CIRCULATIONAHA.109.905091
- Coffey, J.P. and Hill, J.C. (2005) Cardiac output and index in obese and non-obese patient using gated single photon emission tomography sestamibi perfusion imaging. The Journal of Hong Kong College of Radiologists, 8, 226-232.
- Rossi, R., Iaccarino, D., Nuzzo, A., Chiurlia, E., Bacco, L., Venturelli, A. and Modena, M.G. (2011) Influence of body mass index on extent of coronary atherosclerosis and cardiac events in a cohort of patients at risk of coronary artery disease. Nutrition, Metabolism & Cardiovascular Diseases, 21, 86-93. doi:10.1016/j.numecd.2009.09.001
- Romero-Corral, A., Montori, V.M., Somers, V.K., Korinek, J., Thomas, R.J., Allison, T.G., Mookadam, F. and Lopez-Jimenez, F. (2006) Association of bodyweight with total mortality and with cardiovascular events in coronary artery disease: A systematic review of cohort studies. Lancet, 368, 666-678. doi:10.1016/S0140-6736(06)69251-9
- Van Popele, N.M., Grobbee, D.E., Bots, M.L., Asmar, R., Topouchian, J., Reneman, R.S., Hoeks, A.P., van der Kuip, D.A., Hofman, A. and Witteman, J.C. (2001) Association between arterial stiffness and atherosclerosis. Stroke, 32, 454-460. doi:10.1161/01.STR.32.2.454
- Murray, C.J.L. and Lopez, A.D. (1997) Alternative projections of mortality and disability by cause 1990-2020: Global burden of disease study. Lancet, 349, 1498-1504. doi:10.1016/S0140-6736(96)07492-2
- Boutouyrie, P., Tropeano, A.I., Asmar, R., et al. (2002) Aortic-stiffness as an independent predictor of primary coronary events in hypertensive patients: A longitudinal study. Hypertension, 39, 10-15. doi:10.1161/hy0102.099031
- Satoh, N., Shimatsu, A., Kato, Y., Araki, R., Kayama, K. Tanabe, M., Ooishi, M., Kotani, K. and Ogawa, Y. (2008) Evaluation of the cardio ankle vascular index, anew indicator of arterial stiffness independent of blood pressure, in obesity metabolic syndrome. Hypertension Research, 31, 1921-1930. doi:10.1291/hypres.31.1921
- Grundy, S.M. (1999) Hypertriglyceridemia, insulin resistance, and the metabolic syndrome. American Journal of Cardiology, 83, 25F-29F. doi:10.1016/S0002-9149(99)00211-8
- Friedrich, M.J. (2002) Epidemic of obesity expands its spread to developing countries. Journal of the American Medical Association, 287, 1382-1386. doi:10.1001/jama.287.11.1382
- Togashi, K., Masuda, H., Rankuich, T., Taicka, S., Butchard, C. and Kamiya, H. (2002) A 12 year follows up study of treated obese children in Japan. International Journal of Obesity and Related Metabolic Disorders, 26, 770-777.
- Izzo, J.L. and Shykoff, B.E. (2001) Arterial stiffness clinical relevance, measurement, and Treatment. Reviews in Cardiovascular Medicine, 2, 29-40.
- Li, B.Y., Gao, H.Q., Li, X.L., Liu, Y.P. and Wang, M. (2006) Correlation between brachial-ankle pulse wave velocity and arterial compliance and cardiovascular risk factors in elderly patients with arteriosclerosis. Hypertension Research, 29, 309-314. doi:10.1291/hypres.29.309
- Ibata, J., Sasaki, H., Kakimoto, T., Matsuno, S., Nakatani, M., Kobayashi, M., Tatsumi, K., Nakano, Y., Wakasaki, H., Furuta, H., Nishi, M. and Nanjo, K. (2008) Cardioankle vascular index measures arterial wall stiffness independent of blood pressure. Diabetes Research and Clinical Practice, 80, 265-270. doi:10.1016/j.diabres.2007.12.016
- Okura, T., Watanab, S., Kurata, M., Manabe, S., Koresawa, M., Irita, J., Enomoto, D., Miyoshi, K., Fukuoka, T. and Higaki, J. (2007) Relationship between cardio-ankle vascular index (CAVI) and carotid atherosclerosis in patients with essential hypertension. Hypertension Research, 30, 335-340. doi:10.1291/hypres.30.335
- Hayashi, K., Sato, M., Niimi, H., Handa, H. and Moritake, K. (1975) [Analysis of the constitutive laws of the vascular wall by finite deformation theory]. Iyodenshi to Seitai Kogaku, 13, 293-298.
- Kawazaki, T., Takeuchi, K., Hasegawa, M., Yagi, S., Nakayama, S. and Takayama, Y. (1982) Noninvasive measurement of common carotid artery effect with echo phase tracking system. Japanese College of Angiology, 22, 241- 248.
- Shirai, K., Utino, J., Otsuka, K. and Takata, M. (2006) A novel blood pressure-independent arterial wall stiffness parameter; cardio ankle vascular index (CAVI). Journal of Atherosclerosis and Thrombosis, 13, 101-110. doi:10.5551/jat.13.101
- Huck, C.J., Bronas, U.G., Williamson, E.B., Christopher, C.D., Duprez, D.A. and Dengel, D.R. (2007) Noninvasive measurement of arterial stiffness: Repeatability and interrelationship with endothelial function and arterial morphology measures. Vascular Health and Risk Management, 3, 343-349.
- Hainsworth, R. and AL-Shamma, Y.M. (1988) Cardiovasculer responses to upright tilting in healthy subjects. Clinical Science (London), 75, 17-22.
- Hainsworth, R. and AL-Shamma, Y.M. (1988) Cardiovascular responses to stimulation of carotid baroreceptor in healthy subjects. Clinical Science (London), 75, 159- 165.
- Agnin, P.A., Stewart, J.A., Myers, S., von Ramm, O. and Kisslo, J.A. (1981) Combined doppler and phased-array echocardiographic estimation of cardiac output. Circulation, 63, 388-392. doi:10.1161/01.CIR.63.2.388
- Toska, K. and Wollqe, L. (2002) Dynamic time course of hemodynamic responses after passive head up tilt and time back to supine position. Journal of Applied Physiology, 92, 1671-1676.
- Cooke, W.H., Hoag, J.B., Crossman, A.A., Kuusela, T.A., Tahvanainen, K.U. and Eckberg, D.L. (1999) Human responses to upright tilt: A window on central autonomic integration. The Journal of Physiology, 517, 617-628. doi:10.1111/j.1469-7793.1999.0617t.x
- Rankin, L.S., Moos, S. and Grossnian, W. (1975) Alterations in preload and ejection phase indices of left ventricular performance. Circulation, 51, 910-915. doi:10.1161/01.CIR.51.5.910
- Benzing III, G., Stockert, J., Nave, E. and Kaplan, S. (1974) Evaluation of left ventricular performance: Circumferential fiber shortening and tension. Circulation, 49, 925-932. doi:10.1161/01.CIR.49.5.925
- Slordahl, S.A. and Piene, H. (1991) Haemodynamic effects of arterial compliance, total peripheral resistance, and glyceryl trinitrate on regurgitant volume in aortic regurgitation. Cardiovascular Research, 25, 869-874. doi:10.1093/cvr/25.10.869
- Urschel, C.W., Covell, J.W., Sonnenblick, E.H., Ross, J. and Braunwald, E. (1968) Effect of decrease of aortic compliance on performance of the left ventricle. American Journal of Physiology, 214, 298-304.
- Koivistoinen, T., Koobi, T., Moilanen, L., Jula, A., Lehtimaki, T., Hyttinen, J. and Kahonen, M. (2011) Arterial tension time reflects subclinical atherosclerosis, arterial stiffness and stroke volume. Clinical Physiology and Functional Imaging, 31, 464-471. doi:10.1111/j.1475-097X.2011.01042.x
- Groothuis, J.T., Boot, C.R., Houtman, S., van Langen, H. and Hopman, M.T. (2005) Leg vascular resistance increases during head-up tilt in paraplegics. European Journal of Applied Physiology, 94, 408-414. doi:10.1007/s00421-005-1340-5
- Cooper, V.L. and Hainsworth, R. (2001) Carotid baroreceptor reflexes in humans during orthostatic stress. Experimental Physiology, 86, 677-681. doi:10.1113/eph8602213
- Petersen, M.E.V., Williams, T.R., Gordon, C., Chamberlain-Webber, R. and Sutton, R. (2000) The normal response to prolonged passive head up tilt testing. Heart, 84, 509-514. doi:10.1136/heart.84.5.509