Open Journal of Preventive Medicine
Vol.3 No.2(2013), Article ID:30607,7 pages DOI:10.4236/ojpm.2013.32022
Black-White residential segregation and diabetes status: Results from the Behavioral Risk Factor Surveillance System
![]()
1Department of Sociology, The George Washington University, Washington DC, USA; *Corresponding Author: antwan@gwu.edu
2Department of Kinesiology and Community Health, Division of Nutritional Sciences, University of Illinois at Urbana-Champaign, Champaign, USA
3Quantitative Sciences Unit, Stanford University School of Medicine, Stanford, USA
Copyright © 2013 Antwan Jones et al. This is an open access article distributed under the Creative Commons Attribution License, which permits unrestricted use, distribution, and reproduction in any medium, provided the original work is properly cited.
Received 15 January 2013; revised 3 March 2013; accepted 14 April 2013
Keywords: Diabetes; Multilevel modeling; Residential segregation; Socioeconomic status; Spatial analysis
ABSTRACT
Racial residential segregation in the United States is generally associated differences in health outcomes among Blacks and Whites due to differential exposures to physical, social and economic resources. While several studies have explored the association between segregation and several chronic conditions in the US, few have specifically examined diabetes using a nationally representative population-based sample. The current study relies on 2005 data from both the Behavioral Risk Factor Surveillance Survey (BRFSS) and the American Community Survey (ACS) to explore the association between segregation, socioeconomic status and diabetes. Using multilevel mixed-effects logistic regression, we present models that account for clustering of individuals within metropolitan areas and are adjusted for objective environmental measures (including segregation) and potential individual-level confounders (including education, employment, and income) among a sample of 121,321 adults who were at least 18 years old. After controlling for individual-level factors, Blacks residing in highly segregated areas have the same odds of being diagnosed with diabetes as Whites. Whites are more likely to be diagnosed with diabetes in areas where there are higher percentages of Blacks than in areas with low Black representation. Moreover, in this national sample, there is no statistical association between Blacks residing in highly segregated neighborhoods and diabetes risk. However, the increased prevalence of diabetes among Whites living in Black metropolitan areas suggests that future studies are needed to explore the linkages between levels of segregation and diabetes risk.
1. INTRODUCTION
In the US, Black-White differences in health are spatially patterned. That is, the locational differences between Blacks and Whites are directly related to Blacks’ lower life expectancy, quality of life, and self-rated health [1]. The major spatial catalyst producing racial differences in health is residential segregation, a culmination of socioeconomic and political factors which keeps racial and ethnic groups from physically and socially interacting with one another [2]. Some studies suggest that 70% of Blacks live in segregated areas, compared to 10% of Whites [3]. Segregated areas with a high Black concentration also tend to be impoverished, primarily because of the lack of infrastructural and economic investments made in majority-Black neighborhoods in metropolitan areas [4,5]. As a consequence, the local neighborhood environment in these areas is unsupportive of health-promoting behaviors that would place individuals at lower risk for several chronic diseases such as diabetes [6]. Notably, the housing stock and hospitals are of low-quality, the outdoor spaces (such as parks or sidewalks) are poorly maintained [7,8] and there is a reticence to engaging in outdoor physical activities because of low levels of community trust and high levels of crime [9]. In addition, segregated Black neighborhoods have approximately 3 times more fast food restaurants and 1/3 less supermarkets than White neighborhoods with similar socioeconomic status [10,11]. Thus, the racial difference in access to area amenities could be influential in understanding the Black-White differences in health outcomes such as diabetes.
Notwithstanding, recent studies have suggested that within segregated areas, there is still a substantial difference in health status among Blacks and Whites [12]. If true, then metropolitan infrastructure cannot be the sole mechanism that explains divergent racial health outcomes such as diabetes. Socioeconomic status (SES) has long been established as a powerful predictor of health [13]. High levels of SES are associated with more positive health behaviors that reduce the risk of chronic diseases such as eating healthier foods, refraining from smoking and alcohol, and engaging in more exercise [13]. Having high levels of SES may empower individuals living in infrastructurally poor neighborhoods by enabling those residents to travel to other areas with more structural resources. Generally, Blacks have lower levels of education, income, wealth, and occupational prestige compared to Whites [14]. Thus, the racial differences in SES could be influential in understanding the racial difference in diabetes risk. Given the rise of income segregation and the decline in racial segregation in US cities [15], it is important to consider the connection between individual SES and the larger residential context in predicting disparities in health outcomes such as diabetes.
While segregation has been tied to various health outcomes [16,17], few studies to date have explored how segregation is related to diabetes. This omission is important, since recent estimates suggest that 18.7% of Blacks who are at least 20 years of age have diabetes, compared to 10.2% of Whites [18]. National diabetes surveillance data also indicates that Blacks are twice more likely to die with diabetes than Whites [19]. While medical and epidemiological research has focused on lifestyle behaviors as mechanisms contributing to the Black-White difference in diabetes [20], studies that have controlled for these behaviors still find significant racial differences in diabetes risk [21]. In a study by Chan et al., individuals living in a segregated area had significant problems with seeing a medical specialist to manage their diabetes compared to persons who did not live in segregated areas [22]. However, Chan et al. suggest that high-quality diabetes care is present in segregated areas, primarily because of the success of safety net providers.
This study relies on nationally-representative, metropolitan data and attempts to situate segregation to diabetes risk (instead of diabetes care) by examining race and space in determining diabetes risk in the US after adjusting for various lifestyle and health-related factors. Since the prior work on this topic is scant, two competing hypotheses are tested in this study. First, diabetes may not depend on the residential context. That is, diabetes may be more evenly distributed among all metropolitan areas than other morbidities. However, because there are still racial differences in the incidence of diabetes, it is possible that individual socioeconomic status has a more powerful effect than residential context. Second, diabetes may result from both individual and residential characteristics. Specifically, the health behaviors that are thought to be precursors of diabetes (e.g., exercise, food intake) are largely shaped by the areas in which people reside. Because of the spatial patterning of these behaviors, it is also hypothesized that both individual and contextual indicators would interact and produce racial differences in diabetes.
2. DATA
Population data is derived from the 2005 Behavioral Risk Factor Surveillance System (BRFSS), which is a is the world’s largest, on-going annual telephone health survey system, tracking health conditions and risk behaviors in the adult population (18 years of age or older) living in households in the United States. Currently, data are collected monthly in all 50 states, the District of Columbia, Puerto Rico, the US Virgin Islands, and Guam. Data are collected from a random sample of adults (one per household) through a telephone survey [23]. This dataset also contains geopolitical indicators at both the individualand metropolitan-level of analysis. On average, missing data accounted for about 7% of each measure. Respondents who are missing information on any of the variables, as well as individuals who have gestational diabetes, are dropped from the analyses, leaving an analytical sample of 121,321 persons.
Metropolitan data comes from the 2005 American Community Survey (ACS). The ACS is a monthly household survey developed by the US Census Bureau to provide data users with annual estimates of household, social, and economic characteristics for geographies and populations of at least 65,000 people. Using the ACS, the University of Michigan also publishes segregation data at the metropolitan level in the Racial Residential Segregation Measurement Project [24]. The measures from this project are used to assign levels of segregation to the metropolitan environment of BRFSS respondents included in the sample.
2.1. Dependent Variables
Diabetes Risk. Diabetes risk is measured by a question that asks whether or not respondents have ever been told by a health professional that they have diabetes. Respondents were not asked to indicate diabetes type (e.g., type 1 or type 2); rather, a general clinical diagnosis is ascertained.
2.2. Individual Sociodemographic Variables
Socioeconomic Status. Respondent’s education is divided into four categories: less than high school, high school graduate, some college and graduated college. Respondent’s income is constructed to include household total income, excluding income from interest, dividends, and other investments. This measure includes other income for each person such as disability assistance, social security, and public assistance, which are contributed to the household but are not necessarily from earnings. Income is represented by series of dummy variables represented by the categories: less than $15,000, $15,000 to $25,000, $25,000 to $35,000, $35,000 to $50,000, and more than $50,000. All respondents are asked to indicate their employment status. This variable indicates whether or not the respondents worked (fullor part-time) during the previous year.
Health Measures. Body Mass Index (BMI) measures adiposity based on height and weight that applies to both adult men and women. A series of variables corresponding to the Centers for Disease Control and Prevention’s definition of BMI categories are used: Underweight, normal weight, overweight and obese [25]. Physical activity assesses the number of days per week respondents perform at least 10 minutes of exercise excluding workrelated activities. Fruit/Vegetable Intake is assessed using self-report by asking whether the respondent eats 5 or more fruit and vegetables per day. Insurance status assesses whether or not the respondent has any kind of public or private health insurance. Smoker status is measured with a series of dummy variables characterize respondents as current smokers, former smokers or nonsmokers at time of interview.
Demographic Controls. Race is self-reported and captured by a series of variables (White, Black and Other). Other collapses Asian, Native Hawaiian, Pacific Islander, American Indian, Alaska native, and multiracial [23]. Because Latino identity is treated as an ethnicity and not a race in the US, Hispanics are excluded from the analyses. Age at time of survey is measured in complete years. Gender is categorized as either currently in a relationship (i.e., married, coupled with an unmarried partner) or currently not in a relationship (i.e., never married, separated, divorced, widowed).
2.3. Metropolitan Measures
Segregation. Massey and Denton [26] identify five distinct but complimentary measures of racial residential segregation: evenness, exposure, centralization, clustering and concentration. Evenness refers to the differential distribution of racial groups across neighborhoods. Exposure measures the probability of interaction between racial groups. Centralization indicates the distance from the center of the urban area where racial groups live. Clustering measures the degree to which racial groups live in areas that adjoin one another in space. Concentration refers to the amount of physical space occupied by the racial minority group. These indices have been used to model diabetes care [22] and other health outcomes. From these measures, three distinct types of segregated environments are constructed. Hypersegregated areas correspond to Metropolitan Statistical Areas (MSAs) that score 0.60 or higher on at least four of five segregation measures. Segregated areas score 0.60 or higher on one, two, or three of the five measures of segregation. Lastly, nonsegregated areas are those MSAs that did not score high on any of the segregation measures. Segregation values for the MSAs are derived from the Racial Residential Segregation Measurement Project at the University of Michigan [24]. For reference, the US Bureau of the Census defines an MSA as an area that contains a city or urbanized area with 50,000 or more inhabitants [27].
Area Controls. In order to capture the spatial nature of segregation, a few MSA characteristics are used as control variables to examine the effect of segregation on diabetes. These measures are linked to the MSA the respondent resided in during 2005. The first is population size, which is logged. The proportion of residents who are below the poverty line is also used as a control measure. The proportion of Blacks in the MSA is used to control for racial concentration. These covariates are derived from the 2005 ACS estimates and are merged onto the BRFSS data file using 6-digit MSA codes that are present in both the ACS and the BRFSS.
3. METHODS
Statistical Analyses
Univariate analyses are employed to summarize each variable and bivariate analyses are conducted to assess the relationship between the variables of interest and diabetes risk. Multilevel mixed-effects logistic models allow for the examination of the relationship between individual sociodemographic controls, metropolitan measures and diabetes risk. Multilevel statistical models are used to estimate the parameters of interest since the structure of the data is two-level (individual and MSA) and hierarchical. Lastly, the sample is stratified and race-specific analyses are conducted to examine the relationship between individual sociodemographic controls, metropolitan measures and diabetes risk separately for Whites and Blacks. All analyses are performed using SAS, version 9.1, and the models are fit using GLIMMIX procedures [28].
4. RESULTS
Drawing from Table 1, the majority of this sample has not been told that they have diabetes (91.3%). Socioeconomically, over two-thirds of the sample has some college exposure (65.2%) and is employed (63.2%), while almost half (44.1%) have household incomes greater than $50,000. The sample’s health demographics indicates that over a third (62.1%) of the respondents have BMIs that are in the overweight or obese range and on average, individuals do less than one hour of physical activity per week ( = 51.5 minutes per week). Moreover, the majority of the respondents eats less than five fruits and vegetables a day (75.0%), has health insurance (90.2%) and has never smoked (51.3%). Demographically, the sample is overwhelmingly White (85.7%), female (59.6%) and currently in a relationship (59.2%). The sample is also approaching middle age (
 = 50.5 years old). At the metropolitan level, respondents tend to live in segregated areas (69.1%). On average, respondents live in areas with approximately 754,230 persons, with a 14.2% poverty rate and 11.1% Black representation.
In the regression models predicting diabetes propensity for the entire sample, individuals who have at least completed high school, have household incomes greater than $15,000 and are employed, are significantly less likely to be diagnosed with diabetes (Table 2). Being overweight or obese, eating five or more fruits and vegetables per week and being a former smoker are all associated with diabetes diagnosis. Having insurance (P < 0.001) and never smoking (P < 0.05) are the two protective factors against being diagnosed with diabetes. Demographically, the propensity of being diabetic is enhanced for men and Blacks. While type of segregation is not predictive of diabetes diagnosis, both metropolitan area population size and percentage of Blacks do enhance this risk.
Turning to the race-specific models, the data reveal that lower-income Whites have a health advantage that Blacks do not have, since an income of $15,000 curbs diabetes risk among Whites but a household income of at least $35,000 is needed for the same effect among Blacks. Engaging in weekly physical activity, having health insurance and being a female appears to be protective against diabetes for Whites but not for Blacks. In this sample, Blacks are disadvantaged by refraining from smoking but this is not true for Whites. For the metropolitan measures, the effect is largely driven by the areas where Whites in the sample live. More precisely, the metropolitan variables do not explain diabetes diagnoses among Blacks, but population size and the percentage of Blacks in a metropolitan area raises the chance that a White person may be diagnosed with diabetes. Both measures
Table 1. Individual and metropolitan-level descriptive statistics*.
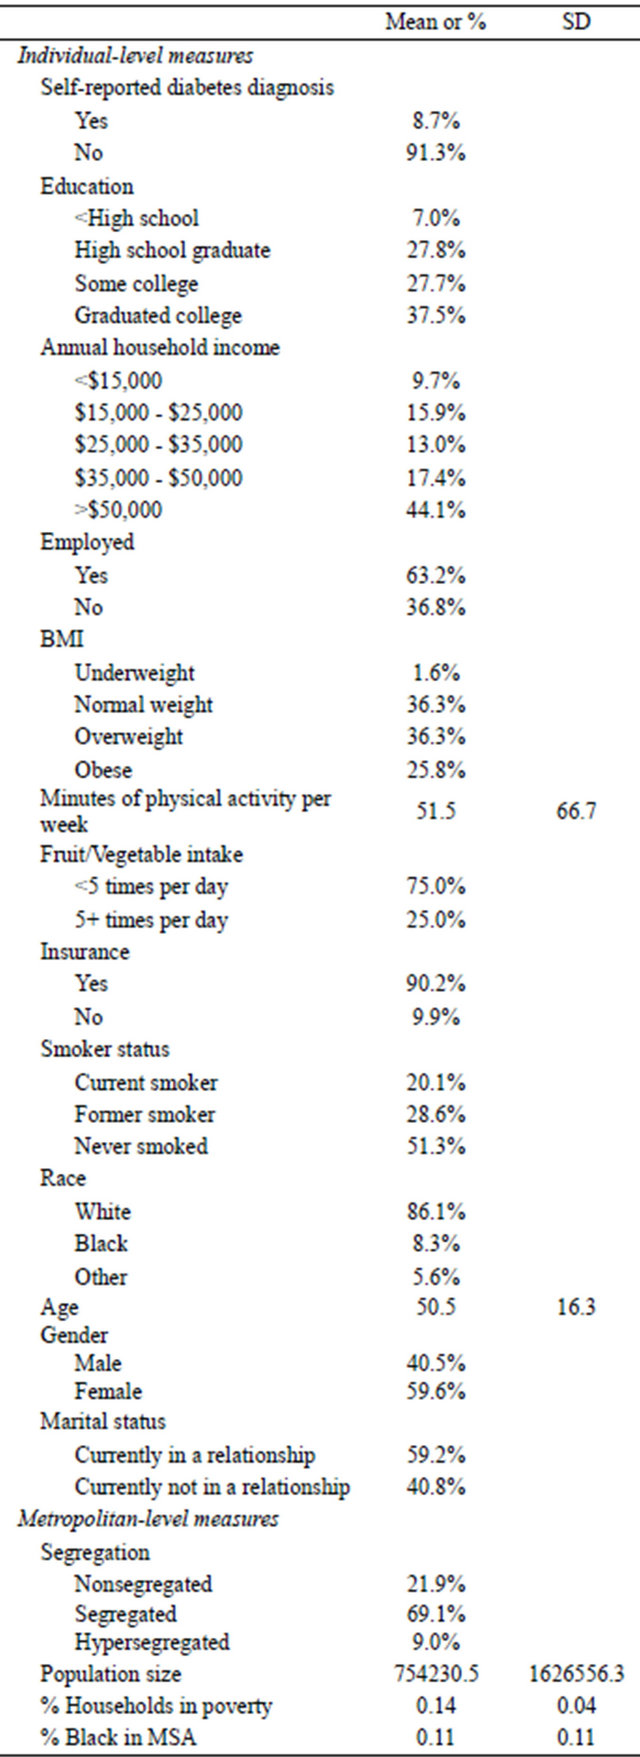
*n = 121,321; SD = standard deviation.
Table 2. Standardized regression coefficients for hierarchical linear modeling of the effects of individual and metropolitan measures on diabetes diagnosis.
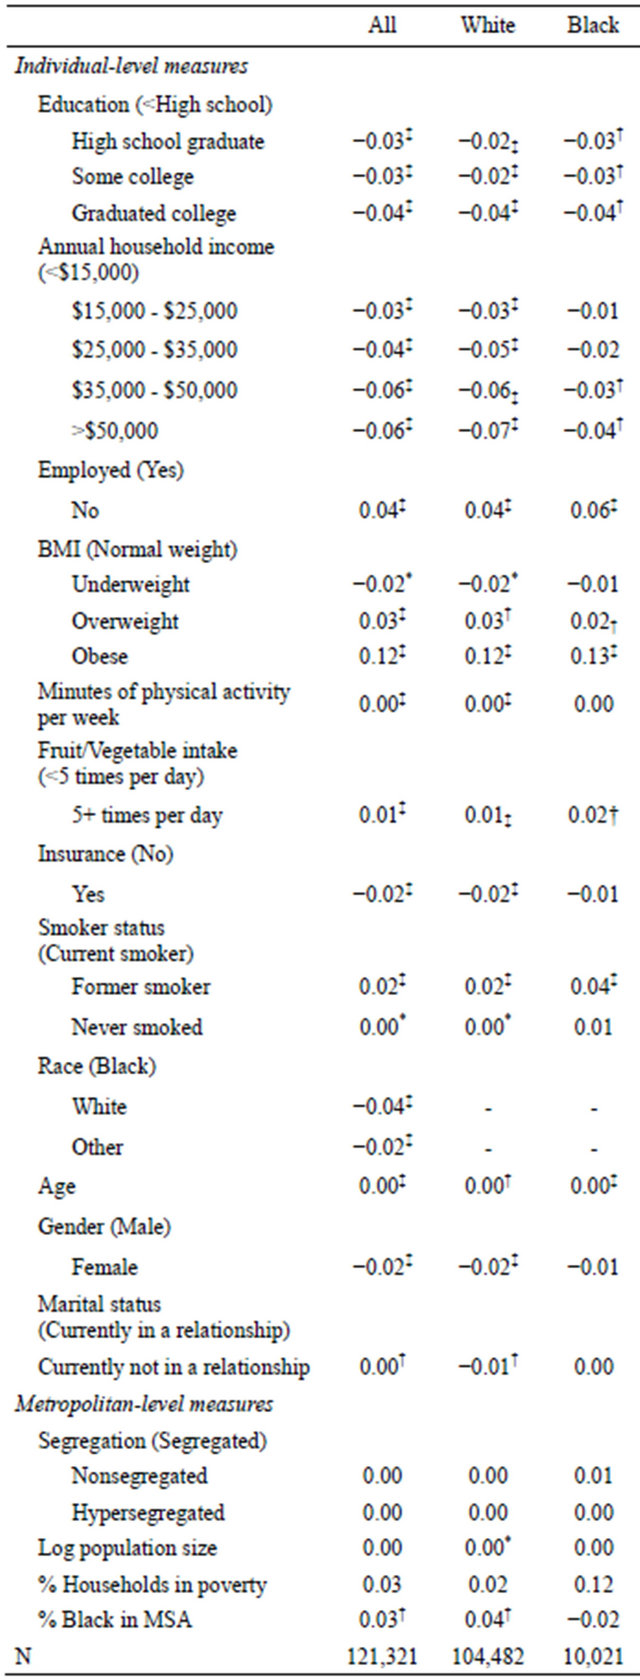
*P < 0.05; †P < 0.01; ‡P < 0.001. Contrast categories in parentheses; All refers to the full sample, which includes the “other” racial category.
are also significant in the combined model, suggesting that the effects of population size and the percentage of Blacks in the area are largely driven by Whites living in metropolitan areas.
5. DISCUSSION
Consistent with prior research, this study found significant racial and socioeconomic differences in diabetes diagnosis between Blacks and Whites [29,30]. That is, compared to Blacks, Whites had lower odds (OR = 0.96) of being diagnosed with diabetes. Being affluent, as measured by higher levels of education and income, confers additional protection against a diabetes diagnosis. The differences in the residential environments of Blacks and Whites may explain why Blacks have a higher diabetes risk in this sample. Specifically, Whites are more likely to reside in neighborhoods with more resources that presumably encourage more health-promoting behaviors that reduce diabetes risk compared to Blacks. One study found that compared to Whites, Blacks were less likely to live in neighborhoods with access to supermarkets, where fresh fruits and vegetables tend to be more readily available [31].
This analysis indicated that while residence in areas with high levels of segregation did not increase diabetes risk among Blacks, other metropolitan characteristics associated with segregation were important for Whites. Whites residing in areas with high concentrations of Blacks were more likely to report a diagnosis of diabetes in this sample. There may be two reasons for this finding. First, Whites residing in areas with high concentrations of Blacks may be subject to the same adverse conditions (e.g., lack of community resources to encourage healthpromoting behaviors) that potentially increase diabetes risk. A recent study examining the influence of the neighborhood environment on the health of Blacks and Whites residing in the same neighborhood found that disparities in health outcomes and behaviors typically present at the national level were non-existent [32]. Because Blacks and Whites were living under the same neighborhood conditions, the researchers suggested that Whites did not reap additional environmental benefits that tend to provide a distinct health advantage over Blacks.
Second, it is possible that segregation serves as a protective factor against diabetes risk among both Blacks and Whites. A recent study among elderly AfricanAmericans found that residing in racially homogeneous neighborhoods was protective against cardiovascular disease risk [33]. Because the mean age of the sample used in this study is nearly 50 years old, it is possible that the protective cardiovascular risk benefits suggested in the previous study might also aid in curbing diabetes.
While much of the literature on diabetes risk relates to indicators of neighborhood quality, very few studies have explored metropolitan variation in diabetes diagnoses [34]. Previous studies are localized to a particular area, and do not offer ways in which racial residential segregation may play a role in determining diabetes diagnosis. This research overcomes the aforementioned oversights in the literature by addressing these gaps. This study suggests that racial differences in sociodemographic and health characteristics, as well as racial differences in where people are located contribute to a divergence in risk of being diagnosed with diabetes.
Some limitations to this study should be noted. First, because the study was cross sectional in design, no causal inferences can be made. Second, the individual-level measures are based on self-reported data, so issues of validity and interviewer bias may play a role in how the respondents answered the questions. Third, other variables that could be proxies for metropolitan health (e.g., number of hospitals, doctors per capita) were unavailable but could aid in understanding metropolitan-level resource differences. Fourth, the BRFSS definition of diabetes does not differentiate between type 1 and type 2 diabetes. Both types are influenced by different socio-environmental factors [35]. Thus, the grouping of both forms may suppress a statistically significant relationship with residential segregation.
Notwithstanding, the data are robust to replicate similar findings related to individual-level predictors of diabetes diagnosis [36], and the data also offer the significant, predictive value of metropolitan measures in determining diabetes risk. The large and diverse sample size, coupled with the large amount of data on individual and metropolitan characteristics add power to the findings. Accordingly, this study makes a significant and relevant contribution to the diabetes literature by suggesting independent and synergistic effects that residence has in determining who could be at risk for developing diabetes.
REFERENCES
- White, K. and Borrell, L.N. (2011) Racial/ethnic residential segregation: Framing the context of health risk and health disparities. Health & Place, 17, 438-448. doi:10.1016/j.healthplace.2010.12.002
- Williams, D.R. and Collins, C. (2001) Racial residential segregation: A fundamental cause of racial disparities in health. Public Health Reports, 116, 404-416.
- Wilkes, R. and Iceland, J. (2004) Hypersegregation in the twenty-first century. Demography, 41, 23-36. doi:10.1353/dem.2004.0009
- Massey, D.S., Gross, A.B. and Eggers, M.L. (1991) Segregation, the concentration of poverty, and the life chances of individuals. Social Science Research, 20, 397-420. doi:10.1016/0049-089X(91)90020-4
- Acevedo-Garcia, D., Lochner, K.A., Osypuk, T.L., et al. (2003) Future directions in residential segregation and health research: A multilevel approach. American Journal of Public Health, 93, 215-221. doi:10.2105/AJPH.93.2.215
- Ludwig, J., Duncan, G.J., Gennetian, L.A., et al. (2012) Neigborhood effects on the long-term well-being of lowincome adults. Science, 337, 1505-1510. doi:10.1126/science.1224648
- Kaczynski, A.T., Johnson, A.J. and Saelens, B.E. (2009) Neighborhood land use diversity and physical activity in adjacent parks. Health and Place, 16, 413-415. doi:10.1016/j.healthplace.2009.11.004
- Moore, L.V., Roux, A.V.D., Evenson, K.R., et al. (2008) Availability of recreational resources in minority and low socioeconomic status areas. American Journal of Preventive Medicine, 34, 16-22. doi:10.1016/j.amepre.2007.09.021
- Scott, M.M., Dubowitz, T. and Cohen, D.A. (2009) Regional differences in walking frequency and BMI: What role does the built environment play for Blacks and Whites? Health and Place, 15, 897-902. doi:10.1016/j.healthplace.2009.02.010
- Kwate, N.O.A. (2008) Fried chicken and fresh apples: Racial segregation as a fundamental cause of fast food density in black neighborhoods. Health and Place, 14, 32-44. doi:10.1016/j.healthplace.2007.04.001
- Powell, L.M., Chaloupka, F.J. and Bao, Y. (2007) The availability of fast-food and full-service restaurants in the United States. American Journal of Preventive Medicine, 33, S240-S245. doi:10.1016/j.amepre.2007.07.005
- Fang, J., Madhavan, S., Bosworth, W., et al. (1998) Residential segregation and mortality in New York City. Social Science & Medicine, 47, 469-476. doi:10.1016/S0277-9536(98)00128-2
- Adler, N.E. and Ostrove, J.M. (2006) Socioeconomic status and health: What we know and what we don’t. Annals of the New York Academy of Sciences, 896, 3-15. doi:10.1111/j.1749-6632.1999.tb08101.x
- LaVeist, T.A., Thorpe, R.J., Galarraga, J.E., et al. (2009) Environmental and socio-economic factors as contributors to racial disparities in diabetes prevalence. Journal of General Internal Medicine, 24, 1144-1148. doi:10.1007/s11606-009-1085-7
- Fischer, M.J. (2003) The relative importance of income and race in determining residential outcomes in US urban areas, 1970-2000. Urban Affairs Review, 38, 669-696. doi:10.1177/1078087403038005003
- Kramer, M.R. and Hogue, C.R. (2009) Is segregation bad for your health? Epidemiologic Reviews, 31, 178-194. doi:10.1093/epirev/mxp001
- Warner, E.T. and Gomez, S.L. (2010) Impact of neighborhood racial composition and metropolitan residential segregation on disparities in breast cancer stage at diagnosis and survival between Black and White women in California. Journal of Community Health, 35, 398-408. doi:10.1007/s10900-010-9265-2
- Centers for Disease Control and Prevention (2012) National diabetes fact sheet: General information and national estimates on diabetes in the United States, 2011. US Department of Health and Human Services, Centers for Disease Control and Prevention, Atlanta.
- National Center for Health Statistics (2012) Health, United States, 2011: With special feature on socioeconomic status and health. US Department of Health and Human Services, Centers for Disease Control and Prevention, Hyattsville.
- Dressler, W.W., Oths, K.S. and Gravlee, C.C. (2005) Race and ethnicity in public health research: Models to explain health disparities. Annual Review of Anthropology, 34, 231-252. doi:10.1146/annurev.anthro.34.081804.120505
- Signorello, L.B., Schlundt, D.G., Cohen, S.S., et al. (2007) Comparing diabetes prevalence between African Americans and Whites of similar socioeconomic status. American Journal of Public Health, 97, 2260-2267. doi:10.2105/AJPH.2006.094482
- Chan, K.S., Gaskin, D.J., Dinwiddie, G.Y., et al. (2012) Do diabetic patients living in racially segregated neighborhoods experience different access and quality of care? Medical Care, 50, 692-699. doi:10.1097/MLR.0b013e318254a43c
- Mokdad, A.H., Stroup, D.F. and Giles, W.H. (2003) Public health surveillance for behavioral risk factors in a changing environment: Recommendations from the behavioral risk factor surveillance team. Morbidity and Mortality Weekly Report, 52, 1-12.
- Farley, R. (2001) Racial residential segregation: Census 2000 findings. http://enceladus.isr.umich.edu/race/racestart.asp
- NHLBI Obesity Education Initiative Expert Panel (1998) Clinical guidelines on the identification, evaluation, and treatment of overweight and obesity in adults—The evidence report. National Institutes of Health, National Heart, Lung, and Blood Institute, Bethesda.
- Massey, D.S. and Denton, N.A. (1989) Hypersegregation in US metropolitan areas: Black and Hispanic segregation along five dimensions. Demography, 26, 373-391. doi:10.2307/2061599
- US Bureau of the Census (2010) Metropolitan and micropolitan statistical areas. http://www.census.gov/population/metro/about/
- SAS Institute Inc. (2004) SAS 9.1.3 Help and Documentation. SAS Institute Inc., Cary.
- Zhang, H. and Rodriguez-Monguio, R. (2012) Racial disparities in the risk of developing obesity-related diseases: A cross-sectional study. Ethnicity and Disease, 22, 308- 316.
- Link, C.L. and McKinlay, J.B. (2009) Disparities in the prevalence of diabetes: Is it race/ethnicity or socioeconomic status? Results from the Boston Area Community Health (BACH) survey. Ethnicity and Disease, 19, 288- 292.
- Morland, K., Wing, S. and Roux, A.D. (2002) The contextual effect of the local food environment on residents’ diets: The atherosclerosis risk in communities study. American Journal of Public Health, 92, 1761-1768. doi:10.2105/AJPH.92.11.1761
- LaVeist, T., Pollack, K., Thorpe, R., et al. (2011) Place, not race: Disparities dissipate in southwest Baltimore when blacks and whites live under similar conditions. Health Affairs, 30, 1880-1887. doi:10.1377/hlthaff.2011.0640
- Alvarez, K.J. and Levy, B.R. (2012) Health advantages of ethnic density for African American and Mexican American elderly individuals. American Journal of Public Health, 102, 2240-2242. doi:10.2105/AJPH.2012.300787
- Ford, E.S., Mokdad, A.H., Giles, W.H., et al. (2005) Geographic variation in the prevalence of obesity, diabetes, and obesity-related behaviors. Obesity, 13, 118-122. doi:10.1038/oby.2005.15
- Grigsby-Toussaint, D.S., Lipton, R., Chavez, N., et al. (2010) Neighborhood socioeconomic change and diabetes risk. Diabetes Care, 33, 1065-1068. doi:10.2337/dc09-1894
- Mokdad, A.H., Ford, E.S., Bowman, B.A., et al. (2003) Prevalence of obesity, diabetes, and obesity-related health risk factors, 2001. The Journal of the American Medical Association, 289, 76-79. doi:10.1001/jama.289.1.76