Open Journal of Physical Chemistry
Vol.4 No.1(2014), Article ID:43155,5 pages DOI:10.4236/ojpc.2014.41004
Thermodynamic Characterization of Saccharomyces cerevisiae Catalyzed Fermentation of Cane Sugar
Department of Chemistry, Ambrose Alli University, Ekpoma, Nigeria
Email: *akpovin2@gmail.com
Copyright © 2014 Egharevba Felix et al. This is an open access article distributed under the Creative Commons Attribution License, which permits unrestricted use, distribution, and reproduction in any medium, provided the original work is properly cited. In accordance of the Creative Commons Attribution License all Copyrights © 2014 are reserved for SCIRP and the owner of the intellectual property Egharevba Felix et al. All Copyright © 2014 are guarded by law and by SCIRP as a guardian.
Received December 9, 2013; revised January 8, 2014; accepted January 16, 2014
KEYWORDS
Fermentation; Substrate Concentration; Kinetics; Cane sugar; Thermodynamic Parameters
ABSTRACT
The rate of cane sugar fermentation with Saccharomyces cerevisiae was studied at temperatures between 30˚C and 42˚C in order to characterize the process using thermodynamic parameters such as enthalpy (ΔH*), activation energy (ΔE*), entropy (ΔS*), Gibbs free energy (ΔG*) and equilibrium constant (K). The parameters were evaluated on the basis of a consideration of Arrhenius, Eyring and Van’t Hoff’s equations. The results obtained are ΔH*, 91.85 KJ∙mol−1; ΔE*, 91.85 KJ∙mol−1, ΔS*, 2763 J∙mol−1K−1; ΔG*, -762.09 KJ∙mol−1, and equilibrium constant, K, 1.34 dm3∙mol−1. These values were subsequently used to obtain by calculation the rate constant of the fermentation k, 1.43 × 10¹¹ min−1, Arrhenius constant A (pre-exponential or frequency factor), 4.79 × 1026 min−1, orientation parameter, P, 4.48 × 10¹⁵ and the collision frequency Z, 1.07 × 10¹¹ min−1. Finally the fermentation efficiency calculated on the basis of a complete combustion of glucose is 377.8%. The results showed that though the fermentation process is kinetically controlled, it is suggested that the positive impact of the feasible thermodynamics is limited by other process variables.
1. Introduction
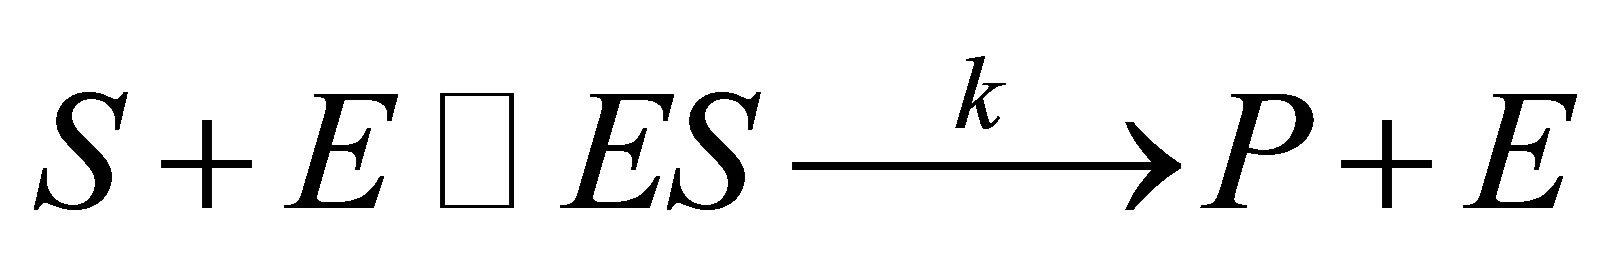
Fermentation involves living cells that are usually considered open systems optimally maintained at a steady state [1]. Fermentation is also a slow reaction in the absence of a catalyst. Ordinarily, the process is not spontaneous and hence is aided with a catalyst (enzyme) that renders it thermodynamically controlled [2]. In general, thermodynamic studies aimed at deciding which direction that such a reaction will proceed in terms of spontaneity, embedded in the second law of thermodynamics and the equilibrium constant which determines the extent to which any particular reaction will proceed under any given conditions. It was previously held that fermentation catalyzed by enzyme could not be treated in the usual classical molecular reaction models nor the equilibrium attained between reactants and products or intermediates handled as if it were like the familiar thermodynamic system [3]. It has also been noted that the free energy ΔG* that derives a chemical reaction is also not frequently calculated for fermentation on account of several possible reaction pathways [4]. Yet the second law of thermodynamics is deployed to determine which products will accumulate in such a system. Besides, thermodynamic concepts have been used to predict microbial growth, which is a key consideration in many industrial biotechnology processes [5]. Be that as it may, we will consider the first step in the two-step reaction involved in the fermentation as a rapid equilibrium leading to a complex of the enzyme and substrate reminiscent of a lock and key system in which the enzyme provides a lower activation energy exclusive of any tunneling action of the reactants. However, since the enzyme merely provides a catalytic action offering lower energy pathway, we shall in this report adapt the Eyring [6] absolute reaction rate theory (transition state theory) since there are adequate facilities nowadays to monitor or measure the products of fermentation. The quantity KBT/h in the Eyring’s equation is independent of the nature of reactants or activated complex and would be the same for all changes occurring at the same temperature [7]. Further Park and Erik [8] had shown that the Arrhenius equation [9] can also be applied to enzyme reactions to a certain temperature limit. We support therefore the possible thermodynamics that would apply to enzyme reactions (Equation (1)) from a consideration of:
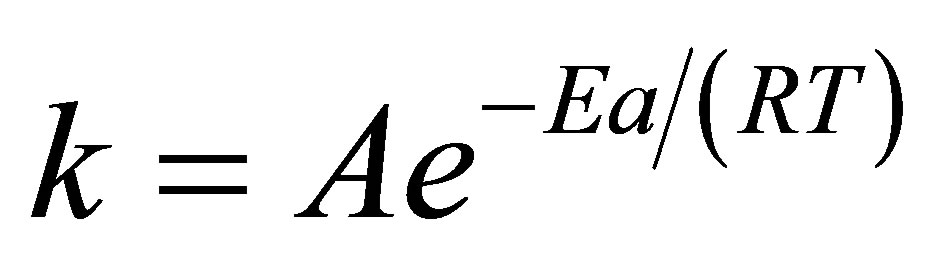
1) Arrhenius equation [9] (Equation (2)) in which k is the rate constant for the decomposition of the enzymesubstrate complex ES to product P.
 (1)
(1)
 (2)
(2)
where A is a constant known as the frequency factor (pre exponential coefficient), Ea is activation energy, R is gas constant and T is absolute temperature.
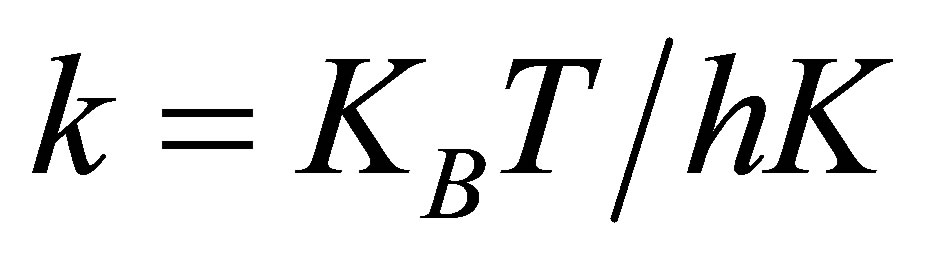
2) Eyring equation, the rate constant k for the decomposition of the complex ES, a non-stable intermediate
 (3)
(3)
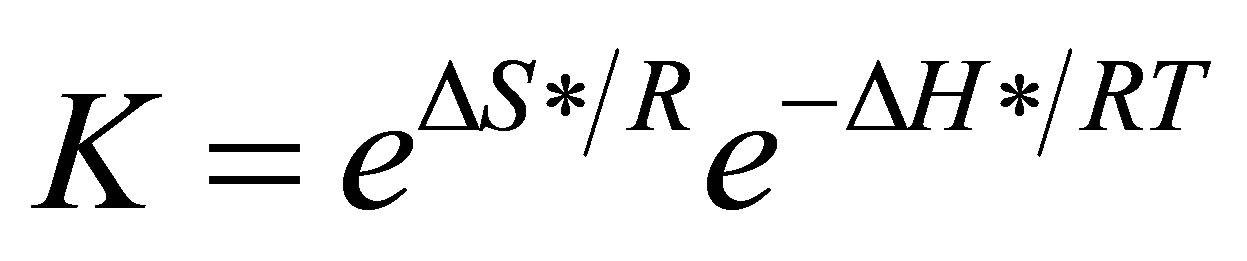
where KB is Boltsmann’s constant, h is planck’s constant, K is equilibrium constant of the first step and 3) Van’t Hoff’s equation [10], the equilibrium constant K.
 (4)
(4)
in which ΔS* is the change in entropy of activation and ΔH* is the change in enthalpy of activation.
Equating (2) and (3) gives
 (5)
(5)
Substituting Equation (4) into (5) gives
 (6)
(6)
As in a unimolecular reaction, when Δn = 0, there is no change in the number of moles; in solution there is also no appreciable change in volume, therefore
ΔH* = ΔE* with minimal error [7,11].
In the light of this, Equation (6) reduces to:
 (7)
(7)
That accounts for the frequency or pre-exponential factor, an important factor in enzyme reactions. Since the reaction takes place in solution, the rate of the reaction at unit concentration of the reactant is known as specific rate or rate constant. We will be able to evaluate the rate dependence on temperature by substituting the Gibb’s free energy equation.
 (8)
(8)
in equation (3) (the Eyring equation). Obtain
 (9)
(9)
From which a plot of Ink (observed rate constant) versus reciprocal of the absolute temperature 1/T, gives ΔH*/R as slope, and ΔS* from the intercept. When ΔH* and ΔS* are known, ΔG* can be calculated and finally, the equilibrium constant K.
In recent years, the cost of primary energy sources such as petroleum, gas and coal has astronomically increased [12]. The desire to harness other primary sources such as sugars from varying effluents which are viably recoverable and fermented to primary alcohols is regaining global interest. Primary alcohols can easily be blended with gasoline as gasohol or combusted directly to power piston engines [13]. Moreover there is growing concern about depleting reserves of fossil fuels as well as global concern for environmental degradation attributed to COx, SOx and NOx released when fossil fuels are combusted. Knowledge of the thermodynamics of the fermentation of sugar will unarguably enhance the understanding of the optimization of the process variables for the production of alcohols from renewable sources.
2. Materials and Methods
Sugarcane was purchased from Iruekpen market, Ekpoma (south-south, Nigeria). pH meter standardized with appropriate buffer solutions (buffer 4) and yeast (Saccharomyces cerevisiae) manufactured by Vahine professional, Mc cormick, France SAS were used as received.
2.1. Preparation of Canesugar Juice
The sugarcane was washed, peeled, chopped into bits or pieces and pounded in a mortar. The fibers were then manually removed by manually squeezing out the juice into sterilized aluminium can. The juice obtained was sterilized by heating in the aluminum can at a temperature of 90˚C for 40 minutes and then cooled. After cooling, 3000 cm3 of concentrated juice was obtained from 5.632 kg of cane. The juice was filtered and treated with a 3% Sodium metabisulphite, (Na2S2O5) to inhibit the growth of any undesirable type of microorganisms such as acetic acid bacteria, wild yeast and mould [14]. Thereafter the required quantity of juice was transferred into the fermentation vessels.
2.2. Experimental Procedure
The fermentation vessels were washed and later sterilized with a 3% solution of sodium metabisulphite for 5 minutes. 1000 cm3 of the juice was properly conditioned by sterilizing at 90˚C and was brought to the required pH with either 0.1 M HCl or 0.1 M NaOH. Seven polymeric vials containing substrate were prepared for each of seven sampling times at 30, 60, 90, 120, 150, 180, and 210 minutes. 1 g of yeast was added to each of the vial. The substrate and the yeast were properly mixed by shaking to allow for interaction for a period not less than 20 minutes. The samples were fermented in the sealed polymeric vial with connected tubes for the estimation of gas production. The escape of CO2 was prevented by sealing the air inlet with a cresol-perfumed jelly. The CO2 produced in each sealed vial was collected in water and measured by titration with 0.1 M NaOH, using phenolphthalein indicator.
2.2.1. Determination of Effect of Temperature
The effect of temperature on fermentation kinetics was determined by keeping other factors such as substrate concentration, pH of the juice, yeast concentration, and fermentation time constant. The temperature was varied between 30˚C - 42˚C, using a thermostated water bath.
2.2.2. Determinaton of Effect of Substrate Concentration
In determining the effect of substrate concentration on fermentation kinetics, all other factors such as temperature, pH, yeast concentration, and fermentation time were kept constant. The substrate concentration was varied at 20 - 80 (v/v %).
2.2.3. Determination of Rate of Fermentation
The rate of fermentation was measured as the volume of CO2 produced at 30 minutes’ interval of time.
3. Results and Discussion
In table 1, are shown the measured rates of fermentation of cane sugar with Saccharomyces cerevisiae at various substrate concentrations and temperature plotted in figure 1 as plot of substrate concentration against rate of fermentation. While in table 2, are shown the calculated thermodynamic parameters ΔH*, ΔE*, ΔS*, ΔG* and K, obtained from a plot of InK versus 1/T (figure 2) on the basis of Eyring’s equation. The result showed that the enthalpy value is positive, indicating that the fermentation process is endothermic; while the calculated value for the activation energy is the same as the enthalpy, as was stated earlier in this paper. The entropy value is positive corroborating the positive enthalpy value. The fermentation process is spontaneous as shown by the negative change in free energy. The equilibrium constant indicates that the conversion of substrate to products is 34%. In table 3 are shown the calculated values for k (rate constant), A (pre-exponential or frequency factor) and P (orientation parameter). The above results support the proposed two step mechanism of the enzyme catalyzed reaction. The value of the equilibrium constant indicates that though the enzyme catalyzed reaction is favoured kinetically, it is not particularly so thermo-dynamical. The enzymesubstrate complex is simply a non-isolable intermediate which though is an energized molecule, is thus present in low concentration and hence, the first step which is the
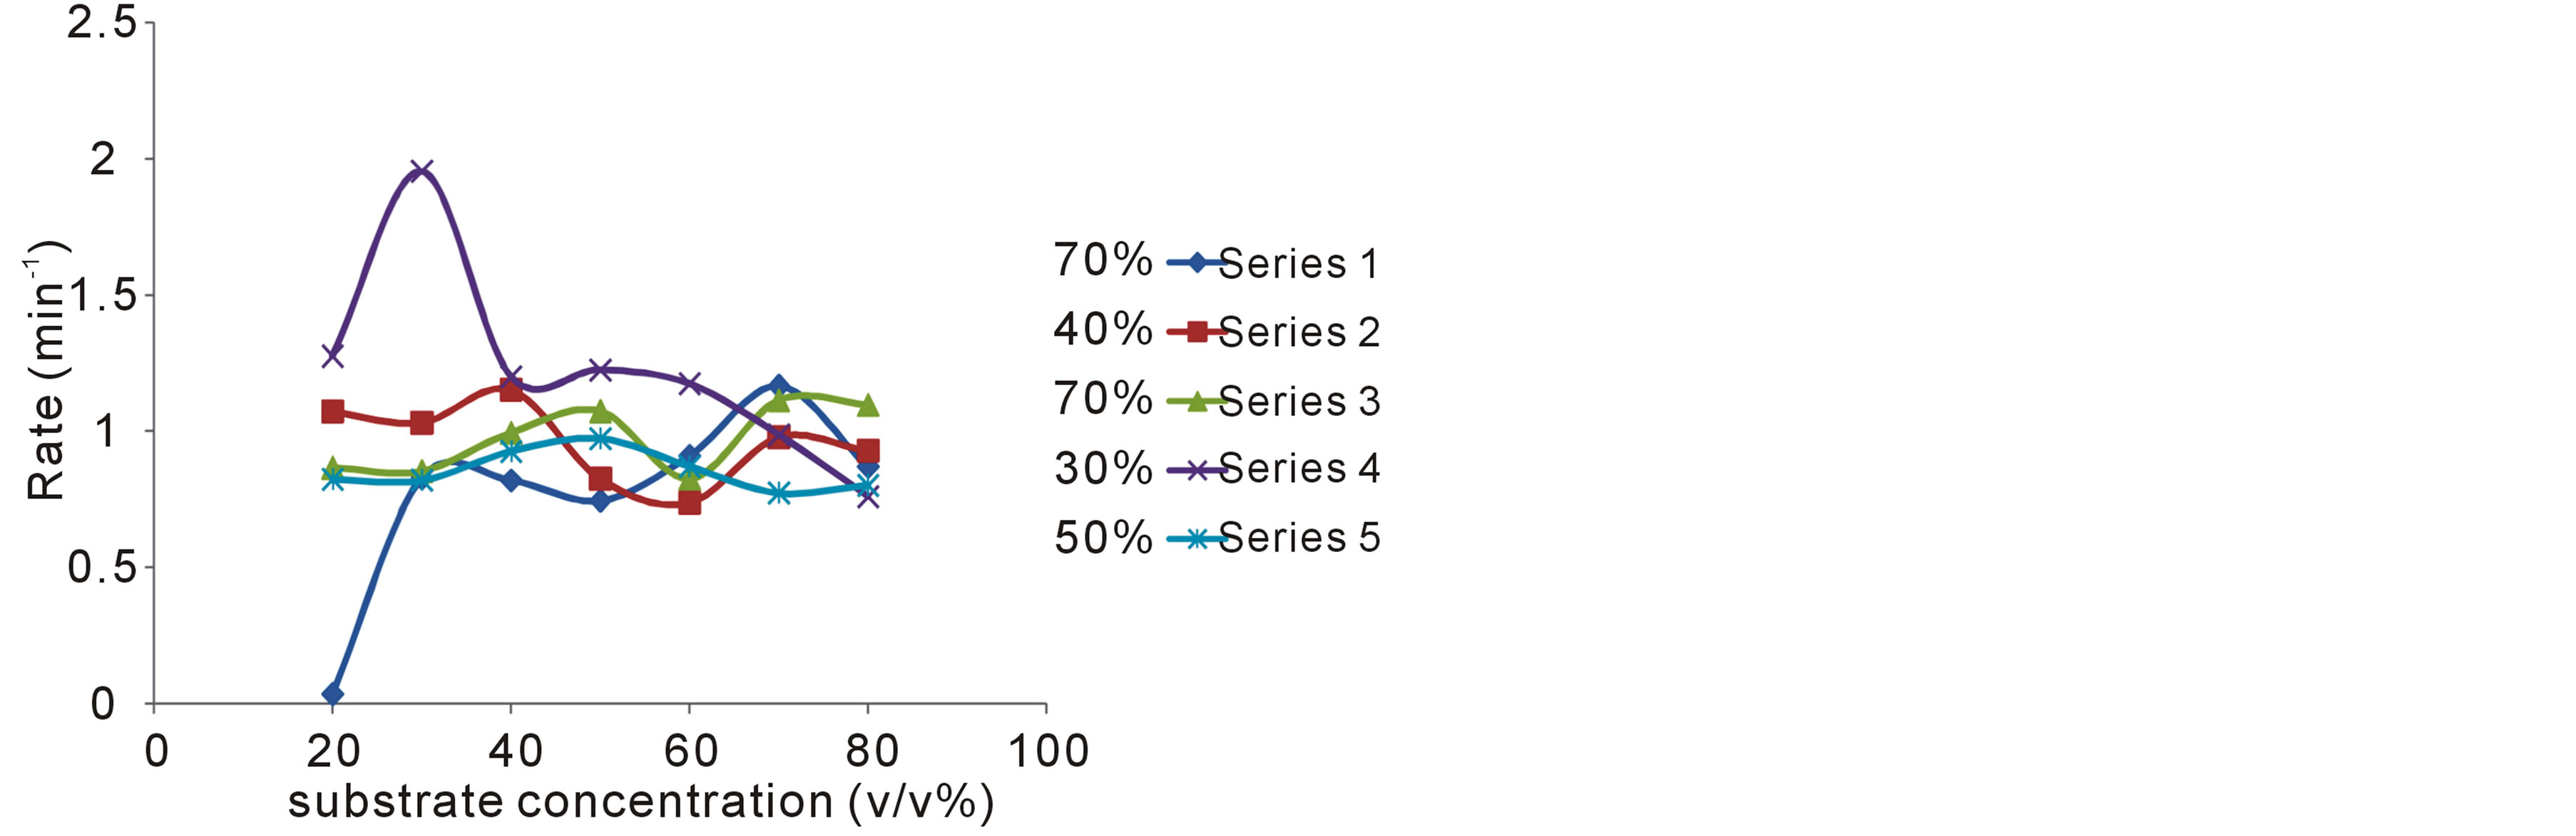
Figure 1. Variation of rate of fermentation with substrate concentration at various temperatures (pH 5.5); Yeast concentration 1.0 (w/v %).
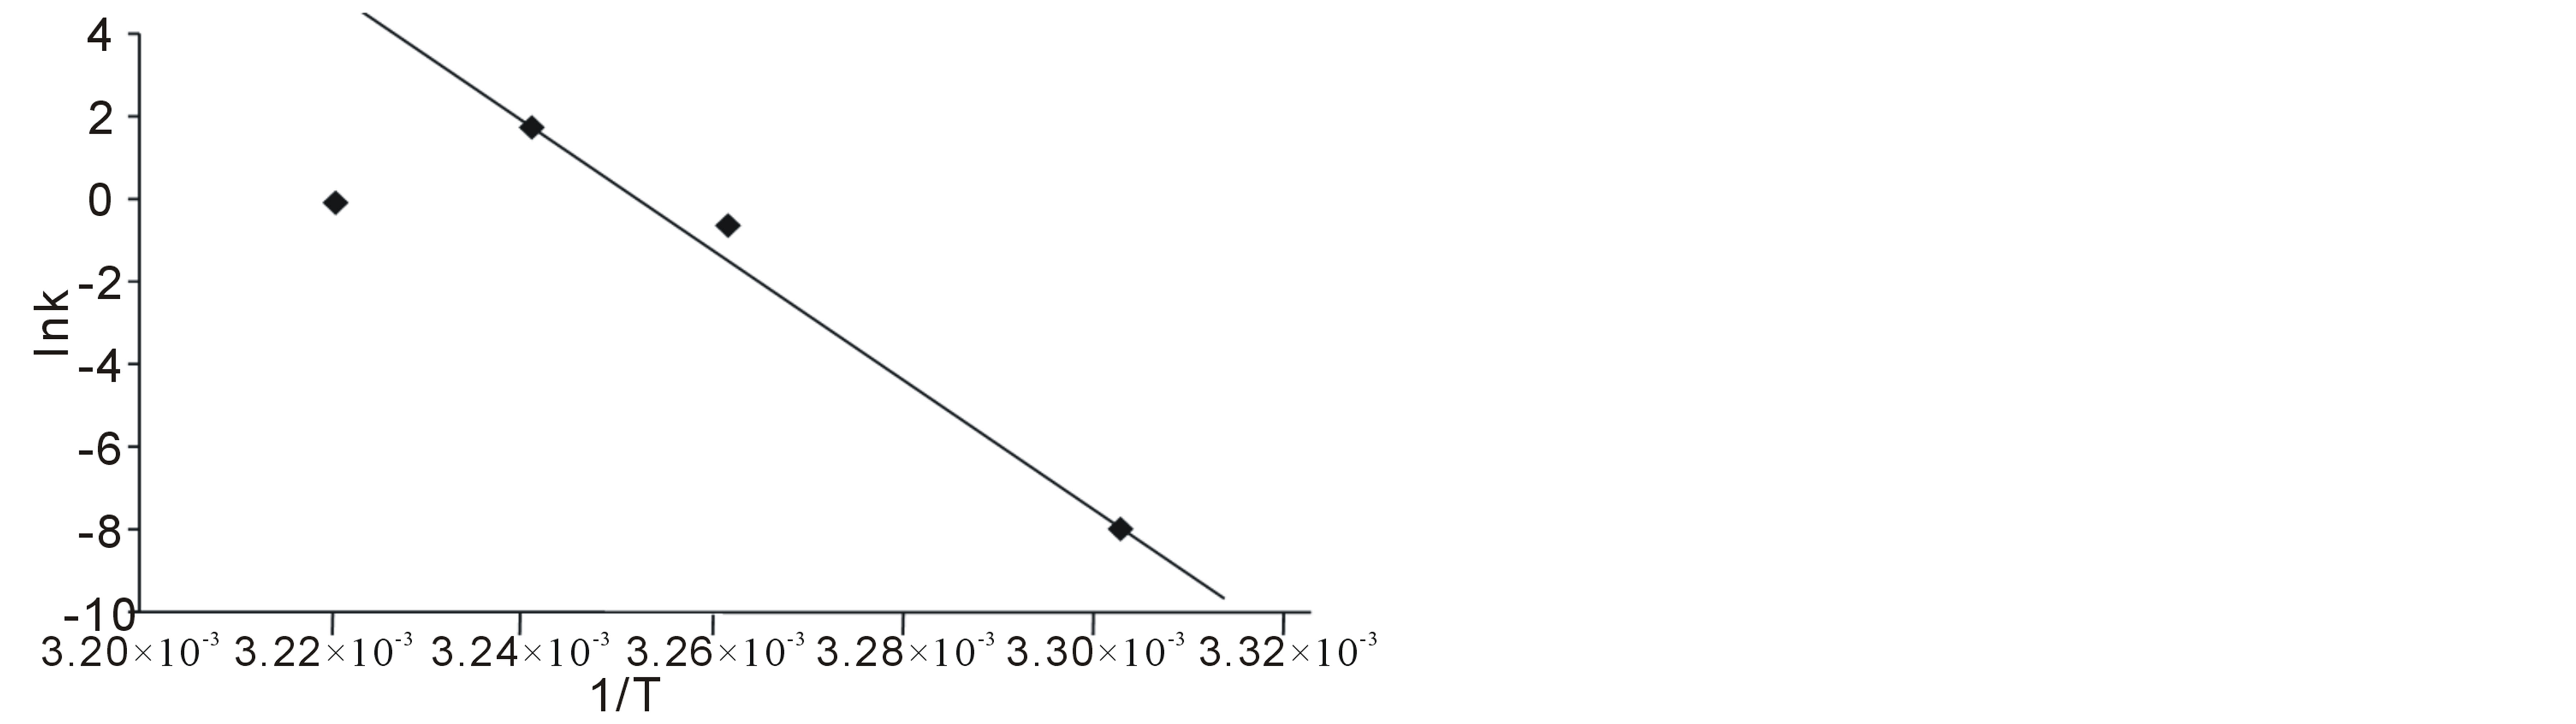
Figure 2. Plot of Ink versus 1/T for the Saccharomyces cerevisiae catalyzed fermentation of cane sugar.
equilibrium step can be quantified by the Eyring and Vant Hoff’s isotherms; while the second or decomposition step is adequately quantified by a combination of the Arrhenius, Eyring and Van’t Hoff’s isotherms. The data shown in table 2 are within the range of data obtained by biochemical microcalorimetry for glucose sugar [1]. The calculated A and P values obtained on the basis of collision theory and absolute reaction rate theory (or transition state theory) respectively showed that the collision factor is of the order of 1011 min−1, about half that of gaseous molecules that can only be attained by an induced reduction in activation energy by a catalyst. The frequency factor A, in the Arrhenius equation is approximately equal to KBT/h e∆S*/R of the absolute reaction rate theory and the Van’t Hoff’s equation. Therefore the enzyme provides a favourable kinetic environment and of course does this by providing a well, proper-fitting orientation for the substrate molecules to undergo the change. However in doing so, the thermodynamics is limited by other process variables such as concentration of the substrate, the purity and activity of the enzyme molecules as well as product inhibition [15,16]. And this fact invariably influenced the yield of product in practice. Therefore the enzyme provides a favourable kinetic environment for submicroscopic interactions of the enzyme
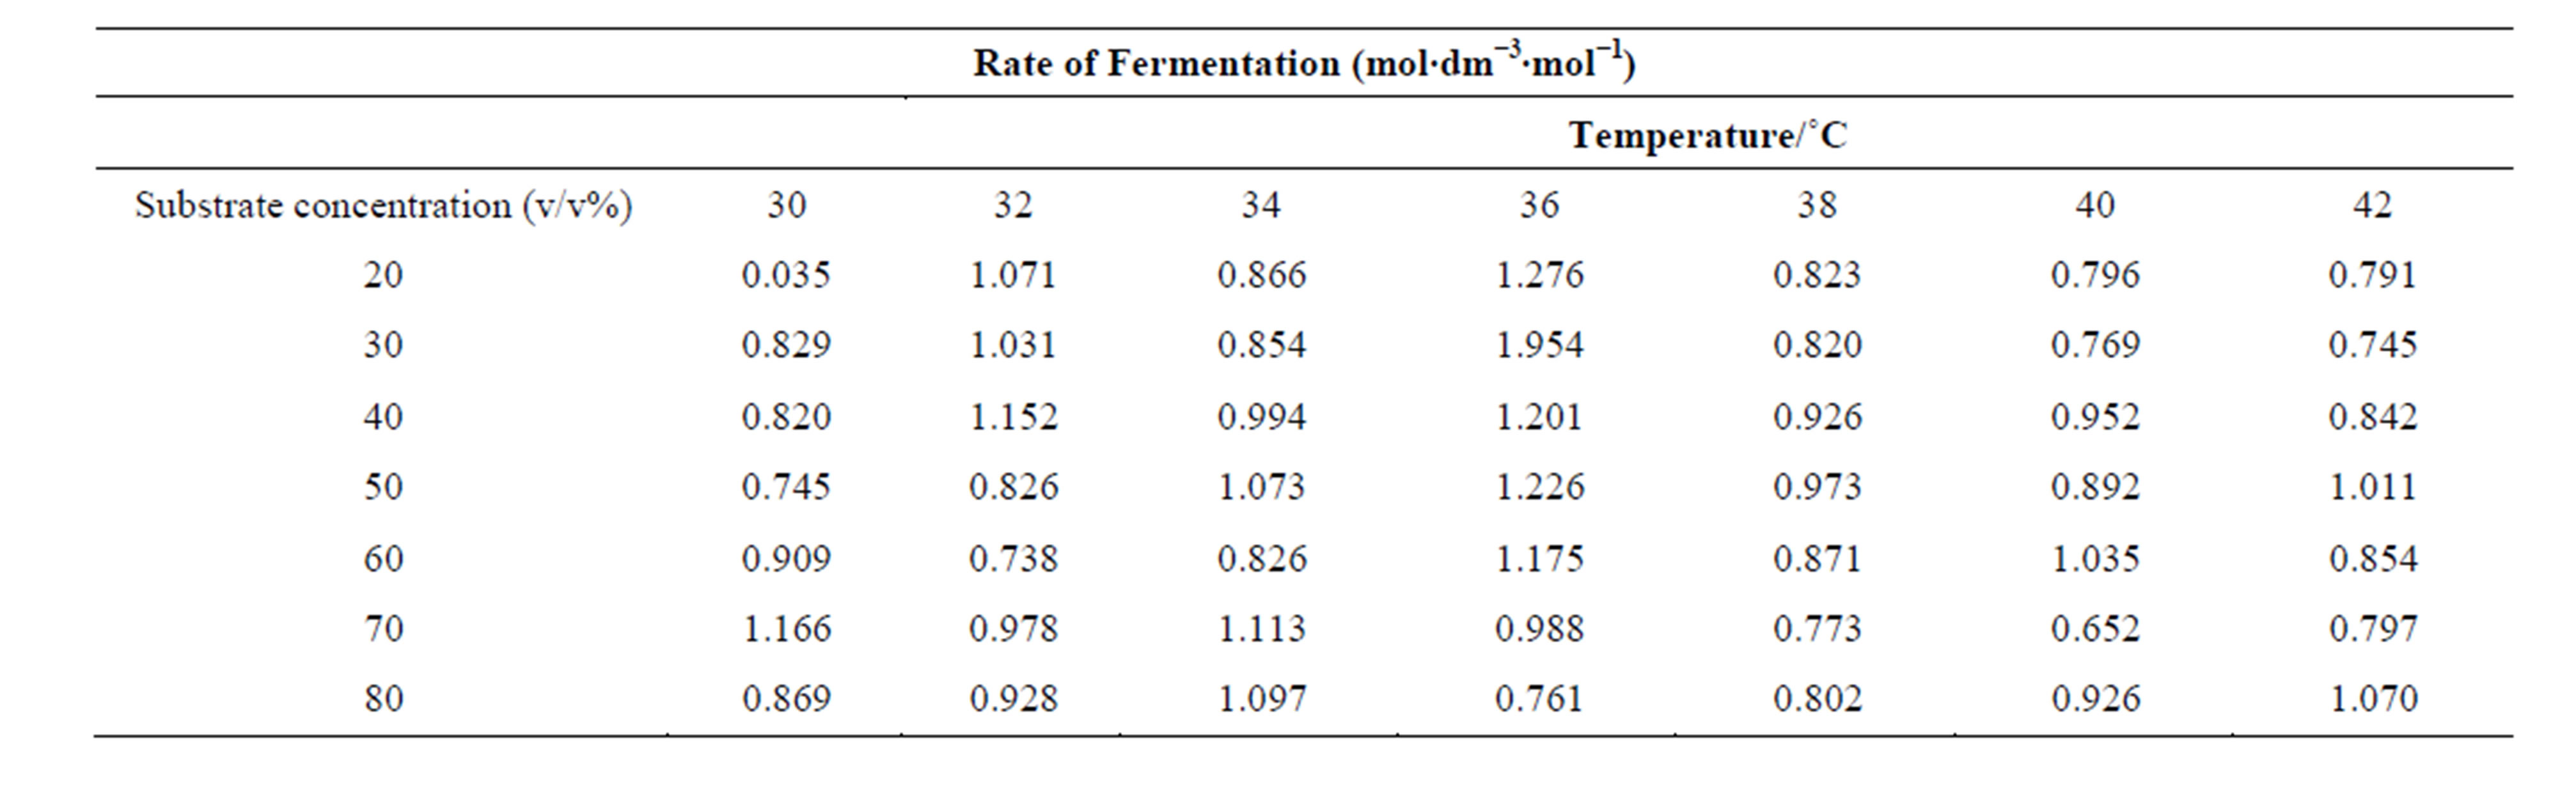
Table 1. Data on the rate of fermentation of cane sugar catalyzed by Saccaromyces cerevisiae at pH 5.5 and 1.0 w/v % yeast concentration at various substrate concentrations and temperatures.
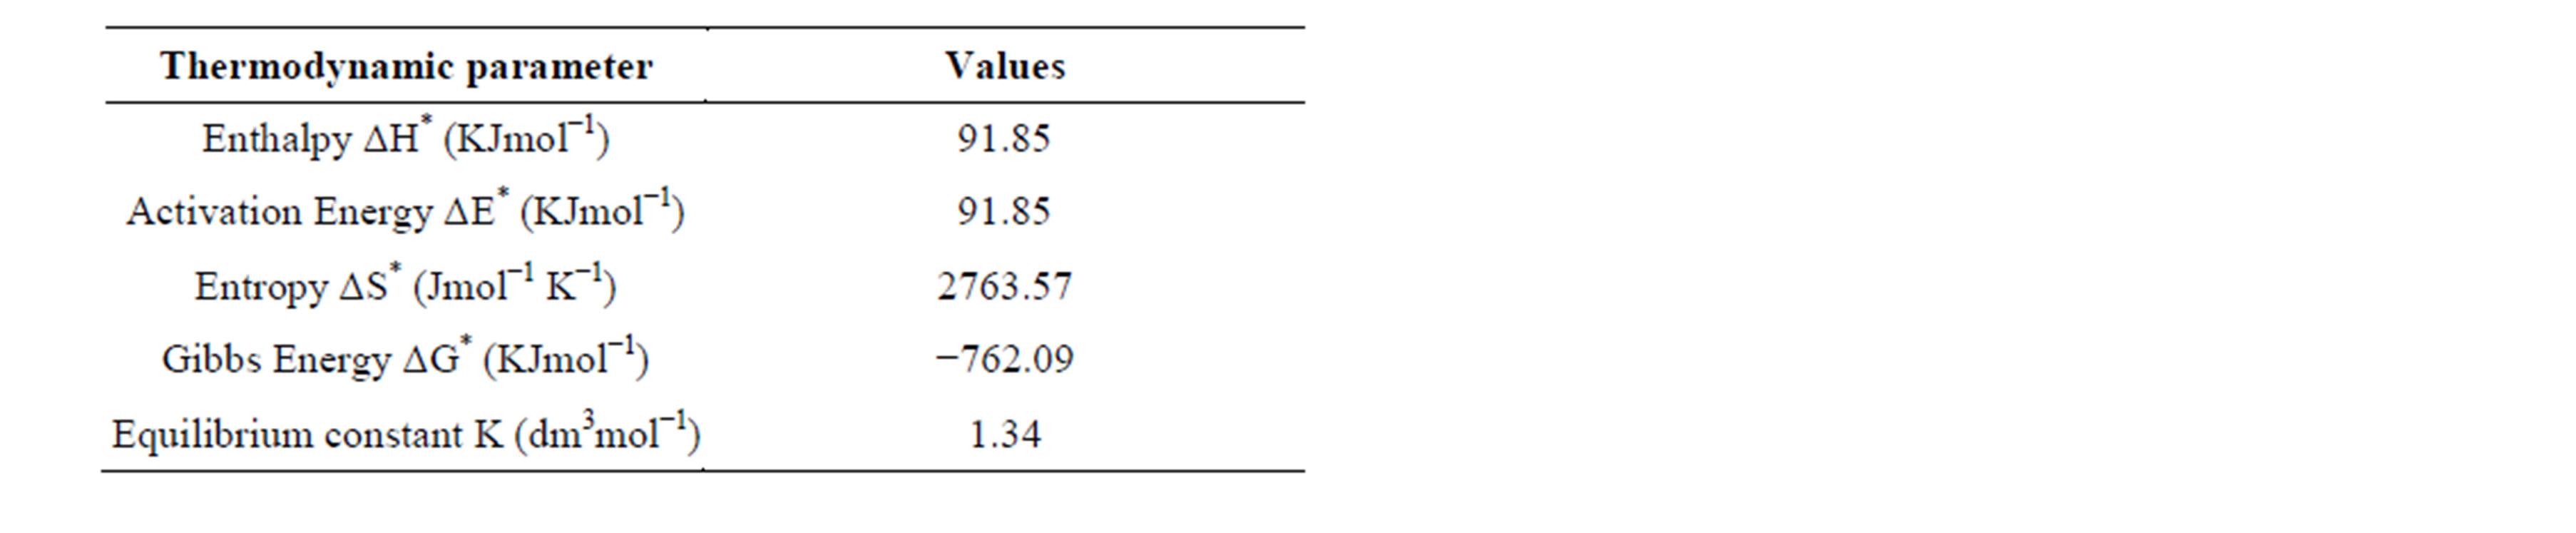
Table 2. Thermodynamic parameters calculated for the Saccharomyces cerevisiae catalyzed fermentation of cane sugar.
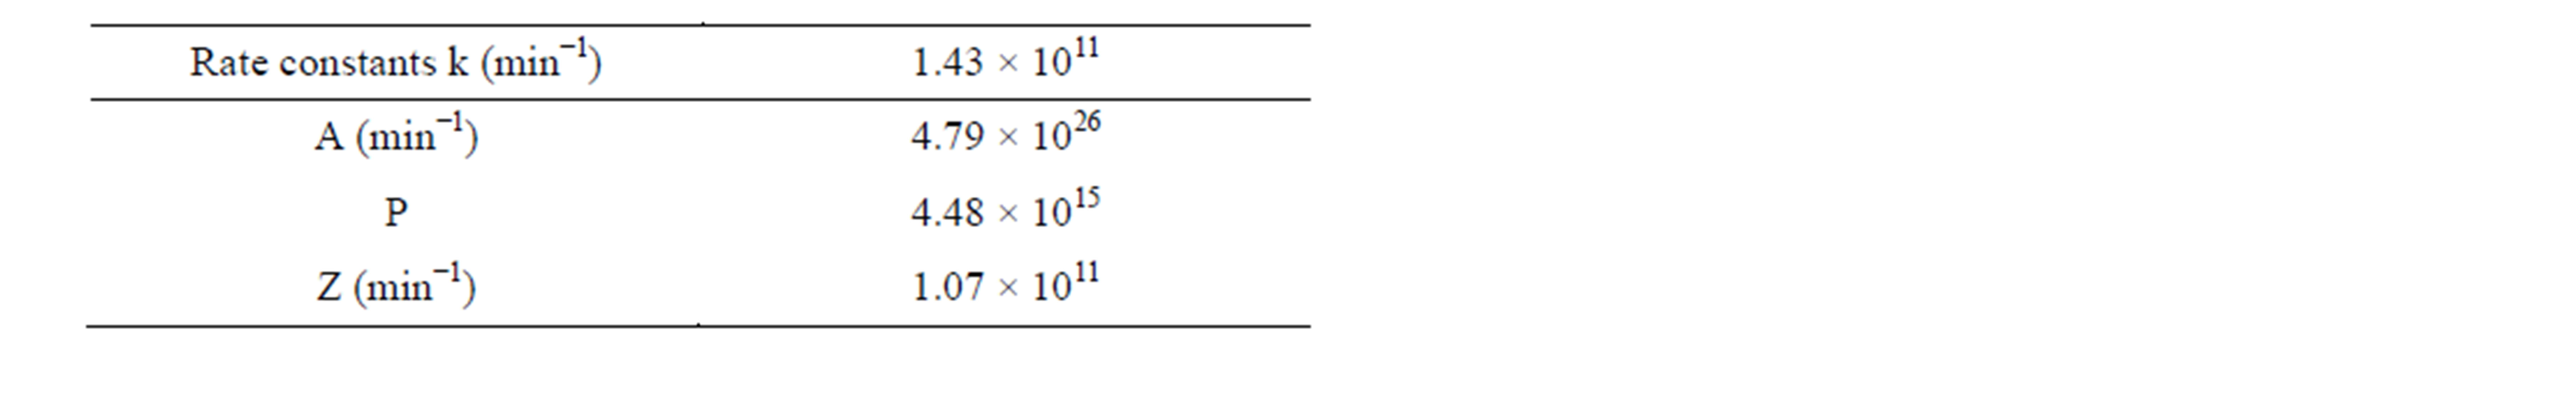
Table 3. Calculated constants for the Saccharomyces cerevisiae catalyzed fermentation of cane sugar.
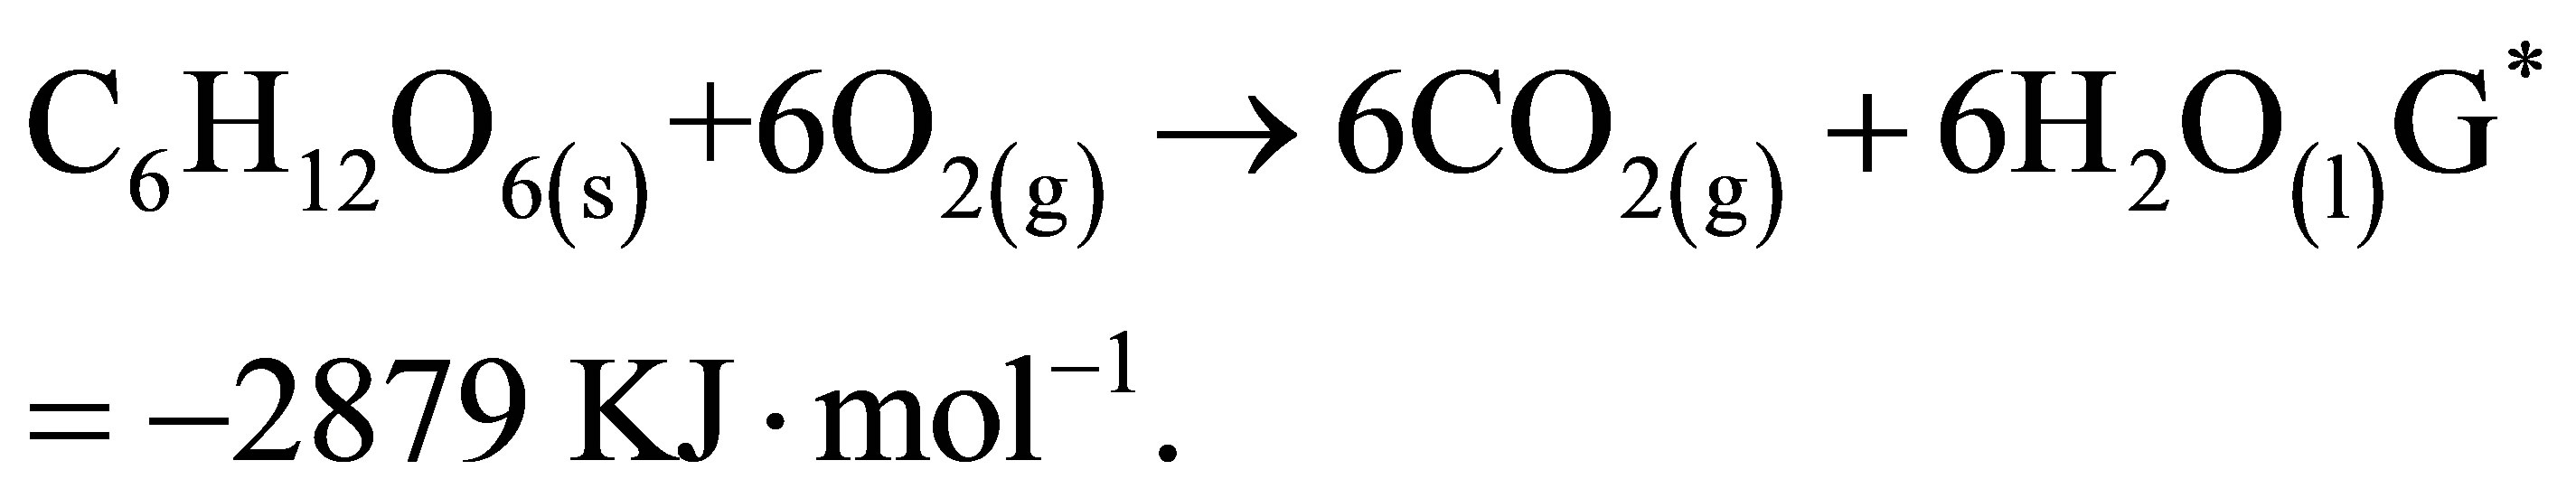
substrate complex and such interaction could be substrate interacting more with the complex or rather the product which is interacting more with the intermediate complex. The equilibrium constant value K suggests that the intermediate complex is rather interacting more with the substrate and showed that only a limited amount of the substrate is converted to product. The fraction of effective intermolecular collision increases with increase in the total number of collisions and hence the rate of reaction is proportional to the collision frequency as seen in table 3. The P (orientation factor) value affects the interaction between substrate and enzyme. The enzyme activates the substrate molecules at particular active sites. These sites have definite size and shape or configuration. Reaction will proceed only if the size, stereochemistry and orientation of the substrate molecules fit into the active sites of the enzyme. The value of P in table 3 showed that the orientation of molecules affects the probability factor and that simple molecules indeed have more ways of proper orientation to form complex intermediates. Hence the probability factor is of the order for simple molecules [17,18]. For simple sugars like glucose, the orientation factor is expected to be large and hence the P value obtained in table 3. The equilibrium constant K is observed to be 1.34 dm3∙mol−1 and not significantly far from unity implies that ΔG* can be conveniently equated with the change in free energy at standard conditions. The equilibrium constant value support the fact that the unstable intermediate as is this case is interacting more with the substrate and in such a given situation, the yield of product should not be expected to be large. This explains partly why the yield of alcohol from most fermentable starches and sugars are low. It is of interest frequently to estimate the efficiency of a fermentation process [19] by a consideration of the free energy of combustion of glucose:
On the other hand, the fermentation of sugar syrup from cane to alcohol:

in this investigation gave ∆G* = −762 KJ mol−1. Therefore, calculated fermentation efficiency is
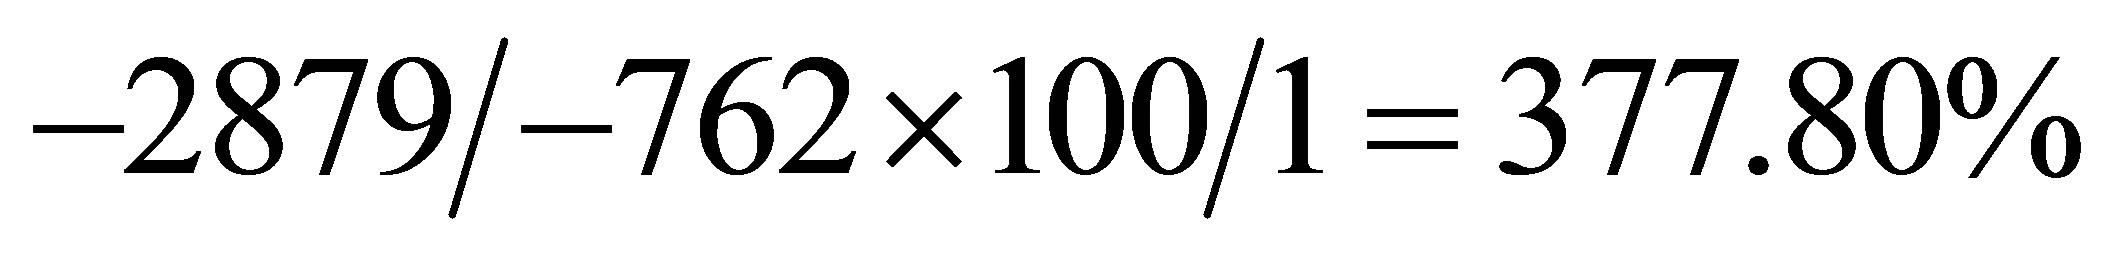 .
.
The high efficiency of the process is suggested to be promoted by a high P value and a suitable kinetics.
4. Conclusion
Though the value of the fermentation efficiency of the process is impressive, the measured rates support the fact that the process is kinetically controlled the expected positive impact of the thermodynamics which is suggestively limited by other process variables.
REFERENCES
- R. Chang, “Physical Chemistry with Applications to Biological Systems,” Macmillan, New York, 1990, pp. 251- 253.
- R. D. Levine, “Molecular Reaction Dynamics,” Cambridge Univ. Press, London, 2005, pp. 78-82. http://dx.doi.org/10.1017/CBO9780511614125
- I. Haq, M. M. Javid, U. Hamid and F. Adnan, “Kinetic and Thermodynamic Studies of Alpha Amylose from Bacillus Licheniformic Mutant, Park,” Journal of Botany, Vol. 42, No. 5, 2010, pp. 3507-3516.
- C. Duy and J. Fitter, “Thermostability and Irreversible Unfolding Amylases Analyzed by Unfolding Kinetics,” Journal of Biological Chemistry, Vol. 280, No. 45, 2005, pp. 37360-37365. http://dx.doi.org/10.1074/jbc.M507530200
- R. Eisenthal, M. J. Danson and D.W. Hough, “Catalytic Efficiency and Kcat/Km: A Useful Comparator?” Trends in Biotechnology, Vol. 25, No. 6, 2007, pp. 247-249. http://dx.doi.org/10.1016/j.tibtech.2007.03.010
- H. Eyring, “The Activated Complex in Chemical Reactions,” The Journal of Chemical Physics, Vol. 3, No. 2, 1935, p. 107.
- A. S. Negi and S. C. Anand, “A Textbook of Physical Chemistry,” New Age Publiishing, New Delhi, 2007, pp. 714-718.
- C. Blanch and R. Clark, “The Effect of Temperature and pH on Enzyme Kinetics,” In: C.-W. Park and E. Zipp, Eds., Introduction to Biochemical Engineering, Harwood, London, 2000, 1997, pp. 120-125.
- S. Arrhenius, In: E. L. Gaden, Ed., Fermentation Process Kinetics, Biotechnology and Bioengineering, Vol. 67, No. 6, 1889, pp. 116-118.
- J. H. Van’t Hoff, In: P. Atkins and J. De Paula, Eds., Physical Chemistry, 8th Edition, Freeman & c. New York, 2006, p. 212.
- K. J. Laidler and M. C. King, “The Development of Transistion State Theory,” Journal of Physical Chemistry, Vol. 87, No. 15, 1983, pp. 2657-2664. http://dx.doi.org/10.1021/j100238a002
- L. R. Lynd, J. H. Cushman, R. J. Nicholas and C. E. Wyman, “Fuel Ethanol from Cellulosic Biomass,” Science, Vol. 251, No. 4999, 1991, pp. 1318-1323. http://dx.doi.org/10.1126/science.251.4999.1318
- J. B. Doran, H. C. Aldrich and L. O. Ingram, “Sacharification and Fermentation of Sugar Cane Bagasse by Klebsiella Oxytoca Containing Chromosomally Integrated Genes Encoding the Zymomonas Mobilis Ethanol Pathway,” Biotechnology and Bioengineering, Vol. 44, No. 2, 1994, pp. 240-247. http://dx.doi.org/10.1002/bit.260440213
- R. A. Copeland, “Enzymes: A Practical Introduction to Structure and Mechanism and Data Analysis,” 2nd Edition, Wiley VCH, New York, 2000, pp. 78-84. http://dx.doi.org/10.1002/0471220639
- M. Riaz, R. Parveen, M. R. Javed, H. Nadeem and M. H. Rashi, “Kinetics and Thermodynamic Properties of Noval Glucoamylase from Humicola sp. Enzyme,” Microbial Technology, Vol. 41, No. 5, 2007, pp. 558-564. http://dx.doi.org/10.1016/j.enzmictec.2007.05.010
- A. Tanaka and E. Hoshino, “Secondary Calcium Binding Parameter of Bacillus Amyloliquefacions Amylase Obtained from Inhibition Kinetics,” Journal of Biosciences and Bioengineering, Vol. 96, No. 3, 2003, pp. 262-268.
- J. J. Malinowski, “Two Phase Partitioning Bioreactors in Fermentation Technology,” Biotechnol Advances, Vol. 19, No. 7, 2001, pp. 525-538. http://dx.doi.org/10.1016/S0734-9750(01)00080-5
- Y. A. Pisarenko, L. A. Serafimov, C. A. Cardona, O. E. Efromov and A. S. Schuwalov, “Reactive Distillation Design: Analysis of the Process Design,” Review in Chemical Engineering, Vol. 17, No. 4, 2001, p. 253. http://dx.doi.org/10.1515/REVCE.2001.17.4.253
- N. Leksawasdi, L. A. Joachimsthal and P. L. Rogers, “Mathematical Modeling of Ethanol Production from Glucose/Xylose Mixtures by Recombinant Zymomonas Mowbilis,” Biotechnology Letters, Vol. 23, No. 13, 2001, pp. 1087-1093. http://dx.doi.org/10.1023/A:1010599530577
NOTES
*Corresponding author.