Open Journal of Physical Chemistry
Vol. 2 No. 1 (2012) , Article ID: 17535 , 11 pages DOI:10.4236/ojpc.2012.21004
Utilization of Special Potential Scan Programs for Cyclic Voltammetric Development of Different Nickel Oxide-Hydroxide Species on Ni Based Electrodes
Departamento de Química, Universidad Nacional de Río Cuarto, Río Cuarto, Argentina
Email: *juanmmarioli@gmail.com
Received July 21, 2011; revised September 24, 2011; accepted November 1, 2011
Keywords: Nickel; Nickel-Chromium Alloy; Oxides; Cyclic Voltammetry
ABSTRACT
Special potential scan programs were designed for cyclic voltammetric development of β-NiOOH or γ-NiOOH/ β-NiOOH mixtures on the surface of nickel or nickel-chromium (80:20) alloy electrodes in NaOH 0.10 M. The programs consisted on changing the anodic or cathodic switching limit to facilitate the chemical reactions taking place either between Ni(II) hydroxides or between Ni(III) oxides-hydroxides. The electrochemical charge density under the oxidative wave, observed at Ni or Ni-Cr electrode surfaces at approximately 0.48 V (vs SCE), remained almost constant with the number of cv cycles after approximately 600 cv cycles at 0.050 V/s. Thus, it can be suggested that a stable proportion of Ni(II)/Ni(III) oxides-hydroxides was obtained on the electrode surfaces. The relative amounts of β-NiOOH or γ-NiOOH species were calculated from the electrochemical charges under their reduction waves in the voltammetric experiments. Higher charge densities were always obtained with Ni-Cr alloy electrodes as compared to pure Ni electrodes. Linear relationships were obtained in our study on the dependence of the oxidative peak current with the square root of the scan rate at a scan rate range between 0.01 V/s and 0.16 V/s.
1. Introduction
Since the 1970s, the oxidation of organic compounds on nickel electrodes in alkaline solutions has been extensively investigated [1,2]. Recently, nickel hydroxide electrodes have shown good electrocatalytic properties for the oxidation of aspirin [3], methane [4], and acetylcholine [5]. The nickel electrode exhibit catalytic activity in the oxidation of a wide variety of organic compounds in alkaline solutions. The Ni(III) species is generated on the electrode surface at potentials in the region 0f 0.4 V to 0.5 V vs Ag/AgCl. The reactions are [6-11] (and references therein):
 (1)
(1)
 (2)
(2)
 (3)
(3)
 (4)
(4)
Reaction (1) represents the oxidation of Ni(0) to Ni(II) in alkaline solutions, which occurs at approximately −0.8 V (vs Saturated Calomel Electrode, SCE). Reaction (2) represents the reversible oxidation of Ni(II) to Ni(III), which is observed at nearly 0.4 V to 0.6 V vs SCE. Reaction (3) stands for the electrocatalytic oxidation of an analyte to regenerate Ni(II) species and to produce a radical, which is further oxidized to products (Reaction 4). Taking into account that electrocatalytic processes depend on the ability of the electroactive molecules to interact with the electrode [12], it is then important to understand as far as possible the electrochemistry of the electrode surface itself.
An advance in the understanding of the reactions of the nickel hydroxide electrode was made by Bode [13], who established the existence of two forms of Ni(OH)2 and two forms of NiOOH. According to Bode et al., electrochemical reactions of the Ni(OH)2/NiOOH electrode can be summarized as in Scheme 1.
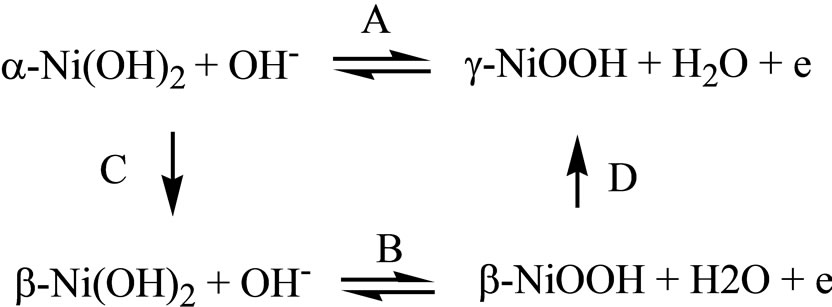
Scheme 1. Pathways A and B represent one electron electrochemical reactions, and pathways C and D represent chemical reactions; the arrows represent the most probable reaction path.
It is well known that the alloying of some metals can markedly lower their corrosion rate. As regards nickel, it has been suggested that its corrosion resistance is considerably improved by alloying it with chromium [14-16]. A two-layer structure, with an inner oxide part formed directly at the metal surface and an outer hydroxide part in contact with the electrolyte, was proposed for Ni-Cr alloys in 1 M NaOH solutions as deduced from X-Ray photoelectron spectroscopic examinations of the electrochemically formed passive layers. The oxide layer consisted mainly of Cr2O3 and NiO entered only in the transpassive potential range. Moreover, it was suggested that Ni is enriched at the metal surface and it forms the outer hydroxide layer in contact with 1 M NaOH, especially at positive potentials and for long passivation times. Some soluble Cr(VI) was found within the hydroxide layer. However, due to the low solubility of Ni(OH)2 in alkaline solutions, it has been suggested that Cr(VI) may be trapped within the hydroxide layer [16]. Above the passivation potential, Ni(III) species also accumulated within the passive layer, behaving as dopants and causing a shift of the Fermi level to lower energy.
We reported earlier that nickel-chromium alloys were good electrode materials for the electrochemical detection of molecules after HPLC separations using alkaline mobile phases [6,7,17]. It was observed that in alkaline solutions the Ni-Cr (80:20) alloy had a cyclic voltammetric (cv) response in the potential range from 0.00 V to 0.60 V (vs SCE) similar to that of a pure Ni electrode [18]. It was also reported there that the α, β and γ crystallographic forms of Ni oxides-hydroxides found at pure Ni electrodes were also present in the Ni-Cr (80:20) alloy electrode. However, the electrochemical charge density and peak current of the oxidative wave obtained at approximately 0.48 V (vs SCE) at the Ni-Cr alloy electrode were always higher than those obtained at pure Ni electrodes under similar experimental conditions. Thus, we considered it important to find the perturbation conditions under which the Ni(OH)2/NiOOH species present at the Ni-Cr working electrodes may invariably be observed in a stable proportion. These perturbation conditions will allow us to begin surface studies to compare the oxides-hydroxides obtained at Ni or Ni-Cr alloy electrodes under similar potentiodynamic perturbations.
In this study, we developed a cyclic voltammetric procedure to obtain β-NiOOH or γ-NiOOH/β-NiOOH mixtures on Ni or Ni-Cr (80:20) alloy electrodes surfaces. The quantification of each NiOOH species was performed by fitting the cv response of the reverse scan with Lorentzian functions. This procedure allowed us to evaluate the effect of the working electrode perturbation waveform on the production of different nickel oxidehydroxide species. The number of cv cycles needed to obtain a steady voltammogram (indicating that the oxide layer on the electrode did not grow noticeably) was also assessed. Finally, we studied the effect of the potential scan rate on the electrode response. Linear relation between the anodic peak current and the square root of the scan rate were studied and it was stated that the global electrode process is controlled by diffusion. The cyclic voltammetric electrode conditioning reported here allows obtaining a stable proportion of oxides-hydroxides on the surface of nickel or nickel-chromium alloys. This condition is important to begin with surface analysis experiments of nickel and nickel-chromium alloy electrodes.
2. Experimental
2.1. Electrode Preparation and Software
Working electrodes were made of Ni (Goodfellow, England, 99.99+%), or Ni-Cr (80:20) (Goodfellow, England, catalog number NI055150) wires of 0.10 cm diameter embedded in Teflon® shrinkable tubes (See Scheme 2). The metallic wire (approximately 10 cm long) was introduced into the Teflon® shrinkable tube (9 cm long), so nearly 1 cm was used for electric contact. This assembly was transferred to an electrical oven at approximately 300˚C until a complete shrinkage of the Teflon® tube was observed. The electrodes were polished with sand paper and then with fine alumina down to 0.05 µm, rinsed with triply distilled water, sonicated during 5 minutes, rinsed again with triply distilled water and immersed in the electrochemical cell. The exposed geometrical area obtained after polishing was ca. 7.8 × 10⁻³ cm2. Before cv experiments, –1.00 V was applied to the working electrodes for about 60 seconds in order to minimize oxides formation. A platinum foil of a large area (ca. 0.8 cm2) was used as the counter electrode. All potentials were measured with reference to the Saturated Calomel Electrode (SCE). The SCE was held in a separate compartment of the electrochemical cell finishing in a Luggin capillary.
The electrochemical cell was a conventional twocompartment glass cell. Autolab models PGSTAT-30 or PGSTSAT-12 potentiostats were used to control the potential between the working and reference electrodes. The potentiostats were controlled by PC compatible computers using the PGSTAT software version 4.9. Graphics were obtained with a conventional printer. The temperature of the electrochemical cell was kept at 25.5˚C ± 0.2˚C.
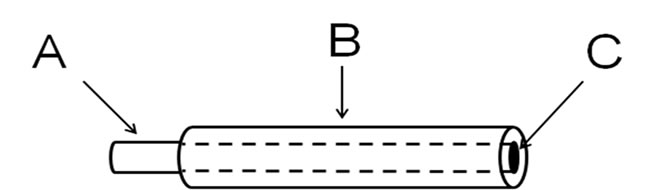
Scheme 2. Working electrode details. A: metal wire (either Ni or Ni-Cr); B: Teflon® shrinkable tube; C: circular exposed area of the electrode.
To facilitate the growth of each crystallographic form of NiOOH, two working electrode perturbation waveforms (Figure 1) were developed. The working electrode potential was swept over the potential range from 0.00 V to 0.60 V during 5 cv cycles, then a smaller potential range (0.50 V) was swept during 10 cv cycles, and finally an even smaller potential range (0.40 V) was swept during the remaining cv cycles. Thus, by shifting the smallest potential sweep range either in the anodic or in the cathodic direction (see Figure 1, panels A and B, from now on treatment A and treatment B, respectively), we were able to grow the crystallographic forms of NiOOH. The underlying principle of these waveforms was that the oxidized species remained in their oxidized form for a longer time by shifting the smallest potential sweep range toward the anodic direction, thus favoring the chemical reaction β-NiOOH à γ-NiOOH (reaction D in Scheme 1). On the other hand, reaction C could be favored by shifting the smallest potential sweep range toward the cathodic direction, where reduced species remained longer times. Thus, treatment A allowed us to obtain an electrode surface with almost even quantities of β-NiOOH and γ-NiOOH, while treatment B allowed us to obtain preferentially β-NiOOH. These results were obtained either with Ni or Ni-Cr alloy electrodes (See Figure 1).
The fitting of the voltammetric traces was performed by using Origin 6.0 built-in Lorentzian function:
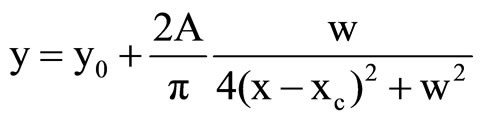 (5)
(5)
where y0 is the offset, xc is the function center (peak potential in our case), w the width of the wave, and A represents the area under the curve.
2.2. Preparation of Chemicals
Sodium hydroxide solutions were prepared with triply distilled degassed water and analytical grade reagents (Merck, Argentina). They were standardized with potassium hydrogen phthalate (Merck, Argentina). The solutions were degassed by bubbling high purity N2 prior to electrochemical experiments. Contact with atmospheric CO2 was minimized by maintaining N2 over the solutions during the electrochemical experiments.
3. Results and Discussion
In a previous study using Ni-Cr (80:20) alloy electrodes, we showed that the voltammetric behavior of the alloy in the potential range from –1.10 V to 0.00 V (vs SCE) in 0.10 M NaOH solution was similar to that of pure Ni electrodes in the same electrolyte [18]. The presence of chromium in the electrode was only noticeable on the i/E voltammetric response during the first few cv scans
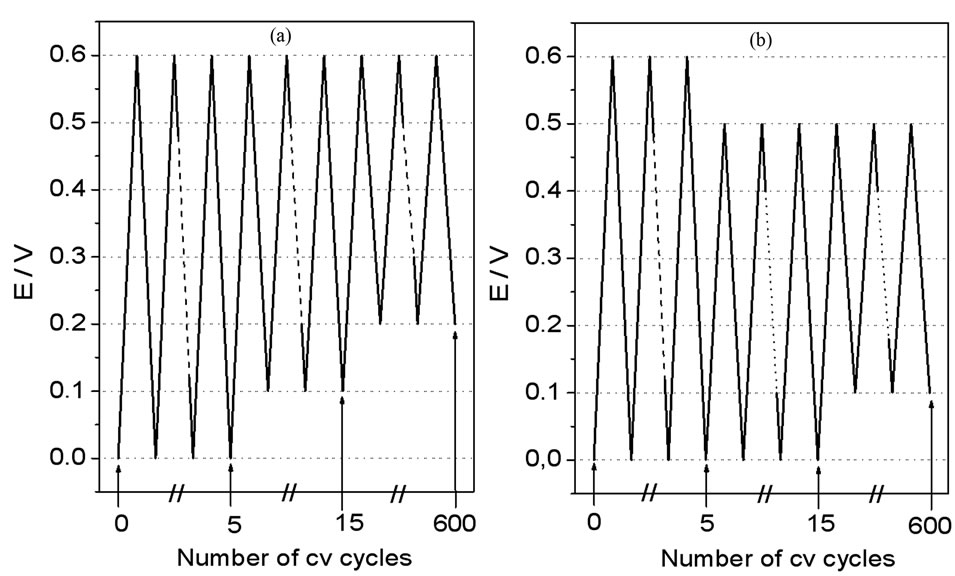
Figure 1. Potential-time programs used as working electrode perturbation waveforms for oxide growth at Ni and Ni-Cr alloy electrode in 0.10 M NaOH. (a) Waveforms used to grow g-NiOOH and β-NiOOH; (b) Waveforms used to grow preferentially β-NiOOH.
starting at –1.0 V (vs ECS) [16]. Similar results were found by other authors in X-rays photoelectron spectroscopy (XPS) examinations of the electrochemically formed passive layers on Ni-Cr alloys [16]. They found that the XPS analysis of the passive layer formed at a potential range from –1.0 V to 0.0 V showed that Ni(II) and Cr(III) oxides and hydroxides were developed. An increase of the hydroxide and the oxide part of the XPS signal and a related decrease of the metal contribution was found when the passivation potential was higher than –0.5 V. We have found that no significant currents were observed on the voltammetric i/E traces after continuous cycling of the Ni-Cr electrode at the potential range from –1.0 V to 0.0 V in 0.1 M NaOH [18].
Ni(III) species are only formed at potentials above 0.0 V (vs SCE) [19]. The presence of NiOOH on the electrode surface is important for the electrocatalysis of organic molecules. Thus, the characterization of the electrochemical behavior of Ni and Ni-Cr alloy electrodes in alkaline solution at the potential range between 0.0 V and 0.6 V is of crucial importance for understanding the mechanism of electro-oxidation of organic molecules. In the following section, we show the results of a systematic study of the voltammetric behavior of Ni and Ni-Cr alloys in 0.10 M NaOH.
3.1. Voltammetric Response of Nickel and Nickel-Chromium Electrodes at the Potential Range from 0.00 V to 0.60 V
Figure 2 shows the i/E trace obtained with Ni and Ni-Cr alloy electrodes after different numbers of cv scans at a potential range between 0.00 V and 0.60 V in 0.10 M NaOH. An oxidative wave (peak I) was observed at the potential range between 0.40 V and 0.50 V at either Ni or Ni-Cr electrodes (Figure 2) during the positive going potential scan. This oxidative wave was ascribed [18,20] to the oxidation of Ni(OH)2 to NiOOH, as represented in electrochemical steps A and B in Scheme 1. A reductive wave (peak II) was observed at a potential range from 0.35 V to 0.45 V during the negative going potential scan. This wave may be complementary to the anodic one (Equation (1)). We identified this reductive wave as due to the reduction of β-NiOOH [18].
Jabs et al. [16] reported that the formation of Ni(III) species at electrode potentials above 0.4 V was noticeable on both the i/E voltammetric trace and the XPS data. A redox system was observed on the i/E trace as a well-defined pair of anodic and cathodic waves at a potential range from 0.3 V to 0.5 V. On the other hand, a shift of the binding energies of all oxidic and hydroxidic XPS lines was informed. This shift could be related to the doping of the passive layer with higher valent Ni(III) species. They suggested a two-layer model for the passive layers formed at Ni-Cr (80:20) alloy electrodes, an inner oxide layer in contact with the metal and an outer hydroxide layer in contact with the electrolyte. The XPS data showed that Ni(OH)2 and Cr(OH)3 are present in the outer hydroxide layer, Ni(III) and some soluble Cr(VI) are only observed in the transpassive potential range [16]. Only the redox couple Ni(II)/Ni(III) was observed on the i/E voltammetric trace at a potential range from 0.0 V to 0.6 V.
A review of our cv results with Ni and Ni-Cr electrodes at the potential range from 0.0 V to 0.6 V indicates that the complexity of both the oxidative and the reductive waves increased with the number of cv scans. As shown in Figure 2, panels A and B, the peak current of the oxidative wave increased with the number of cv scans. On the other hand, a new reductive wave developed (peak III, EpIII at a potential range between 0.25 V and 0.35 V) on both Ni and Ni-Cr electrode surfaces during the negative going potential scan. This new wave was identified as due to the reduction of γ-NiOOH [18].
Different authors have reported on the multiplicity of anodic and cathodic voltammetric current peaks at Ni oxide electrodes [20,21] (and references therein). The peak current multiplicity was related to the presence of different Ni(OH)2 species on the electrode surface. Arvía et al. [20,21] developed experimental methodologies that enabled them to separate and study the processes occurring at Ni(OH)2 surfaces under potentiodynamic conditions in alkaline solutions. By applying complex perturbbation conditions to the working electrode, or by working at different temperatures, Arvía et al. were able to separate the anodic voltammetric current peak into two current peaks, indicating the presence of at least two different species on the electrode surface. They found that the electro-oxidation of the more unstable species was characterized by the first anodic current peak which was located at approximately 0.61 V and that the one corresponding to the most stable species was located at approximately 0.65 V (referred to the standard hydrogen electrode). Therefore, they suggested that the energy difference for electro-oxidation was in the range of 0.5 - 1.0 kcal·mol–1, a value too small for structural rearrangements involving bond breaks of any type. The splitting of the cathodic current peak occurred similarly to that of the anodic current peak.
In our work, a further analysis of the results obtained at Ni (Figure 2, panel (a)) and Ni-Cr (Figure 2, panel B) showed that the potential of the oxidative current peak decreased during the first few cv scans, then increased during approximately 150 cv scans, and finally became constant. At nickel electrodes, the oxidative current peak potential was nearly 0.47 V after 5 cv cycles, while it
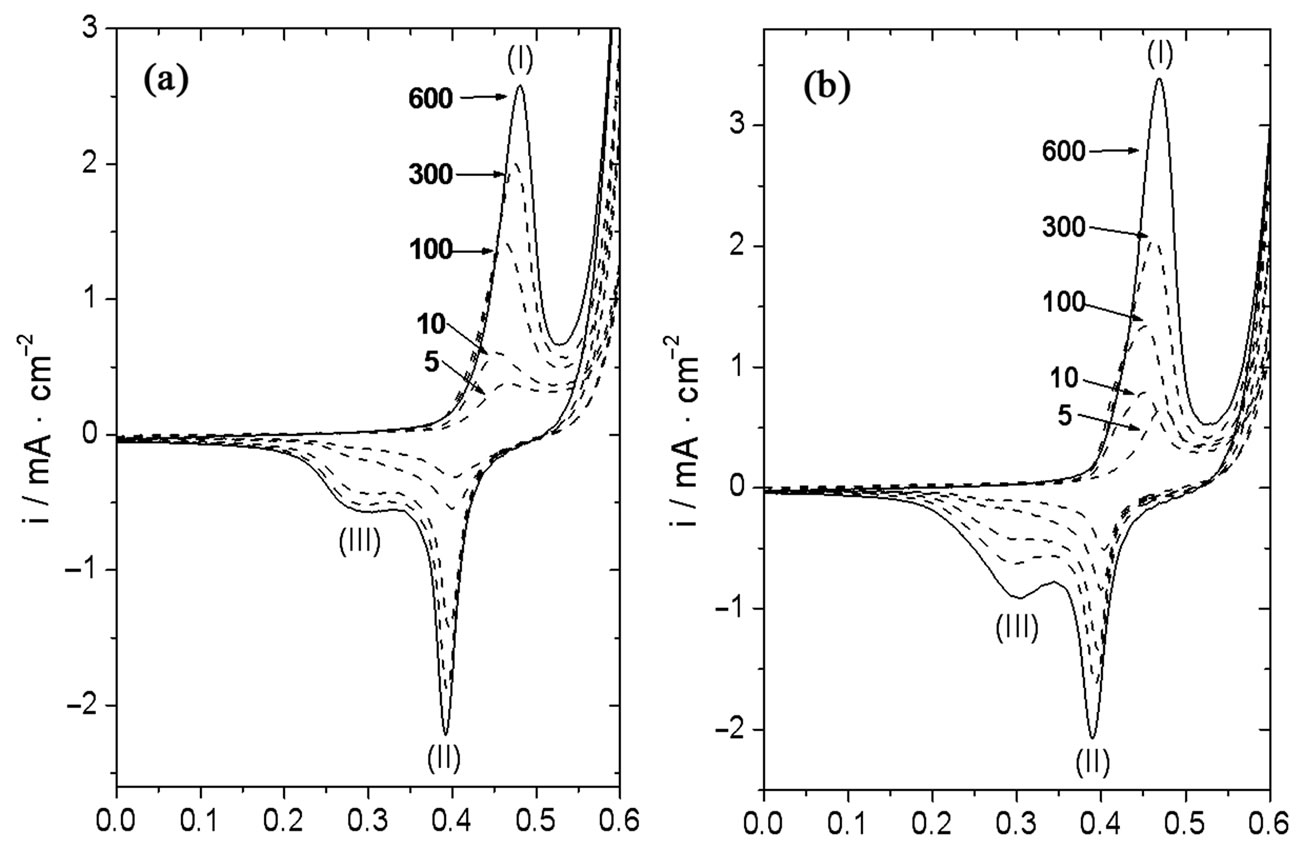
Figure 2. Evolution of the cyclic voltammetric response with the number of cv cycles at: a) Ni and b) Ni-Cr electrodes in 0.10 M NaOH. v = 0.050 V/s.
became 0.45 V after 10 cv cycles. Finally, it slowly increased and became constant at approximately 0.48 V after 600 cv cycles. At nickel-chromium alloys, the oxidative current peak potential observed after 5 cv cycles was nearly 0.47 V. It decreased to approximately 0.46 V after 10 cv cycles, and then slowly increased until it became constant at nearly 0.47 V after 600 cv cycles. Moreover, an analysis of the first derivative of the current with respect to potential (i/E, results not shown) clearly showed that a shoulder developed at potentials slightly smaller than EpI (i.e. 0.42 V) for the Ni-Cr electrode during the first 100 cv scans (see for example trace 10 in panel B, Figure 2), and then merged with peak I. This shoulder may be taken as indicative of an electrochemical process taking place at potentials very close to the main peak potential. On the contrary, this shoulder was not observed (or it was hardly distinguishable) at the Ni electrode. Finally, both anodic and cathodic peak charges and peak currents observed at the Ni-Cr electrode were higher (approximately 35% after 600 cv scans) than those observed with the Ni electrode.
The results obtained at Ni-Cr electrodes showed that at least two crystallographic forms of NiOOH were produced during the voltammetric cycles. Moreover, since the overall anodic and cathodic charges remained practically constant after the stabilization period, the relative proportion of oxidized Ni species (in principle β-NiOOH and γ-NiOOH) could be said to depend on the electrode perturbation waveform employed. Then, assuming that the charge under peak II and peak III represented each a single electrochemical reaction and that the dissolution of species was negligible, it could be suggested that the charge under each cathodic wave was indicative of the surface concentrations of species. Thus, the charges obtained under waves II and III were representative of the amount of β-NiOOH and γ-NiOOH produced during the positive going potential scan, respectively.
Considering that the cyclic voltammetric response of surface confined electron transfer processes is symmetrical [22], we tried various probability distribution equations to fit the experimental data. The best results were obtained with the Lorentz distribution (or Cauchy-Lorentz distribution). To obtain the electrochemical charge of the cathodic processes, each cathodic peak was fitted with a Lorentzian function with the following restraints: 1) the total electrochemical charge of the cathodic processes must be equal to that of the anodic process; 2) the addition of the individual electrochemical charges in the cathodic trace must be equal to that of the total cathodic process; and 3) the peak potentials obtained from the Lorentzian fitting process must be equal to those obtained experimentally. For the anodic trace, only the fitting obtained after 600 voltammetric cv scans is shown in Figure 3 (panel (a), dotted line) as only one peak was observed during the positive going potential scan. In regards to the reductive waves, the cathodic i-E trace was deconvoluted into two Lorentzian components, and the area (charge) under each peak was then calculated. Thus, the individual contribution of each crystallographic form (β-NiOOH and γ-NiOOH) to the total cathodic current could be estimated at different numbers of cv scans. As an example, Figure 3, panel B, shows the reconstruction of the experimental cathodic trace observed after 400 cv scans. Dotted lines represent the individual reduction of β-NiOOH to β-Ni(OH)2 and of γ-NiOOH to α-Ni(OH)2 at approximately 0.37 V and 0.30 V, respectively. The dashed
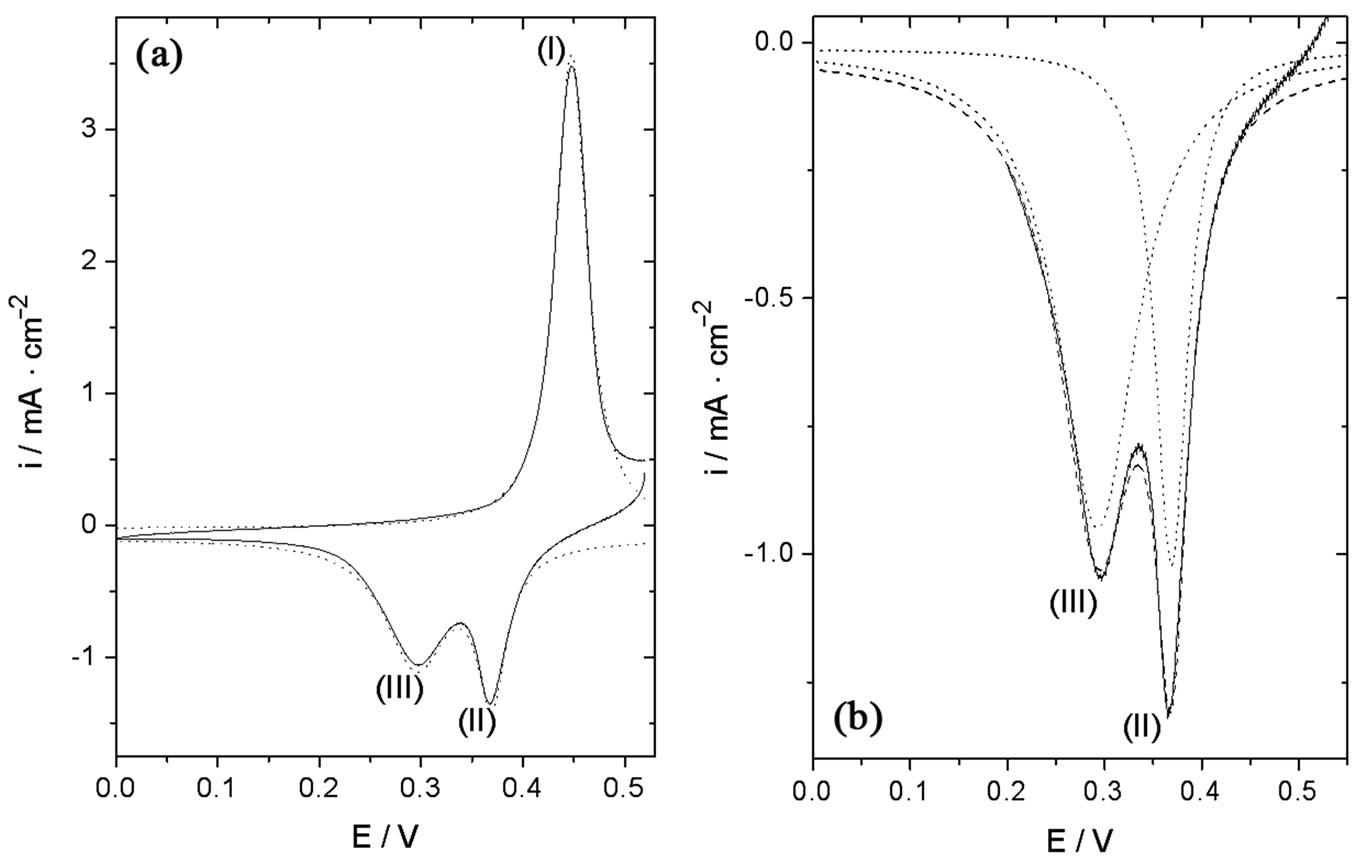
Figure 3. (a) Lorentzian fits of the anodic and cathodic traces obtained after 600 cv cycles. v = 0.050 V/s, 0.10 M NaOH. Experimental current (——), sum of individual Lorentzian fits (- - -); (b) Lorentzian fit of the cathodic trace obtained after 400 cv scans. Individual Lorentzian fits (∙∙∙∙), sum of individual Loentzian fits (- - -), experimental cathodic current (——).
line represents the sum of the individual contributions. The experimental cathodic current is plotted as a solid line. A good match between the experimental cathodic current and the sum of the individual contributions was obtained. Good matches were obtained in all cases (different numbers of cv scans). Thus, the amount of each oxide-hydroxide crystallographic form could be estimated by assuming that one electron was transferred in each reductive step. This procedure was applied at different numbers of cv scans and allowed us to evaluate the differences in growth of the oxide-hydroxide species obtained by using each of the electrode potential sweep program developed.
3.2. Oxides-Hydroxides Formation at Ni Electrodes
Approximately equal amounts of β-NiOOH and γ-NiOOH were obtained at Ni electrodes (peaks II and III, Figure 4, panel A) by using treatment A. The first five cycles were performed by sweeping the electrode potential between 0.00 V and 0.60 V. The fifth cycle is shown in Figure 4, panel A (trace 5). Then, the cathodic inverting potential was changed to 0.10 V during the following 10 cycles. The fifteenth cycle is shown in Figure 4, panel A (trace 15). Finally, the cathodic inverting potential was changed to 0.20 V for the remaining part of the experiment (600 cv cycles). Traces obtained at 50, 100, 300, 400, and 600 cv cycles are also shown in Figure 4, panel A. The potential for peak current I shifted to slightly higher values with the number of cv cycles, and the charge under this oxidative peak grew until it remained almost constant at approximately 2.04 mC/cm2 (Figure 4, panel B). On the other hand, the electrochemical response observed during the cathodic scan also evolved with the number of cv cycles. The charge under the reductive wave II increased until it remained almost constant. Besides, a new peak developed (peak III) at approximately 0.30 V. The charge under this wave also increased until it remained constant after 600 cv cycles. Thus, the total sum of charges under the cathodic waves remained constant after the 600 cv cycles at ca. 2.12 mC/cm2, which was very close to the anodic charge, so the ratio QpI/(QpII + QpIII) = 0.96. This little difference may be attributed to the proximity of the waves to the oxygen evolution potential. Nevertheless, the closeness of this ratio to unity could be said to indicate that the electrochemical reactions were reversible, in the sense that all the species oxidized during the positive going potential scan were reduced during the reverse scan. It could also indicate that the dissolution of oxide species from the electrode surface was negligible. Moreover, approximately the same anodic and cathodic charges were obtained in the voltammetric experiments after the electrode was left in 0.1 M NaOH during a week, pointing to the stability of the film.
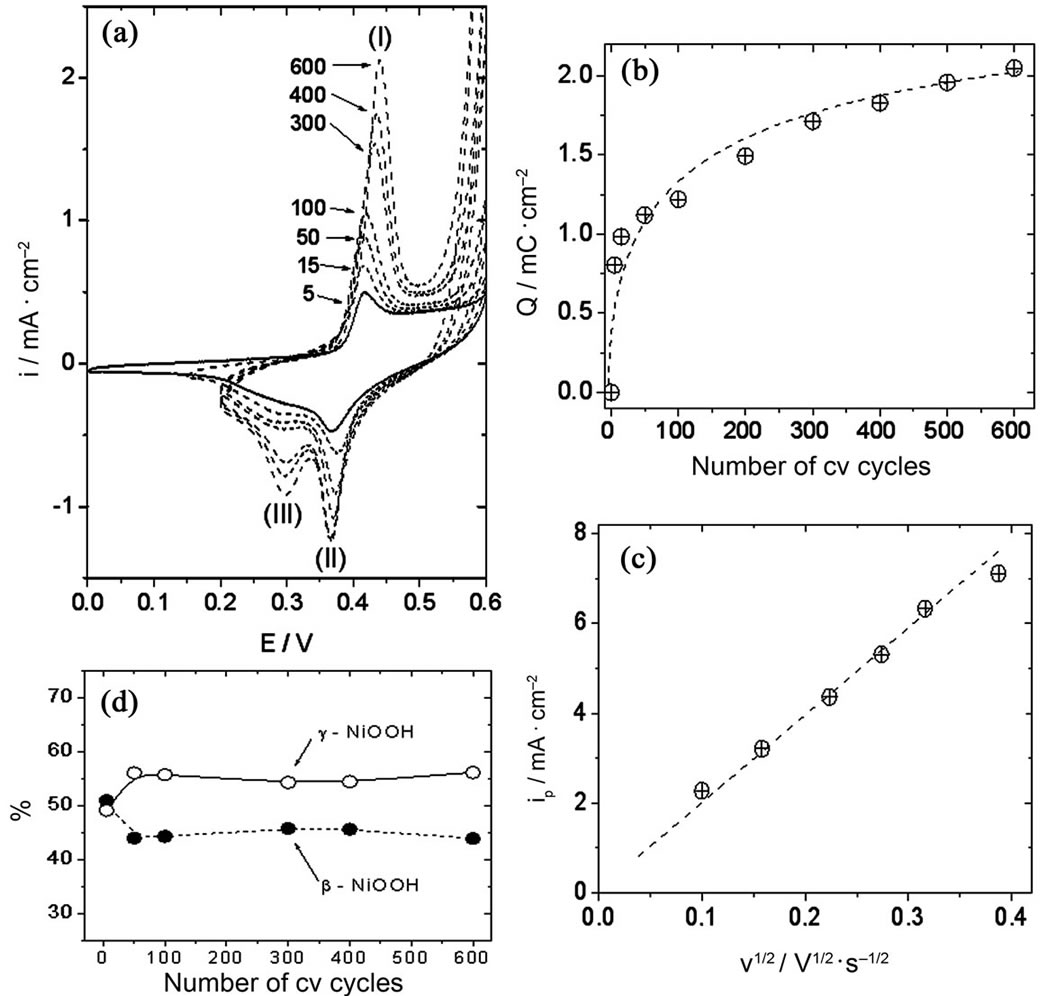
Figure 4. (a) Growth of γ-NiOOH and β-NiOOH at Ni electrodes in 0.10 M NaOH; (b) Evolution of peak I charge with the number of cv scans; (c) Electrode response (ipI) as a function of scan rate. Oxide-hydroxide layer obtained after 600 cv scans; (d) Relative amounts of Ni oxide-hydroxide species obtained at different numbers of cv cycles.
We considered that after 600 cv cycles the species at the electrode surface had attained a stable concentration, and we studied the electrode response at different scan rates at a scan rate range between 0.01 and 0.16 V/s (Figure 4, panel (c)). The current at peak I increased linearly with the square root of the potential scan rate, which could be indicating that the global electrochemical process is diffusion controlled. It has been suggested in the literature that diffusion of species inside the oxide film is the dominating process at these scan rates [23]. Gosanlves et al. suggested that the redox processes in aqueous alkali metal hydroxides may involve incorporation/expulsion of H3O+ and/or OH– and/or hydrated cations, as well as solvent transfer [24].
Figure 4, panel D, shows the variation of the relative amounts of β-NiOOH and γ-NiOOH calculated at different stages of the oxides-hydroxides layer growth. The calculations were performed from the Lorentzian fits of the cathodic traces, as explained before. The points (black dots and open circles) indicate the amounts of β-NiOOH and γ-NiOOH, respectively, calculated after 5, 15, 50, 100, 300, 400 and 600 cv cycles. It is clear from Figure 4, panel D, that γ-NiOOH grew preferentially during the first few cv cycles. After that, the relative amounts of γ-NiOOH and β-NiOOH remained almost constant with the number of voltammetric cv cycles, although the oxide-hydroxide layer grew, as can be deduced from the increase of the oxidative electrochemical charge with the number of cv cycles.
A clear growth of β-NiOOH was observed (peak II, Figure 5, panel (a)) when the working electrode was perturbed with treatment B. The first five cv cycles were performed by sweeping the electrode potential between 0.00 V and 0.60 V (trace 5 in Figure 5, panel (a)). Then, other ten cv cycles were performed at a potential range between 0.00 V and 0.50 V (Figure 5, trace 15). Finally, the working electrode potential was scanned between approximately 0.10 V and 0.50 V during the remaining part of the experiment. Traces obtained at 50, 100, 300, 400 and 600 cv cycles are also shown in Figure 5, panel
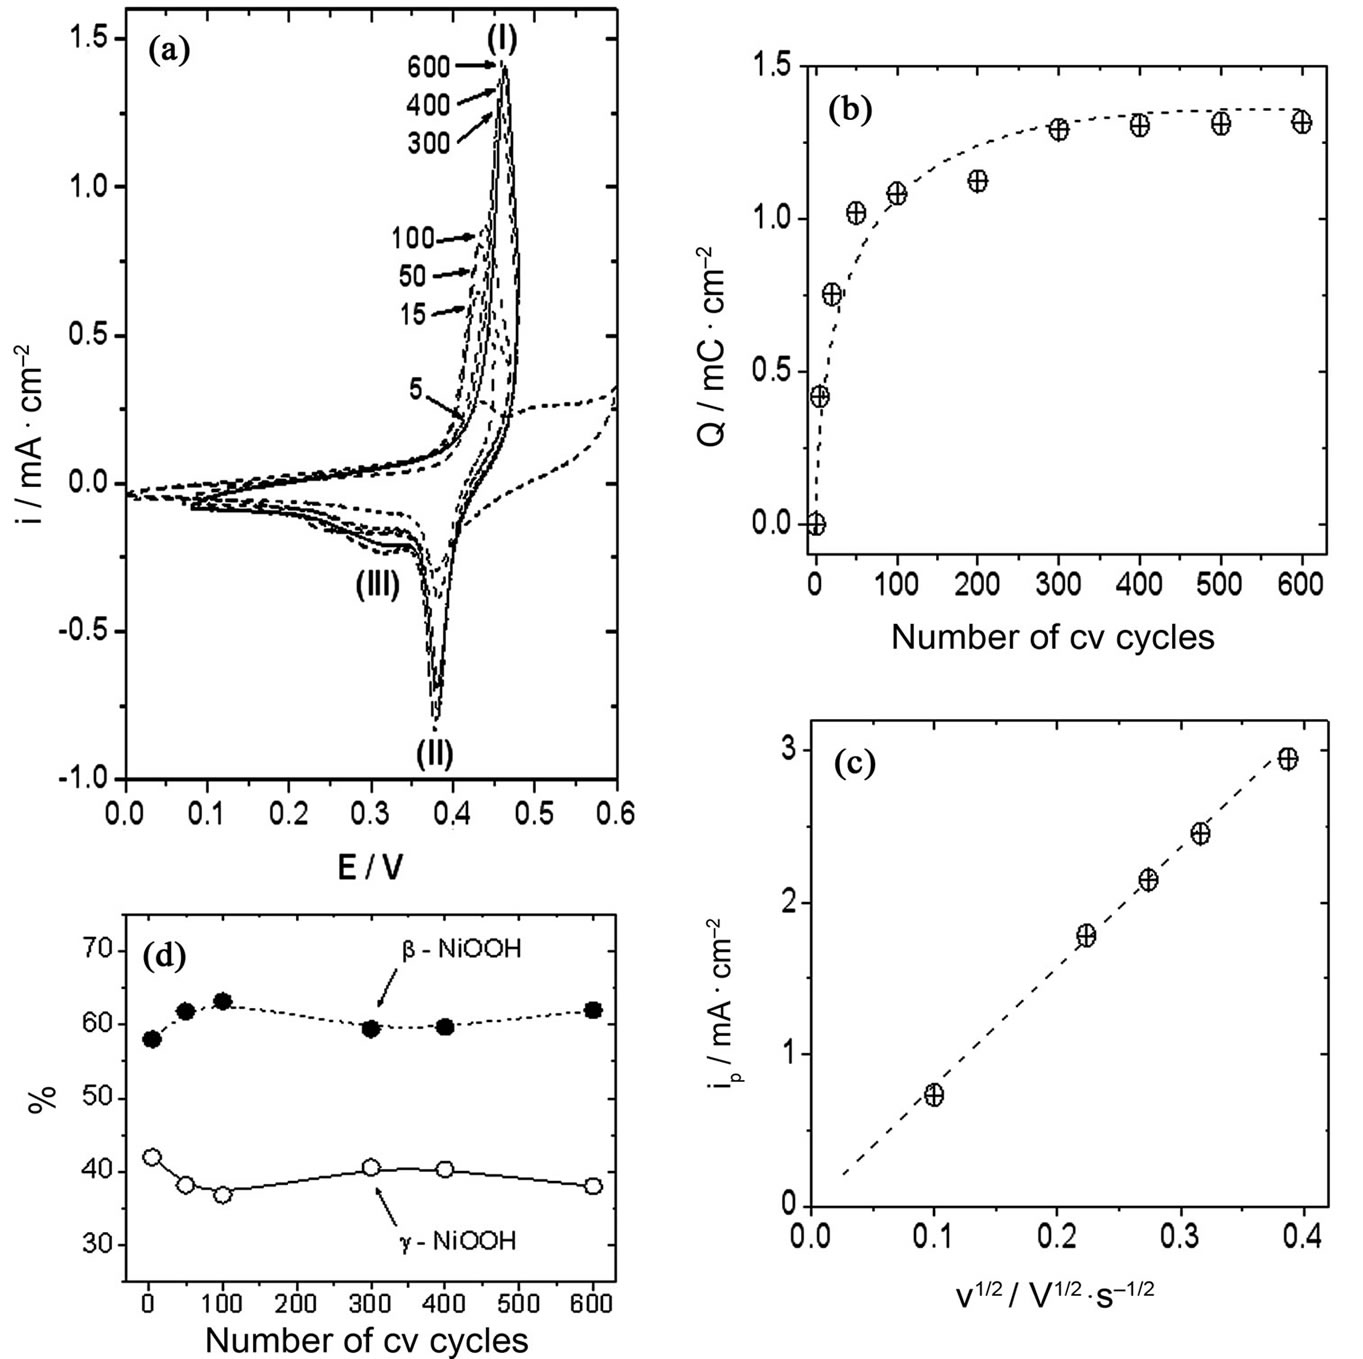
Figure 5. (a) β-NiOOH growth at Ni electrodes in 0.10 M NaOH; (b) Evolution of peak I charge with the number of cv cycles. (c) Electrode response (ipI) with scan rate. Oxide-hydroxide layer obtained after 600 cv scans; (d) Relative amounts of Ni oxide-hydroxide species obtained at different numbers of cv cycles.
A. The charge measured under the oxidative wave after 600 cv cycles was ca. 1.31 mC/cm2. On the other hand, the electrochemical response observed during the negative going potential scan also changed with the number of cv cycles. The growth of the wave ascribed to the reduction of β-NiOOH was the main process observed on these scans. The cathodic trace also attained a stable electrochemical response after approximately 600 cv cycles, and the charge measured under the reductive wave II was ca. 1.37 mC/cm2. Again, the ratio of anodic to cathodic charges was close to one (0.96), which may be interpreted as indicating the reversibility of the electrochemical system.
After approximately 300 cv cycles, the charge measured under the oxidative wave I remained almost constant, as observed in Figure 5, panel B. Then, it seemed reasonable to think that the species on the electrode surface had attained a stable concentration, and we studied the electrode response with the scan rate at a scan rate range between 0.01 and 0.16 V/s. Again, we observed a linear relationship between ipI and the square root of the scan rate, which may be attributed to the diffusion of species inside the oxide film covering the electrode surface.
Although the formation of a little amount of γ-NiOOH may be deduced from the reductive wave observed at a potential range from 0.30 V to 0.35 V, it is clear that the development of β-NiOOH was the main process taking place by using treatment B. A preferential development of β-NiOOH against γ-NiOOH can be deduced from the analysis of the electrochemical charges under voltammetric peaks II and III, represented in Figure 5, panel D, as the relative amounts of oxide-hydroxide species. This development is evident during the first hundred cv cycles. After that, the relative amounts of γ-NiOOH and bNiOOH remained almost constant until the end of the stabilization period (600 voltammetric cv cycles). The final relative amounts of β-NiOOH and γ-NiOOH obtained after the 600 cv cycles stabilization period by applying treatments A and B at Ni electrodes are listed in Table 1" target="_self"> Table 1.
3.3. Oxides-Hydroxides Formation at Ni-Cr Electrodes
Figure 6, panel (a), shows the oxide-hydroxide development obtained with Ni-Cr (80:20) alloy electrodes by
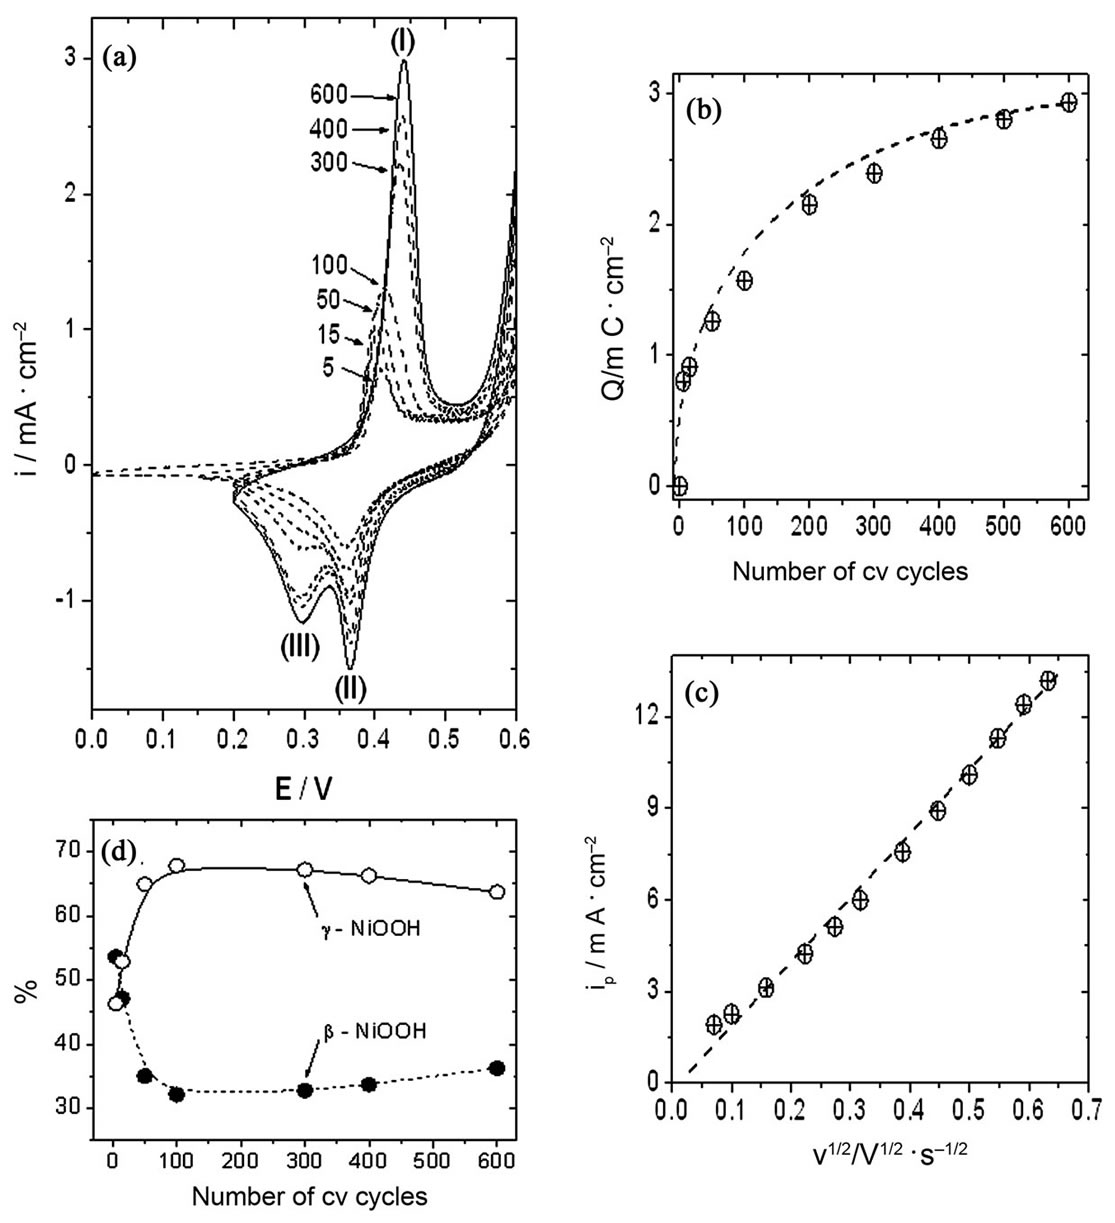
Figure 6. (a) Growth of γ-NiOOH and β-NiOOH at the Ni-Cr alloy electrode in 0.10 M NaOH; (b) Evolution of peak I charge with the number of cv scans; (c) Electrode response (ipI) as a function of scan rate. Oxide-hydroxide layer obtained after 600 cv scans; (d) Relative amounts of Ni oxide-hydroxide species obtained at different numbers of cv cycles.
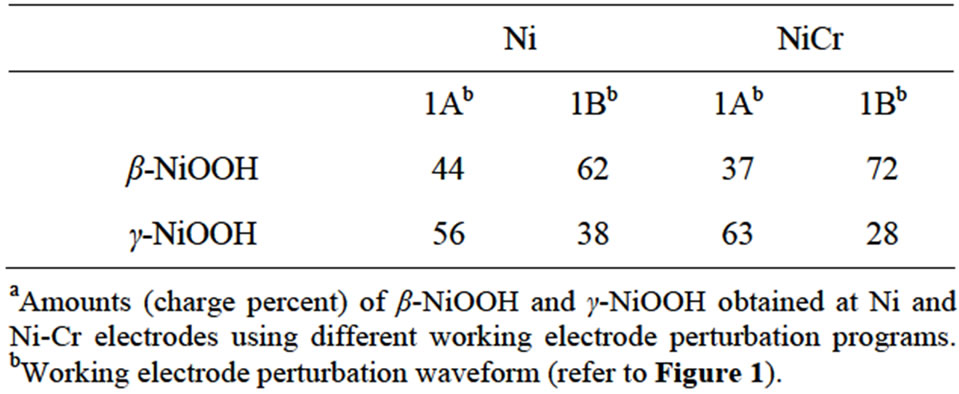
Table 1. Relative amountsa of oxide-hydroxides obtained with different working electrode perturbation programs.
using treatment A. The formation of higher quantities of γ-NiOOH was observed at Ni-Cr alloy electrodes as compared to Ni electrodes (compare panels (a) in Figures 4 and 6). The electrochemical charge measured under peak I at Ni-Cr electrodes was higher than that related to the same process at pure Ni electrodes, i.e. approximately 2.95 mC/cm2 vs 2.04 mC/cm2, respectively (compare panels B in Figures 4 and 6). On the other hand, the total charge measured under the reductive waves during the negative going potential scan was also higher at Ni-Cr electrodes as compared to pure Ni electrodes, ca. 2.86 mC/cm2 and 2.12 mC/cm2, respectively. The ratio QpI/(QpII + QpIII) observed at Ni-Cr alloy electrodes was also close to one, i.e. 1.03.
Finally, the peak current of the oxidative wave (ipI), obtained after the stabilization period (approximately 600 cv cycles), had a linear relationship with the square root of the scan rate at a scan rate range between 0.01 and 0.16 V/s, pointing to a diffusion dependence of the process.
Figure 6, panel (d), shows the change in the relative amounts of γ-NiOOH and β-NiOOH oxides-hydroxides, as calculated from the Lorentzian fits of the cathodic traces, at different stages of the stabilization period. The relative amount of γ-NiOOH clearly increased during the first 100 voltammetric cv cycles, as compared to the relative amount of β-NiOOH. The relative amounts of γ- NiOOH and β-NiOOH remained almost constant after that number of cv scans, although the oxide-hydroxide layer thickened, as deduced from the increase in the anodic charges (Figure 6, panel (b)).
The growth of mainly β-NiOOH was observed when treatment B, was used (Figure 7, panel (a)). The potential
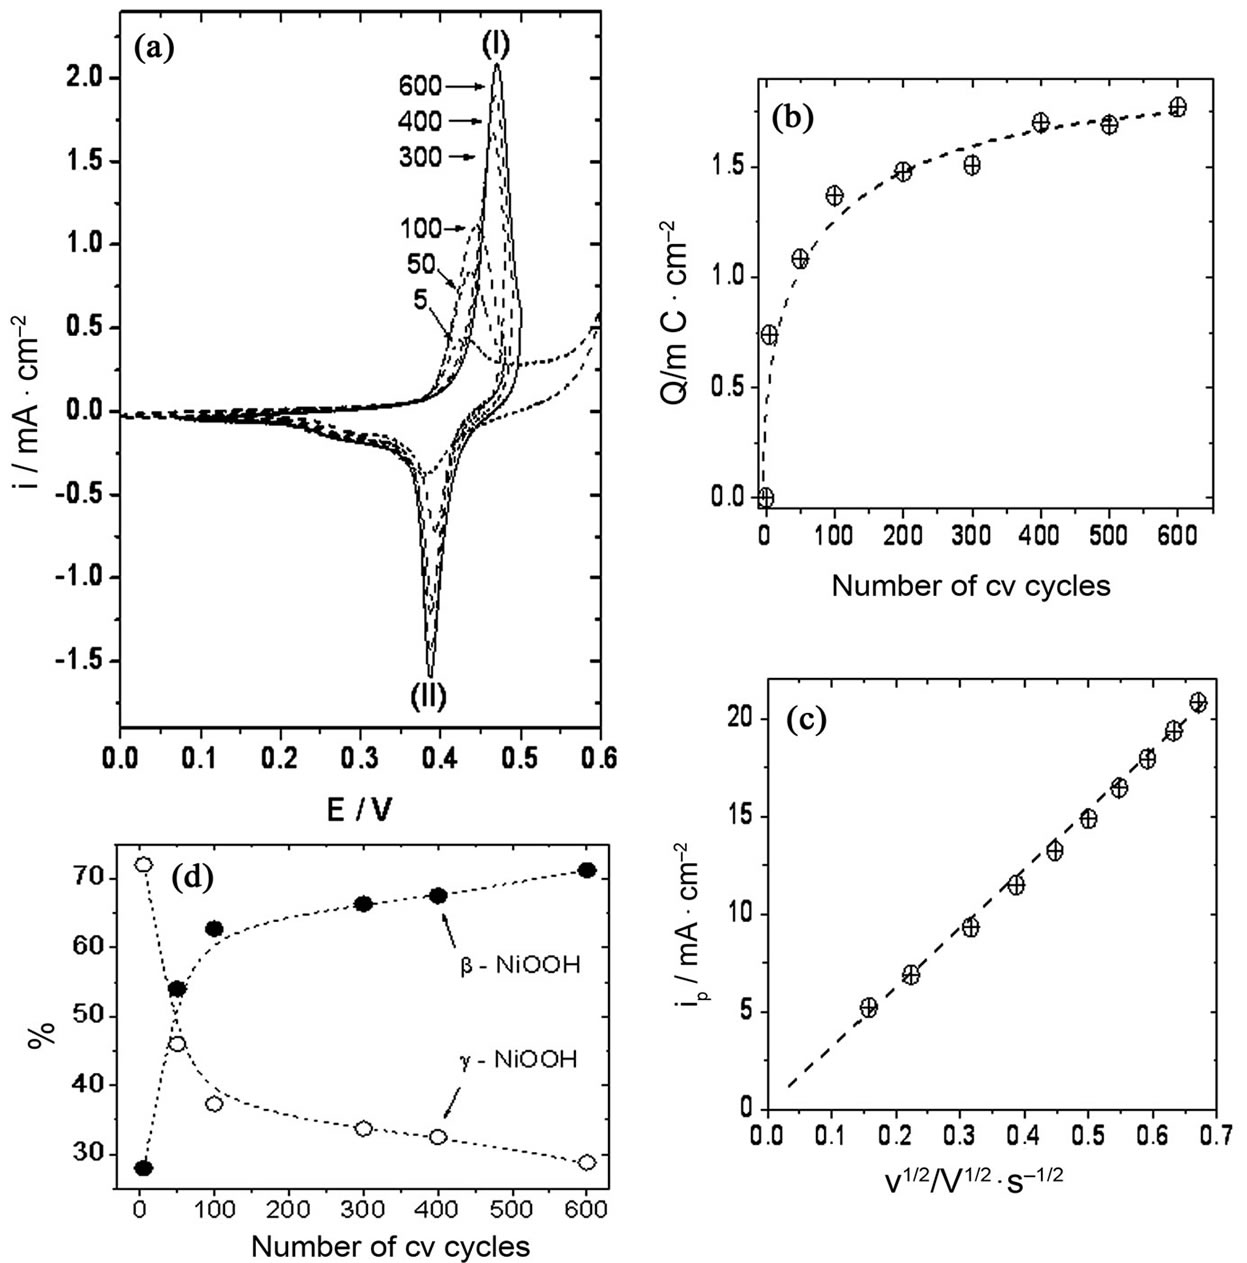
Figure 7. (a) β-NiOOH growth at Ni-Cr electrodes in 0.10 M NaOH; (b) Evolution of peak I charge with the number of cv scans; (c) Elecrode response (ipI) with scan rate. Oxide-hydroxide layer obtained after 600 cv scans; (d) Relative amounts of Ni oxide-hydroxide species obtained at different numbers of cv cycles.
for peak current shifted to more positive values during the first few scans, and then remained constant up to the end of the experiment (approximately 600 cv cycles). The peak current and electrochemical charge under the oxidative wave observed during the positive going potential scan increased with the number of cv cycles up to approximately 400 cv cycles, and then remained almost constant until the end of the experiment (600 cv cycles). The electrochemical charge measured under this wave was higher than that obtained with pure Ni electrodes under the same perturbation program, ca. 1.74 mC/cm2 vs 1.31 mC/cm2. On the other hand, the reductive wave attributed to the reduction of β-NiOOH was the main process which could be observed during the negative going potential scan (Figure 7, panel (a)). The charge under this reductive wave was ca. 1.69 mC/cm2, higher than that obtained when a pure Ni electrode was used (ca. 1.37 mC/cm2). Again, the ratio QpI/QpII obtained at Ni-Cr alloy electrodes was close to one, i.e. 1.03.
The dependence of ipI with the scan rate was studied at a scan rate range between 0.01 and 0.16 V/s once the proportion of Ni oxides-hydroxides on the electrode surface was stable, i.e. after approximately 600 cv cycles. A linear relationship was observed with the square root of the scan rate, indicating that the diffusion of species could be the main process observed at these scan rates (Figure 7, panel (c)).
Table 1 summarizes the results of the development of the different Ni oxide-hydroxide crystallographic species. Treatment A developed γ-NiOOH species slightly higher than β-NiOOH species at both Ni and Ni-Cr alloy electrodes. However, this difference was more evident at Ni-Cr alloy electrodes as compared to Ni electrodes. On the other hand, the preferential development of β-NiOOH species was the main process observed when treatment B was used in the cv experiments. Higher relative amounts of β-NiOOH species were obtained at Ni-Cr alloy electrodes as compared to Ni electrodes. These results indicate that the presence of Cr in the electrode material also has an influence on the proportion of Ni oxide-hydroxide species developed by the different working conditions proposed in this work. However, a stable proportion of Ni oxide-hydroxide species can be obtained when either treatment A or treatment B is applied in cv experiments using Ni or Ni-Cr alloy electrodes. This stable proportion of species will allow us to begin surface studies to further understand the electrocatalytic processes taking place when organic substances are oxidized by Ni or Ni-Cr alloy electrodes in alkaline solutions.
4. Conclusions
Special potential scan programs were developed for cyclic voltammetric growth of different nickel oxide-hydroxide species on Ni based electrodes. The proportion of oxide-hydroxide species on Ni, as well as on Ni-Cr alloy electrodes, can be easily controlled. β-NiOOH can preferentially be developed by allowing the Ni(II) hydroxides to remain longer times on the electrode surface, facilitating the chemical transformation of α-Ni(OH)2 to β-Ni(OH)2. On the contrary, a mixture of γ-NiOOH and β-NiOOH was obtained when Ni(III) oxides-hydroxides were allowed to stay longer times on the electrode surface. Deconvolution of the cathodic trace into Lorentzian components showed that the preferential development of a given crystallographic form of Ni oxide-hydroxides occurred during the first 100 - 200 voltammetric cv cycles. Then, the relative amounts of the crystallographic forms remained constant, although the oxide-hydroxide layer thickened, as deduced from the increases in charge of the electrochemical reactions.
A stable oxides-hydroxides proportion on the Ni or Ni-Cr electrode surfaces could be attained after approximately 400 to 500 cv cycles, as deduced from the shape of the voltammograms or the constancy of the oxidative charge with the number of cv cycles. Moreover, approximately the same anodic and cathodic charges were obtained in the voltammetric experiments after the electrode was left in 0.1 M NaOH during a week, pointing to the stability of the film. The electrochemical reactions occurring at the potential range studied were reversible, meaning that almost all of the Ni(III) formed during the positive going potential scan were reduced to Ni(II) during the reverse scan.
Finally, a linear dependence of the peak current with the square root of the scan rate was observed. This behavior was considered to indicate that the global electrochemical process is diffusion controlled.
5. Acknowledgements
The authors acknowledge Universidad Nacional de Río Cuarto for financial support. DEP acknowledges Consejo Nacional de Investigaciones Científicas y Técnicas (CONICET) for his doctoral fellowship. JMM is a permanent member of Carrera del Investigador Científico de CONICET (CIC-CONICET).
REFERENCES
- M. Fleischmann, K. Korinek and D. Pletcher, “The Kinetics and Mechanism of the Oxidation of Amines and Alcohols at Oxide-Covered Nickel, Silver, Copper, and Cobalt Electrodes,” Journal of the Chemical Society, Perkin Transactions, Vol. 2, No. 10, 1972, pp. 1396-1403.
- B. E. Conway, “Reactions of Hydrogen and Organic Substances with and at Anodic Oxide Films at Electrodes,” In: S. Trasatti, Ed., Electrodes of Conducting Metallic Oxides, Elsevier, Amsterdam, 1981, pp. 433-517.
- S. Majdi, A. Jabbari, and H. Heli, “A Study of the Electrocatalytic Oxidation of Aspirin on a Nickel Hydroxide-Modified Nickel Electrode,” Journal of Solid State Electrochemistry, Vol. 11, No. 5, 2007, pp. 601-607. doi:10.1007/s10008-006-0205-0
- M. Jafarian, M. G. Mahjani, H. Heli, F. Gobal and M. Heydarpoor, “Electrocatalytic Oxidation of Methane at Nickel Hydroxide Modified Nickel Electrode in Alkaline Solution,” Electrochemistry Communications, Vol. 5, No. 2, 2003, pp. 184-188. doi:10.1016/S1388-2481(03)00017-1
- S. M. A. Shibli, K. S. Beenakumari and N. D. Suma, “Nano Nickel Oxide/Nickel Incorporated Nickel Composite Coating for Sensing and Estimation of Acetylcholine,” Biosenensor and Bioelectronics, Vol. 22, No. 5, 2006, pp. 633-638. doi:10.1016/j.bios.2006.01.020
- J. M. Marioli and T. Kuwana, “Electrochemical Detection of Carbohydrates at Nickel-Copper and Nickel-ChromiumIron Alloy Electrodes,” Electroanalysis, Vol. 5, No. 1, 1993, pp. 11-15. doi:10.1002/elan.1140050104
- J. M. Marioli, “Electrochemical Detection of Carbohydrates in HPLC,” Current Topics in Electrochemistry, Vol. 8, 2001, pp. 43-55.
- M. Hajjizadeh, A. Jabbari, H. Heli, A. A. MoosaviMovahedi, A. Shafiee and K. Karimian, “Electrocatalytic Oxidation and Determination of Deferasirox and Deferiprone on a Nickel Oxyhydroxide-Modified Electrode,” Analalytical Biochemistry, Vol. 373, No. 2, 2008, pp. 337-348. doi:10.1016/j.ab.2007.10.030
- Q. Yi, J. Zhang, W. Huang and X. Liu, “Electrocatalytic Oxidation of Cyclohexanol on a Nickel Oxyhydroxide Modified Nickel Electrode in Alkaline Solutions,” Catalysis Communications, Vol. 8, No. 7, 2007, pp. 1017-1022. doi:10.1016/j.catcom.2006.10.009
- B. S. Hui and C. O. Huber, “Amperometric Detection of Amines and Amino Acids in Flow Injection Systems with a Nickel Oxide Electrode,” Analytica Chimica Acta, Vol. 134, 1982, pp. 211-218. doi:10.1016/S0003-2670(01)84191-X
- I. L. de Mattos, D. Melo and E. A. G. Zagatto, “NickelChromium Electrode as a Detector in Flow-Inyection Amperometry: Determination of Glycerol,” Analytical Sciences, Vol. 15, No. 6, 1999, 537-541. doi:10.2116/analsci.15.537
- N. Alonso-Vante, “Generalidades Sobre Electrocatálisis,” In: N. Alonso-Vante, Ed., Electroquímica y Electrocatálisis, Buenos Aires, 2003, pp. 18-90.
- H. Bode, K. Dehmelt and J. Witte, “Zur Kenntnis der Nickelhydroxidelektrode—I. Über das Nickel (II)-Hydroxidhydrat,” Electrochim Acta, Vol. 11, No. 8, 1966, pp. 1079-1087. doi:10.1016/0013-4686(66)80045-2
- H. H. Huang, “Surface Characterization of Passive Film on NiCr-Based Dental Casting Alloys,” Biomaterials, Vol. 24, No. 9, 2003, pp. 1575-1582. doi:10.1016/S0142-9612(02)00544-6
- M. Bojinov, G. Fabricius, P. Kinnunen, T. Laitinen, K. Mäkëla, T. Saario and G. Sundholm, “The Mechanism of Transpassive Dissolution of Ni-Cr Alloys in Sulphate Solutions,” Electrochimica Acta, Vol. 45, No. 17, 2000, 2791-2802. doi:10.1016/S0013-4686(00)00387-X
- T. Jabs, P. Borthen and H. H. Strehblow, “X-Ray Photoelectron Spectroscopic Examinatios of Electrochemically Formed Passive Layers on Ni-Cr Alloys,” Journal of the Electrochemical Society, Vol. 144, No. 4, 1997, pp. 1231-1243. doi:10.1149/1.1837577
- J. M. Marioli and L. E. Sereno, “Electrochemical Detection of Underivatized Amino Acids with a Ni-Cr Alloy Electrode,” Journal of Liquid Chromatography & Related Technologies, Vol. 19, No. 15, 1996, pp. 2505-2515. doi:10.1080/10826079608014033
- J. M. Marioli and L. E. Sereno, “The Potentiodynamic Behavior of Nickel-Chromium (80:20) Alloy Electrodes in 0.10 N Sodium Hydroxide,” Electrochimica Acta, Vol. 40, No. 8, 1995, pp. 983-989. doi:10.1080/10826079608014033
- S.-G. Sun, “Studying Electrocatalytic Oxidation of Small Organic Molecules with in-Situ Infra Spectroscopy,” In: J. Lipkowski and P. N. Ross, Eds., Electrocatalysis, Series of Frontiers in Electrochemistry, Wiley-VCH, New York, 1998, pp. 243-290.
- R. S. Schrebler Guzmán, J. R. Vilche and A. J. Arvía, “Non-Equilibrium Effects in the Nickel Hydroxide Electrode,” Journal of Applied Electrochemistry, Vol. 9, No. 2, 1979, pp. 183-189. doi:10.1007/BF00616088
- H. Gómez Meier, J. R. Vilche and A. J. Arvía, “The Influence of Temperature on the Current Peak Multiplicity Related to the Nickel Hydroxide Electrode,” Journal of Applied Electrochemistry, Vol. 10, No. 5, 1980, pp. 611-621. doi:10.1007/BF00615484
- A. J. Bard and L. R. Faulkner, “Electrochemical Methods: Fundamentals and Applications,” Chapter 13, 2nd Edition, John Wiley & Sons, New York, 2001.
- H. M. French, M. J. Henderson, A. R. Hillman and E. Vieil, “Ion and Solvent Transfer Discrimination at a Nickel Hydroxide Film Exposed to LiOH by Combined Electrochemical Quartz Crystal Microbalance (EQCM) and Probe Beam Deflection (PBD) Techniques,” Journal of Electroanalytical Chemistry, Vol. 500, No. 1-2, 2001, pp. 192-207. doi:10.1016/S0022-0728(00)00373-9
- M. Gonsalves and A. R. Hillman, “Effect of Time Scale on Redox-Driven Ion and Solvent Transfers at Nickel Hydroxide Films in Aqueous Lithium Hydroxide Solutions,” Journal of Electroanalytcal Chemistry, Vol. 454, No. 1-2, 1998, pp. 183-202. doi:10.1016/S0022-0728(98)00262-9
NOTES
*Corresponding author.