Open Journal of Geology
Vol.08 No.05(2018), Article ID:84992,15 pages
10.4236/ojg.2018.85030
Facies and Sequence Stratigraphy Analyses of Klasaman Formation in the “X Well”, Northern Salawati Basin, Papua, Indonesia
Ovinda1,2, Edy Sunardi1, Ahmad Helman Hamdani1, Muhammad Burhannudinnur2, Afriadhi Triwerdhana3
1Faculty of Geological Engineering, Universitas Padjadjaran, Bandung, Indonesia
2Faculty of Earth Technology and Energy, Universitas Trisakti, Jakarta, Indonesia
3KTI Exploration Pertamina EP, Jakarta, Indonesia

Copyright © 2018 by authors and Scientific Research Publishing Inc.
This work is licensed under the Creative Commons Attribution International License (CC BY 4.0).
http://creativecommons.org/licenses/by/4.0/


Received: April 9, 2018; Accepted: May 28, 2018; Published: May 31, 2018
ABSTRACT
The “X Well” is located in the Salawati Basin which is part of Western Papua. The interval of study is the Klasaman Formation that is characterized by thick sediment intercalated sandstones and shales. The movement of Sorong Fault strongly controlled the sedimentation of this formation. This study is very important to give a contribution for developing exploration prospect by predicting reservoir distribution since localized facies change may mark the distribution of sandstones. The current study aims: 1) to define the age of Klasaman Formation; 2) to define the vertical facies; 3) to define the sequence stratigraphy; and 4) to predict the lateral change of facies. Five nannofossil datum planes are found throughout the interval and cover the age Late Miocene to Early Pliocene. LO Sphenolithus abies points the age 3.65 Ma, LO Reticulofenestra pseudoumbilicus points the age 3.79 Ma, FO Pseudoemiliania lacunosa points the age 4 Ma, LO Discoaster quinqueramus and LO Discoaster berrgrenii point the age 5.59 Ma and Top of small Reticulofenestra Interval points the age 7.167 Ma. They define the NN11 up to NN16 Martini’s zonation. The age of Klasaman Formation is known as the uppermost Late Miocene to the Early Pliocene. Four facies can be identified, namely Upper Shoreface, Lower Shoreface, Offshore Transition and Offshore. The upper shoreface facies is characterized by thick and clean sandstones, about 2.41 - 20.64 meters thick, while the lower shoreface facies consists of predominantly very fine to fine-grained sandstones intercalated by siltstones and claystones. The offshore transition facies is marked by thick claystones and siltstones intercalated with thin sandstones, whilst the offshore facies is marked by thick laminated claystones. Nine Parasequences 4th order can be identified within study interval, namely Progradational Parasequence-1 to 2, Retrogradational Parasequence-3, Progradational Parasequence-4 to 6, Retrogradational Parasequence-7 to 9. They are bounded by Sequence Boundary-1 to 8. The upper shoreface sandstones of Parasequence-4 to 9 can be potential reservoir rocks in the Klasaman Formation since the sandstones are very thick and clean. The sediments of Klasaman Formation have been sourced from elevated highland in the northeast area, so the upper shoreface sandstones have changed become the offshore claystones from northeast to southwest. High sedimentation rate and rapid subsidence of the basin mark the deposition of Klasaman Formation especially during the deposition of Parasequence-6 to 9 as a result of Sorong Fault tectonics.
Keywords:
Salawati Basin, Nannofossil Age, Facies, Sequence Stratigraphy and Sorong Fault

1. Introduction
The “X Well” is located in the Salawati Basin which is part of the western bird’s head of Papua Island. This basin is one of the major hydrocarbon regions in Indonesia.
One of potential reservoir rocks in this basin is the coarse siliciclastic of Early Pliocene Klasaman Formation [1] [2] . The object of study is the Klasaman Formation which is characterized by thick sediment intercalated sandstones and claystones. This thick sediment is probably caused by high sedimentation rate that resulted from rapid erosion of adjacent elevated highlands due to uplifting by Sorong Fault tectonism in the Late Miocene to Early Pliocene. However, there are still limited studies about facies succession of Klasaman Formation. This study is very important to give a contribution for developing exploration prospect by predicting reservoir distribution because the localized facies change may mark the distribution of sandstones. This basin is bounded to the north and west by Strike-Slip Sorong Fault, to the northeast and east by Kemum High Metasediment and Ayamaru Platform Carbonate, and to the south by Missol-Onin Geanticline Carbonate [2] . It can give various provenances for the sandstones.
The current study aims 1) to define the age of Klasaman Formation; 2) to define the vertical facies; 3) to define the sequence stratigraphy; and 4) to predict the lateral change of facies.
The depositional sequence packages will be divided by using sequence stratigraphic concept. Sequence stratigraphy is the study of rocks relationship within a time stratigraphic framework of repetitive, genetically related strata bounded by surface of erosion or non-deposition, or their correlative conformities [3] [4] . This study used well log data, seismic section and ditch cutting samples. All those data are used to analyze nannofossil age, facies and sequence stratigraphy.
2. Geological Setting
2.1. Tectonic Setting
Salawati Basin is a part of eastern Indonesia that is located at the triple junctions of the Eurasian, Indian-Australian and Pacific (Caroline and Phillipine Sea) plates (Figure 1). The boundary of these plates is characterized by the presence of subduction zones and major regional strike slip fault [5] .
Left-lateral Sorong Fault is a transitional area that separating the westward moving Pacific Oceanic Plate from the relatively stable Australian Continental Plate, and became the main structural framework in this basin. This fault has been active since Early Pliocene and controlled the geology of Salawati Basin. The NNE-SSW normal faults dominate the present structural style as a conjugate of the Sorong Fault [6] . The Sorong Fault also created en echelon folds and synthetic left-lateral faults with normal slip [7] (Figure 2).
2.2. Stratigraphic Setting
The Salawati Basin consists of stratigraphic successions from Paleozoic to Kenozoic [8] (Figure 3). The oldest stratigraphic sequence is the Silurian-Devonian Kemum metamorphics rocks and the Carboniferous-Permian Aifam continental margin sediments. Overlying those are the Mesozoic sediments (Tipuma and Kembelangan groups) which are only found in the southern part of the basin caused by uplifting in the northern part of the basin.
The Tertiary sediments are started with the Late Eocene to Early Pliocene carbonates of Faumai Formation. This Faumai Formation is overlain by the Late Oligocene shallow marine clastics of Sirga Formation, followed by Miocene
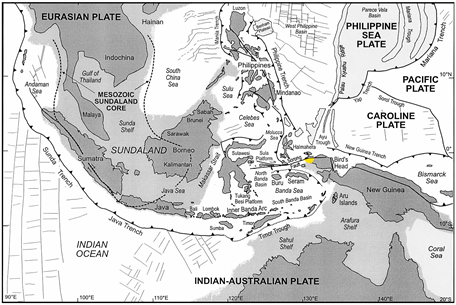
Figure 1. Geographical feature of Southeast Asia. The light grey areas are the continental selves drawn at the 200 m isobaths (Hall and Wilson, 2000). The yellow area is the Salawati Basin.
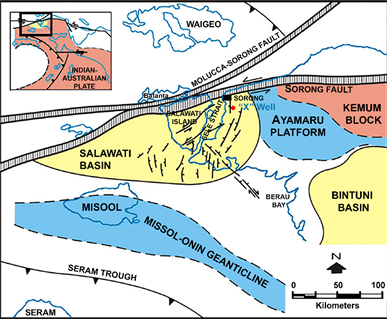
Figure 2. Geological setting of the Salawati Basin that controlled by left-lateral Sorong Fault and NNE-SSW normal faults (Satyana and Herawati, 2011).
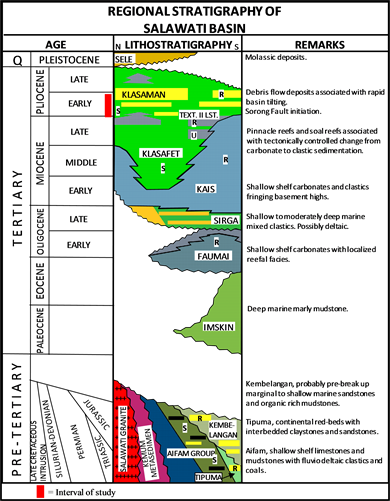
Figure 3. Regional stratigraphy of the Salawati Basin (Satyana, 2001).
carbonates of Kais Formation. At the same time with the deposition of Kais carbonate, the Miocene fine calcareous clastics of Klasafet Formation also were deposited. The youngest Tertiary sediments in the Salawati Basin are the Pliocene clastics of Klasaman Formation. Those entire successive sediments are ended unconformably by Pleistocene molassic deposits of Sele Formation conglomerates (Figure 3).
3. Materials and Methods
The data used in this study was taken from one wells drilled in the Salawati Basin, namely 58 samples of ditch cuttings, Gamma Ray log and seismic section. These materials have been used to analyze nannofosil age, facies and sequence stratigraphy. The ditch cutting also used for log calibration and depth matching. The interval study represents the upper part of Klasafet Formation and lower part of Klasaman Formation.
For the nannofossil analysis, the ditch cutting was prepared as a smear-slide. The slide was observed under a Nikon binocular polarizing microscope with an oil-immersion objectives lens at magnification of 1500×. Total amount of nannofossils that were examined from each sample are 200 speciments. Each species was counted and plotted (per depth interval) to define the first occurrence (FO) and the last occurrence (LO) datum plane. The age of nannofossil was determined by referring to the biostratigraphic zonation compiled by Sato and Chiyonobu (2013) [9] (Figure 4).
Facies characteristics from different rock units were defined by using Gamma Ray log values and patterns combined with ditch cutting and petrographic descriptions. Bell-shaped pattern of Gamma Ray log that indicates increasing clay contents up section or fining upward trends is a typical feature of fluvial point bar [10] (Figure 5). Funnel-shaped log patterns that indicate decreasing clay contents up section or a coarsening upward trend is a typical feature of shoreface deposits. Cylindrical or blocky log pattern that indicates thick uniformly coarse-grained sandstone unit is a typical of braided channel deposits. Serrated log pattern that indicates intercalation of thick shales and thin sandstone beds is a typical of storm-dominated shelf deposits.
Sequence stratigraphy was analyzed by using Gamma Ray log values and signatures combining with facies. This analysis intends to determine the parasequence stacking pattern, maximum flooding surface (MFS), sequence boundary (SB), system tracts as well as to correlate with global sequence stratigraphy [11] .
4. Result
4.1. Age
The age of studied interval was examined by studying nannofossils from 58 ditch cuttings that covers interval 45.72 - 1250 m. The lithology of those cuttings is calcareous sandstones, siltstones and claystones. They contain rare (less than 200 speciment) to abundant (more than 200 speciment) nannofossils. Five (5)
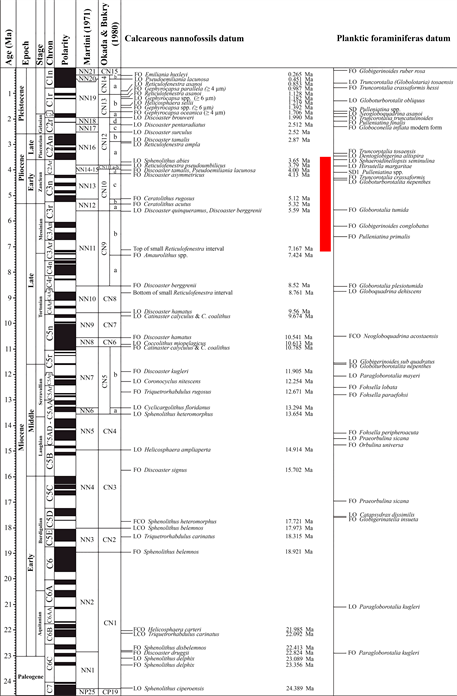
Figure 4. Biostratigraphic zonation of calcareous nannofossils and age determination compiled by Sato and Chiyonobu (2013). The red area is the age of study interval.
samples of sandstones from interval 45.72 - 182.88 m contain very few nannofossils (only 10 - 22 specimens per sample). One (1) sample of claystone from interval 594.36 - 603.5 m is barren nannofossil. Except those 6 samples, the samples contain abundant nannofossils (>200 speciments).
Five nannofossil datum planes have been found throughout the interval and cover the age Late Miocene to Early Pliocene (Table 1). LO Sphenolithus abies points the age 3.65 Ma, LO Reticulofenestra pseudoumbilicus points the age 3.79
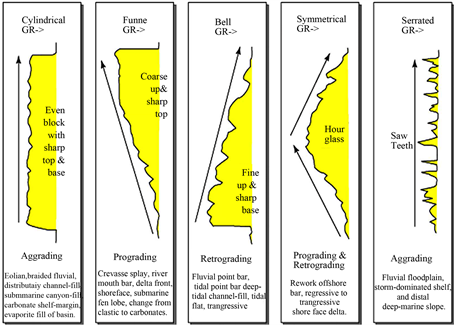
Figure 5. Well log patterns from different environments (Kendall and Pomar, 2005).

Table 1. Calcareous nannofossil datums and ages in the “X” Well.
LO = Last Occurrence; FO = First Occurrence; Ma = Million annum.
Ma, FO Pseudoemiliania lacunosa points the age 4 Ma, LO Discoaster quinqueramus and LO Discoaster berrgrenii points the age 5.59 Ma and Top of small Reticulofenestra Interval points the age 7.167 Ma.
Those datum planes can define several boundaries of Martini’s zonation. The LO Sphenolithus abies which defines the lower part of NN16 has been found at the depth of 109.73 m. The LO Reticulofenestra pseudoumbilicus that defines the NN15/NN16 boundary has been found at 265.18 m depth. The FO Pseudoemiliania lacunosa which defines the NN14/NN15 boundary has been found at 457.2 m depth. The LO Discoaster quinqueramus and LO Discoaster berrgrenii that define the NN11/NN12 boundary has been found at 632.46 m depth. The top of small Reticulofenestra interval at 1135.38 m depth defines the interval of NN11 (Figure 6). The boundaries of NN13/NN14 and NN12/ NN13 cannot be defined due to the absence of Discoaster asymmetricus and Ceratolithus rugosus.
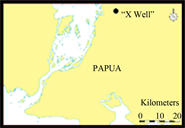
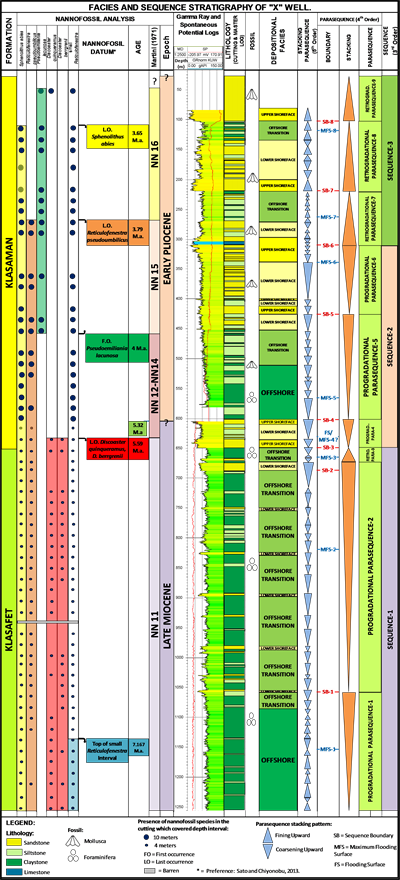
Figure 6. Age, facies and sequence stratigraphy of the “X” Well in the Salawati Basin.
4.2. Facies
Based on log patterns and cutting description, the sediment succession in the study interval consists of four sedimentary facies, they are: upper shoreface, lower shoreface, offshore transition and offshore (Figure 6). The sediment succession is marked by the presence of offshore facies in the lower part and followed by a progressively shoreward facies in the upper part. The characteristics of those facies will be explained below:
4.2.1. Upper Shoreface Facies
The upper shoreface facies occupies the uppermost part of parasequence and it characterized by thick and clean sandstones, about 2.41 - 20.64 meters of thickness. This feature represents a higher energy environment such as longshore and rips currents as well as wave surges.
Based on cutting description, the sandstones are grey to blackish grey, coarse to very coarse grain, sub-angular to sub-rounded, moderate to good sorting and contain minor mollusk fragments. Based on petrographic analysis, the sandstones are composed of 57% fragments of metamorphic, quartz wacke, granitoid, quartz and mudstone; 33% feldspar and plagioklas; 10% carbon; and cements of calcite and clay. The petrographic name is Lithic Wacke Sandstone. This upper shoreface facies is also intercalated by 6.35 meters thick of carbonate rock. It is composed of 87% bioclast; 11% fragments of serpentinite, quartz wacke, quartz and mudstone; 1% feldspar, 1% carbon; and cements of calcite and clay. The petrographic name is Detritus Packstone. This upper shoreface facies is found in the interval of 83 - 103.15 m, 198.93 - 218.51 m, 298.41 - 323.28 m, 604.8 - 610 m, and 634.43 - 649.78 m. The upper shoreface sandstones occurs only in the Klasaman Formation.
4.2.2. Lower Shoreface Facies
The lower shoreface facies occurs in the upper part of parasequence. It is composed of predominantly very fine to fine-grained sandstones intercalated by siltstones and claystones. The claystones and siltstones contain abundant fossils of foraminifera. This succession implies a lower energy environment. The petrographic analysis shows that the claystone composed of 90% shale and 10% mica, with cement of calcite.
4.2.3. Offshore Transition Facies
The offshore transition facies presents in the lower part of parasequence. It consists of thick claystone and siltstone intercalated with thin sandstone of lower shoreface. The sandstone is probably transported by the offshore currents that resulted from major storms. The claystones and siltstones contain abundant foraminifera fossils. This facies is a transition between lower shoreface and offshore facies.
4.2.4. Offshore Facies
The offshore facies occupies the lowermost part of parasequence and it is marked by thick laminated claystones. This feature implies a low energy environment during deposition. The entire offshore claystones contain abundant fossils of foraminifera. The thickest offshore facies can be observed in the lower part of study interval and occupies the Klasafet Formation.
4.3. Sequence Stratigraphy
Based on log pattern and facies, nine Parasequences 4th order can be identified throughout the interval, namely Parasequence-1 to 9. These parasequences are separated by eight Sequence Boundaries, SB-1 to 8 (Figure 6).
The Parasequences 4th order can be grouped into three Sequences 3rd order, namely Sequence-1 to 3. The thickness of those parasequences and sequences are presented in Table 2.
In general, the fasies in the study interval are shifting landward. This is correlable with the 3.2 up to 3.6 cycles 3rd order global sequence stratigraphy that shows relative change of coastal onlap to the landward (Figure 7).
Based on Age-Depth Plot, the age of those sequence boundaries can be estimated (Figure 8). The SB-1 and SB-2 are dated 6.91 Ma and 5.72 Ma respectively, and occurred in the Klasafet Formation. The SB-3 up to SB-8 is dated 5.64 Ma, 5.32 Ma, 3.96 Ma, 3.85 Ma, 3.75 Ma and 3.64 Ma respectively, and they occurred in the Klasaman Formation.
The graphic of sedimentation rate shows that those parasequences have been deposited by three trendings of sedimentation rate (Figure 8). Parasequences-1 to 3 have been deposited with sedimentation rate of 31.9 cm/1000 years. Parasequences-4 to 5, have the lowest sedimentation rate as 11 cm/1000 years. Parasequences-6 to 9 have the highest sedimentation rate as 98.7/1000 years.
The SW-NE seismic line shows, in the northeast area, the hummocky patterns characterize the Klasaman Formation, and suggests the sediments in this section was deposited dominantly as prograding stacking packages, whereas in the
Table 2. The thickness of Sequences and Parasequences.
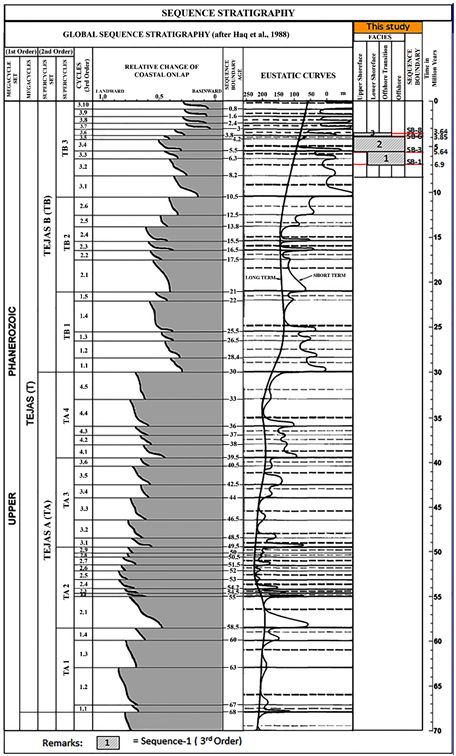
Figure 7. The correlation of sequence stratigraphy 3rd order of study interval to the global sequence stratigraphy cycles 3rd order.
southwest area, the seismic patterns change become parallel-divergent patterns. It indicates, from northeast to southwest, the facies has changed from upper shoreface (dominated by sandstones) become offshore (dominated by claystones). The base of Klasaman Formation is defined by SB-3 (Figure 9).
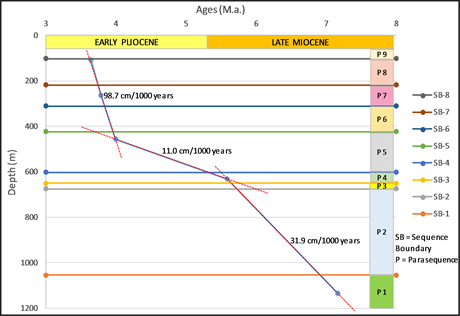
Figure 8. The Age-Depth Plot of study interval shows the sedimentation rate and the position of parasequences.
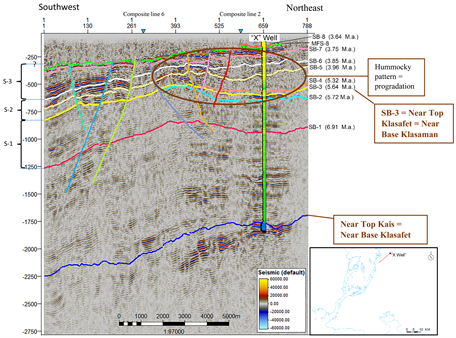
Figure 9. Seismic stratigraphy showing the position of Sequence Boundary (SB) 1-8 and Sequence 3rd order (S) 1-3. The ages of Sequence Boundaries are estimated from the Age-Depth plot.
5. Discussion
The upper shoreface sandstones can form excellent reservoirs since it has a good shore-parallel continuity and sandstones are clean. It is because the higher energy in the upper shoreface depositional processes can remove the finer grain of sediments. The thickest of sandstones can be seen in the Parasequence-6 to 9 (SB-6 to upper SB-8) and the thinnest can be seen in the Parasequence-5 (SB-5 to SB-6). This upper shoreface sandstone will be thinning and shifting become offshore claystones from northeast to southwest.
From pattern of sequence stacking that compare to the global sequence stratigraphy, it indicates that the cycles of sequences in the interval study, were more controlled by local tectonic than eustatic sea level. Probably the tectonic of Sorong Fault strongly controlled the deposition of sediments in the Salawati Basin during the uppermost Late Miocene to Early Miocene.
The thick sandstones of Parasequences-6 to 9 probably were resulted from high sedimentation rate of rapid erosion due to uplifting by Sorong Fault tectonics. In addition, the various rock fragments and the sub-angular to sub-rounded grain shapes indicate that the sandstones have been sourced from adjacent elevated highland. The change from progradation to retrogradation stacking patterns at SB-5 indicates that rapid subsidence has occurred in the basin especially during the deposition of Parasequence-6 to 9 (Figure 8).
6. Conclusions
Several conclusions can be drawn from this study:
1) Five nannofossil datum planes have been found throughout the interval and cover the age Late Miocene to Early Pliocene. The LO Sphenolithus abies points the age 3.65 Ma, the LO Reticulofenestra pseudoumbilicus points the age 3.79 Ma, the FO Pseudoemiliania lacunosa points the age 4 Ma, the LO Discoaster quinqueramus and LO Discoaster berrgrenii point the age 5.59 Ma, as well as the top of small Reticulofenestra interval points the age 7.167 Ma.
2) Several Martini’s zonations can be defined. The LO Sphenolithus abies defines NN16 interval. The LO Reticulofenestra pseudoumbilicus defines NN15/ NN16 boundary. The FO Pseudoemiliania lacunosa defines NN14/NN15 boundary. The LO Discoaster quinqueramus and Discoaster berrgrenii define NN11/NN12 boundary. The top of small Reticulofenestra interval defines NN11 interval.
3) The age of Klasaman Formation in this study interval is the uppermost Late Miocene to Early Miocene.
4) Four facies can be identified, namely Upper Shoreface, Lower Shoreface, Offshore Transition and Offshore.
5) The upper shoreface facies is characterized by thick and clean sandstones, about 2.41 - 20.64 meters of thickness, while the lower shoreface facies is characterized by predominantly very fine to fine-grained sandstones intercalated by siltstones and claystones. The offshore transition facies is marked by thick claystone and siltstone intercalated with thin sandstone, whilst the offshore facies is marked by thick laminated claystones.
6) Nine Parasequences 4th order can be identified throughout the interval, namely Progradational Parasequence-1 to 2, Retrogradational Parasequence-3, Progradational Parasequence-4 to 6, Retrogradational Parasequence-7 to 9. They are bounded by Sequence Boundary-1 to 8.
7) High sedimentation rate and rapid subsidence of the basin characterize the deposition of Klasaman Formation as a result of Sorong Fault tectonics.
8) The upper shoreface sandstones of Parasequence-4 to 9 can be potential reservoir rocks in the Klasaman Formation since the sandstones are very thick (2.4 - 20.6 meters) and clean.
9) The sediments of Klasaman Formation have been sourced from elevated highland in the northeast area, so the upper shoreface sandstones have changed become the offshore claystones from northeast to southwest
Acknowledgements
The authors would like to thank PT. Pertamina EP for providing the data during this study, and also to thank Direktorat Jenderal Migas for permission to publish this paper. Many thanks to Lutfi Noor Thofa from PT. Pertamina EP for his help to provide the data. The authors are grateful to Santi Dwi Pratiwi for her help during the analysis of nannofossils.
Cite this paper
Ovinda, Sunardi, E., Hamdani, A.H., Burhannudinnur, M. and Triwerdhana, A. (2018) Facies and Sequence Stratigraphy Analyses of Klasaman Formation in the “X Well”, Northern Salawati Basin, Papua, Indonesia. Open Journal of Geology, 8, 499-513. https://doi.org/10.4236/ojg.2018.85030
References
- 1. Pieters, P.E., Pigram, C.J., Trail, D.S., Dow, D.W., Ratman, N. and Sukamto, R. (1983) The Stratigraphy of Western Irian Jaya. Proceedings Indonesian Petroleum Association 12th Annual Convention, 1, 230-261. https://doi.org/10.29118/IPA.2443.229.261
- 2. Satyana, A.H. (2009) Emergence of New Petroleum System in the Mature Salawati Basin: Keys from Geochemical Biomarkers. Proceedings Indonesian Petroleum Association, 172-192. https://doi.org/10.29118/IPA.1871.09.G.172
- 3. Posamentier, H.W. and Vail, P.R. (1988) Eustatic Controls on Clastic Deposition I-Sequence and Systems Tract Models. In: Wilgus, C.K., Hastings, B.S., Kendall, C.G., Posamentier, H.W., Ross, C.A. and Van Wagoner, J.C., Eds., Sea Level Changes: An Integrated Approach, SEPM Special Publication, McLean, Va, Vol. 42, 109-124. https://doi.org/10.2110/pec.88.01.0109
- 4. Van Wagoner, J.C., Posamentier, H.W., Mitchum, R.M., Vail, P.R., Sarg, J.F., Loutit, T.S. and Hardenbol, J. (1988) An Overview of the Fundamentals of Sequence Stratigraphy and Key Definitions. In: Wilgus, C.K., Hastings, B.S., Kendall, C.G., Posamentier, H.W., Ross, C.A. and Van Wagoner, J.C., Eds., Sea Level Changes: An Integrated Approach, SEPM Special Publication, McLean, Va, Vol. 42, 39-45. https://doi.org/10.2110/pec.88.01.0039
- 5. Hall, R. and Wilson, M.E.J. (2000) Neogen Suture in Eastern Indonesia. Journal of Asian Earth Science, 18, 781-808. https://doi.org/10.1016/S1367-9120(00)00040-7
- 6. Froidevaux, C.M. (1977) Tertiary Tectonic History of the Salawati Area, Irian Jaya, Indonesia. Proceedings Indonesian Petroleum Association 6th Annual Convention, 1, 199-220. https://doi.org/10.29118/IPA.1624.199.220
- 7. Satyana, A.H. and Herawati, N. (2011) Sorong Fault Tectonism and Detachment of Salawati Island: Implications for Petroleum Generation and Migration in Salawati Basin, Bird’s Head of Papua. Proceedings Indonesian Petroleum Association, 183-204. https://doi.org/10.29118/IPA.2293.11.G.183
- 8. Satyana, A.H. (2001) Identifying New Petroleum System of the Salawati Basin, West Papua: Exploration Opportunities in Mature Basin. Lomba Karya Tulis EP II Pertamina.
- 9. Sato, T. and Chiyonobu, S. (2013) Manual of Microfossil Study. Asakura Publishing Co., Ltd., Japan, 108.
- 10. Kendall, C.G. and Pomar, L. (2005) Systems Tract, Bounding Surfaces, Lithofacies, Geometric Hierarchies and Stacking Patterns: Keys to Shallow Water Carbonate Interpretation. American Association of Petroleum Geologists Bulletin, 89.
- 11. Haq, B.U., Hardenbol, J. and Vail, P.R. (1988) Mesozoic and Cenozoic Chronostratigraphy and Cycles of Sea-Level Change. In: Wilgus, C.K., Hastings, B.S., Kendall, C.G., Posamentier, H.W., Ross, C.A. and Van Wagoner, J.C., Eds., Sea Level Changes: An Integrated Approach, SEPM Special Publication, McLean, Va, Vol. 42, 72-108.