Open Journal of Geology
Vol. 2 No. 2 (2012) , Article ID: 18685 , 7 pages DOI:10.4236/ojg.2012.22007
Simulation Experiments and Kinetics for the Formation of Organic Sulfide in Marine Carbonate Reservoirs
State Key Laboratory of Heavy Oil Processing, China University of Petroleum, Beijing, China
Email: *yuect@cup.edu.cn
Received January 24, 2012; revised February 23, 2012; accepted March 27, 2012
Keywords: Organic sulfide; Gasoline; Magnesium sulfate; Simulation experiment; Kinetics
ABSTRACT
Thermal simulation experiments on the system of gasoline and magnesium sulfate were carried out using an autoclave operating at high temperature and high pressure in the presence of water. Properties of the gas-oil-solid 3-phase products were analyzed by some advanced analytical methods including gas chromatography, microcoulometry, capillary gas chromatography in combination with a pulsed flame photometric detector, FT-IR and X-ray diffraction. The results showed that the reaction could proceed at 450˚C - 550˚C to produce MgO, S, C, H2S, CO2 and a series of organic sulfides such as mercaptans, sulfoethers and thiophenes as the main products. According to the reaction kinetics, the calculated activation energy of the reaction is 68.9 kJ·mol−1.
1. Introduction
Marine carbonate strata are widely distributed in China and have been proved to be a potential area for exploration. With deep-going exploration research, some oil and gas reservoirs related to Palaeozoic carbonate source rocks have been discovered, which show good prospect for exploration and provide strong geological evidence for further exploration for Palaeozoic carbonate reservoirs [1]. Ancient marine carbonate strata underwent a long and complex tectonic movement which caused erosion, oxidation, leaching and some other effects on the strata. These effects caused alteration and destruction of reservoirs. Consequently, mercaptan, sulfide, thiophene and their derivants were formed in the reservoir [2-5]. Non-thiophene organic sulfides were dominated in lowmaturity crude oil while in high-maturity crude oil, dibenzothiophene was dominated.
It is generally believed that in a geological body, elemental sulfur was incorporated into asphalt, crude oil and light hydrocarbons in natural gases, which caused the formation of organic sulfides. These organic sulfides have double bonds or unstable functional groups that only turned stable at the low temperature condition during the early diagenesis period. So it is implied that these processes occurred in the same special period [6,7]. Xia Yanqing pointed out that the amount of thiophenes and their derivants depend on the number of conjugated dienes intermediates [8-10]. At an appropriate low temperature, a large number of conjugated dienes intermediates and thiophenes appeared. High temperature-conduced thiophenes turned to benzothiophenes, on the contrary, the reverse reaction occurred. Recent studies have indicated that during the process of hydrous pyrolysis at high temperature, n-alkanes could produce double-bonded hydrocarbons and elemental sulfur could react with these hydrocarbons to form new organic sulfides between 200˚C - 250˚C [11-13]. Besides, sulfur may be incorporated into some unstable saturated hydrocarbons directly in the late diagenesis period, forming new non-hydrocarbon compounds or asphaltene. It is shown that some organic sulfides which were detected in the carbonate reservoir may be formed by way of incorporating of S into inorganic sulfides.
Organic sulfides in the marine carbonate reservoir can provide abundant geochemical information, so research on the formation mechanism of organic sulfides will find wide applications in oil-gas correlation, maturity determination for carbonate, and investigation on the characteristics of the depositional environment for carbonate rocks. However, the formation mechanism and the distribution features of organic sulfides still need to be proved by simulation experiments. In this paper, thermal simulation experiments on the system of gasoline and magnesium sulfate were carried out under hydrous conditions. The formation and distribution of organic sulfides, and the reaction kinetics were investigated.
2. Experimental
2.1. Experiment Reagent
The reagents employed in this study include dimethyl sulfide, isopropyl mercaptan, tert-Butyl mercaptan, propyl mercaptan, ethyl methyl sulfide, thiophene, ethyl thioether, butyl mercaptan, dimethyl disulfide, 2-methylthiophene, 3-methyl-thiophene, tetrahydrothiophene, 2-methyl tetrahydrothiophene, amyl mercaptan, 2-ethylthiophene, 2,5-dimethyl thiophene, 2,4-dimethyl thiophene, 2,3-dimethyl thiophene, 2-propyl sulfide, 3,4-dimethyl thiophene, diethyl disulfide, n-hexyl mercaptan, n-heptyl mercaptan and n-butyl sulfide. All the reagents are analytically pure and provided by Germany Fluka Chemi AG Inc. and Belgium Acros Organics Inc., with their purity being 98% - 99%. Sulfide standard solution was prepared with n-octane. Anhydrous magnesium sulfate was analytically pure, provided by Beijing Shuanghuan Reagent Factory and Tianjin Damao Chemical Reagent Factory. 93# gasoline oil was offered by the Service Stations of China University of Petroleum, Beijing.
2.2. Experimental Apparatus and Method
The thermal simulation experiment devices consist of a 200mL autoclave, gas circuit and a sample analysis system. The sample basket which is made of quartz glass with 10.0 g of MgSO4 was put into the reactor before vacuumed, then 5 mL of distilled water and 20 mL of 93# gasoline oil were fed into the autoclave through a feed regulator.
In the system of gasoline and magnesium sulfate, the pressure varied between 4.0 MPa - 12.0 MPa. The reactor was heated up to 340˚C directly and then to the final temperatures by a controlling program. The final temperatures were 450˚C, 475˚C, 500˚C, 525˚C and 500˚C, and the heating durations were 60 h, 50 h, 40 h, 30 h and 24 h, respectively. After each experiment, the basket with reaction products was removed out. The oil-water mixture was extracted out with a pipette, then oil and water were separated by employing a separatory funnel. The autoclave was flushed with 10 mL of distilled water each time until no solid existed when the water was mixed with 1 mol/L BaCl2 solution. Solid products, water separated from the oil-water mixture and elution water were heated to 120˚C in a drying box for 6 hours, then heated in a muffle oven at 550˚C for 2 hours. The solid products were measured by an electronic balance after weighed, following calculating conversions. Properties of the gasoil-solid 3-phase products were analyzed by some spectral analysis techniques including gas chromatography, microcoulometry, GC-PFPD, FT-IR and X-ray diffraction, respectively.
WK-2B microcoulometry was used to determine total sulfur content in natural gas and magnesium sulphate system. The entrance temperature of the furnace was 500˚C and exit temperature was 850˚C. The temperature of the gasification zone was 60˚C. The flow rates of air, nitrogen, and sample gas were 40 mL/min, 160 mL/min, and 30 mL/min, respectively.
Agilent 6890 GC equipped with a thermal conductivity detector (TCD) and a flame ionization detector (FID), and five mixed columns (capillary columns and packed columns) was used to analyze the gaseous products. The detector temperature was 250˚C. The temperature of the oven was heated to 100˚C at a heating rate of 5˚C/min after at 50˚C for 3 minutes, and then at 180˚C at a heating rate of 10˚C/min and the resident time was 3 min.
Gas chromatographic-pulsed flame photometric detective analysis was carried out on an Agilent 7683 GC directly coupled to an O.I. Analytical Model 5380 PFPD detector. The STAR 5.0 Chromatographic Workstation was offered by the Varian Company. The separation column was PONA column (50 m × 0.2 mm × 0.5 μm), the injection volume was 1.0 μL, and the split ratio was 30. The entrance temperature was 250˚C with a constant pressure (96.5 kPa) model. The original column temperature was 35˚C and was raised to 100˚C at a heating rate of 1.5˚C/min, then reached 250˚C at a heating rate of 10˚C/min and the resident time was 15 min. Nitrogen was employed as a carrier.
All spectral peaks were recorded from 4000 cm−1 to 400 cm−1 using the Nicolet FT-IR spectrometer. Each spectrum gave the average value of 32-times scanning with a resolution of 4 cm−1.
The products were mechanically crushed and ground as fine as <75 μm. X-ray diffraction (XRD) data were collected at room temperature from a SHIMADZU X-ray diffractometer under a voltage of 40kV, a current of 30 mA and a scanning speed of 2˚·min−1 with graphite monochromated CuKα radiation. The analytical parameters were: DS = 1˚, SS = 1˚, and RS = 0.3 mm.
3. Results
3.1. Analysis of the Gaseous Products
Gaseous products at the different reaction temperatures have a strong smell of rotten eggs. Lead acetate papers turned black when closed to the gas, which proved that hydrogen sulfide exists in the gas. Microcoulometry was employed to determine the total sulfur contents of gaseous products. Shown in Figure 1 is the relationship of total sulfur contents vs temperatures in the gaseous products. It is proved that the total sulfur contents increase with the rise of temperature.

Figure 1. Total sulfur contents of the gaseous products at different reaction temperatures.
The compositions of hydrocarbons in the gaseous products at different reaction temperatures are listed in Table 1. It can be seen that the composition is very complex. Besides saturated hydrocarbons (C1 - C6), there are also other unsaturated alkenes (C2 - C5) and non-hydrocarbons such as H2, CO and CO2. Saturated hydrocarbons with carbon numbers of 1 - 6, unsaturated alkenes with carbon numbers of 2 - 5 and H2 would probably originate from the oxidation of hydrocarbons by magnesium sulphate, or the thermal cracking of hydrocarbons. No CO2 was present in the original system, hence CO2 is one of the products of the reaction system. CO might be intermediate or came from the H2 deoxidization of CO2 under high temperatures.
Gas dryness coefficient CH4/(ΣCnH2n+2) is used to characterize the evolution of hydrocarbon gas distribution. As shown in Figure 2, the gas dryness coefficient and the content of CO2 increase with the rise of temperature. It is proved that the oxidation of hydrocarbons by magnesium sulphate intensified with the rise of temperature while the average molecular weight of hydrocarbon gases gradually decreased.
3.2. Analysis of Oil Phase Products
According to the standard samples, the types of sulfides in oil phase between 450˚C - 550˚C were detected and quantified by GC-PFPD. Qualitative research on oil phase sulfides was carried out in terms of the spectrum of standard sulfide and the experiential molecular formula
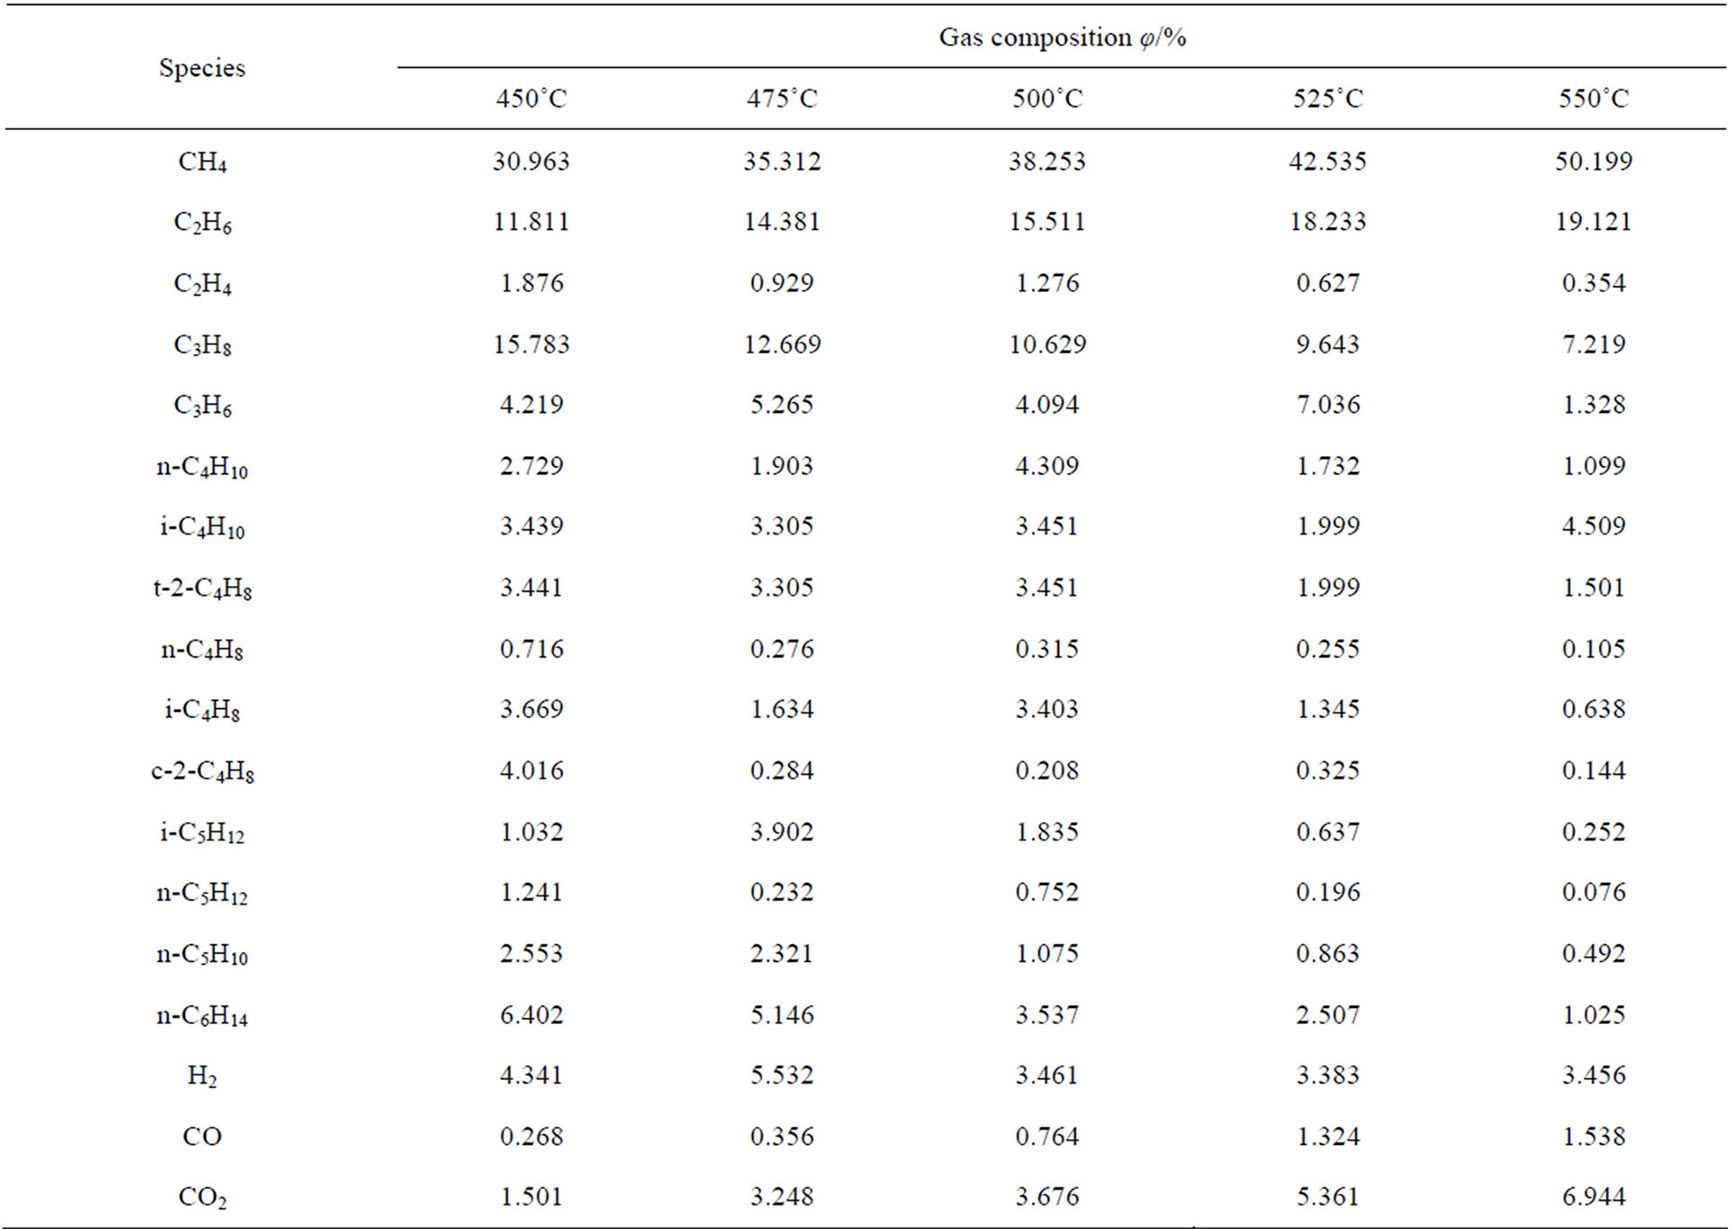
Table 1. The composition of hydrocarbons in the gaseous products at different reaction temperatures.
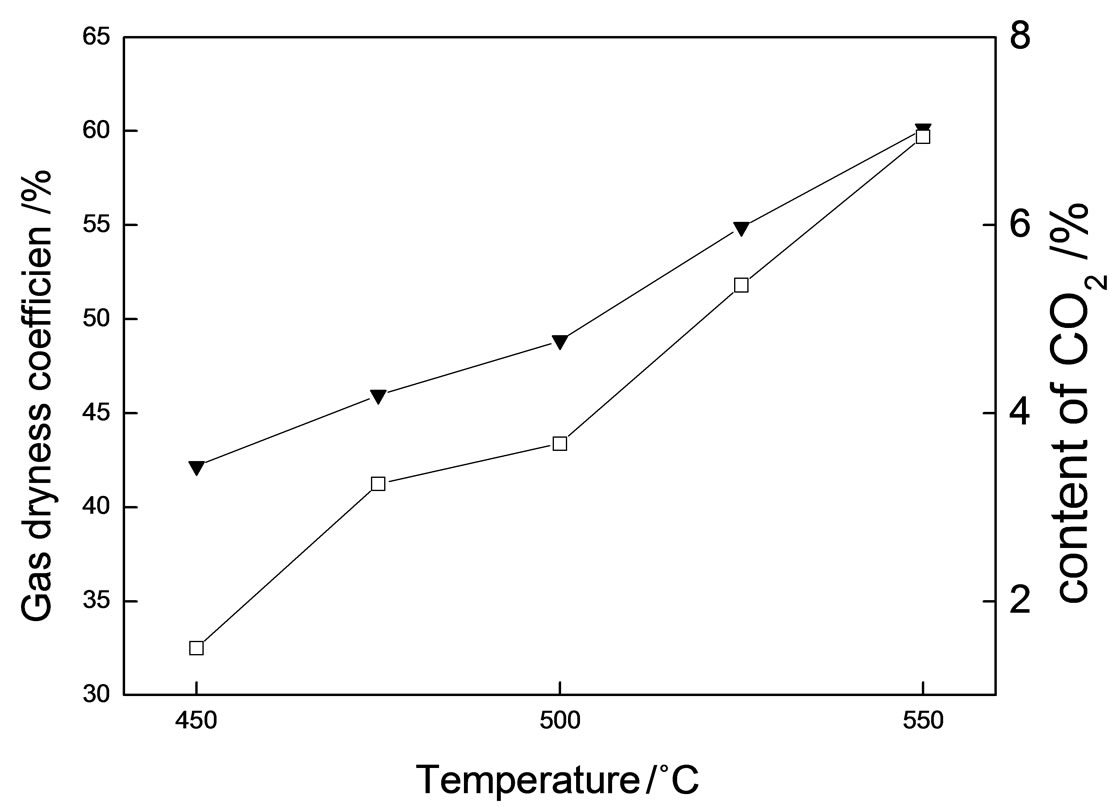
Figure 2. Gas dryness coefficient and contents of CO2 at different reaction temperatures.▼: Gas dryness coefficient; γ: CO2 content.
of sulfide, boiling point and the references [14,15]. It is shown that if a sulfide compound has fewer substituent groups or the substituent groups have a closer position, the retention time is always short. For thiophene series compounds, structures as adjacent substituents are always indicative of a long retention time. According to these principles, the retention time of organic sulfides was determined. PFPD is an equimolar detector which has no connection to the structures and types of sulfides, hence the standard curve of confirmative concentrations of sulfide was employed to define the sulfide contents in the oil phase. In this paper, 10 standard solutions with different sulfur contents were prepared in order to establish a standard curve of PFPD. In the preperation of the solutions 3-methylthiophene was used as the primary standard substance with octane as a solvent. Multi-level concentration correction and a 3-times-curve fitting for the experiment were used to obtaine a standard curve with a correlation coefficient of 0.999. The standard curve is y = 0.0014x3 − 0.0609x2 + 79.215x − 213.10, where y is the peak area, x is the mass fraction of sulfur, 10−6. Analysis results of sulfides in the oil phase at different reaction temperatures are given in Table 2, indicating that except for hydrogen sulfide, the reaction also produced a series of organic sulfides such as mercaptan, thioether, thiophene, etc.
The contents of thiophenes in the oil phase at different reaction temperatures are shown in Figure 3. It is shown that the contents of thiophenes are positively correlated with the temperature. With the rise of temperature, sulfur temded to be converted to thiophenes with a higher thermal stability. Shown in Figure 4 are changes in total sulfide contents in the oil phase are consistent to temperature, which coincides with the counterpart results of gaseous products.
3.3. Analysis of Solid Products
The FT-IR spectra of solid products at 450˚C afer calcination are shown in Figure 5. The peaks at 3351 cm−1 and 1639 cm−1 represent the stretching vibration and banding vibration of water, respectively. Besides, the
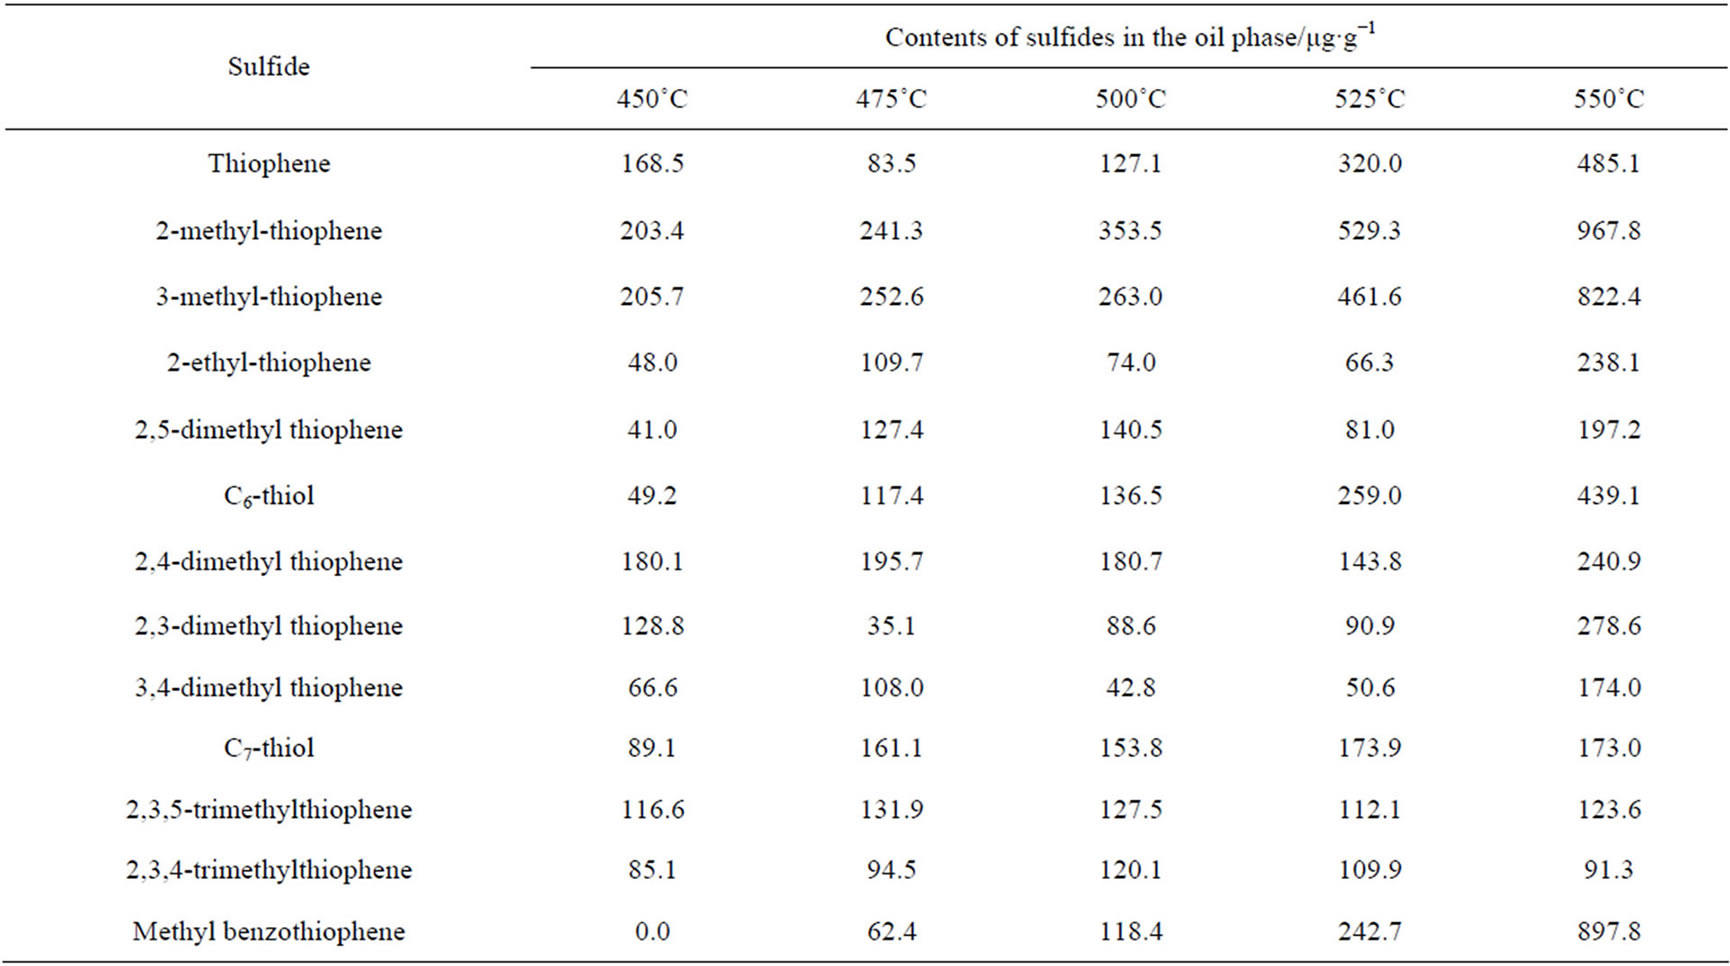
Table 2. Analysis results of sulfides in the oil phase at different reaction temperatures.
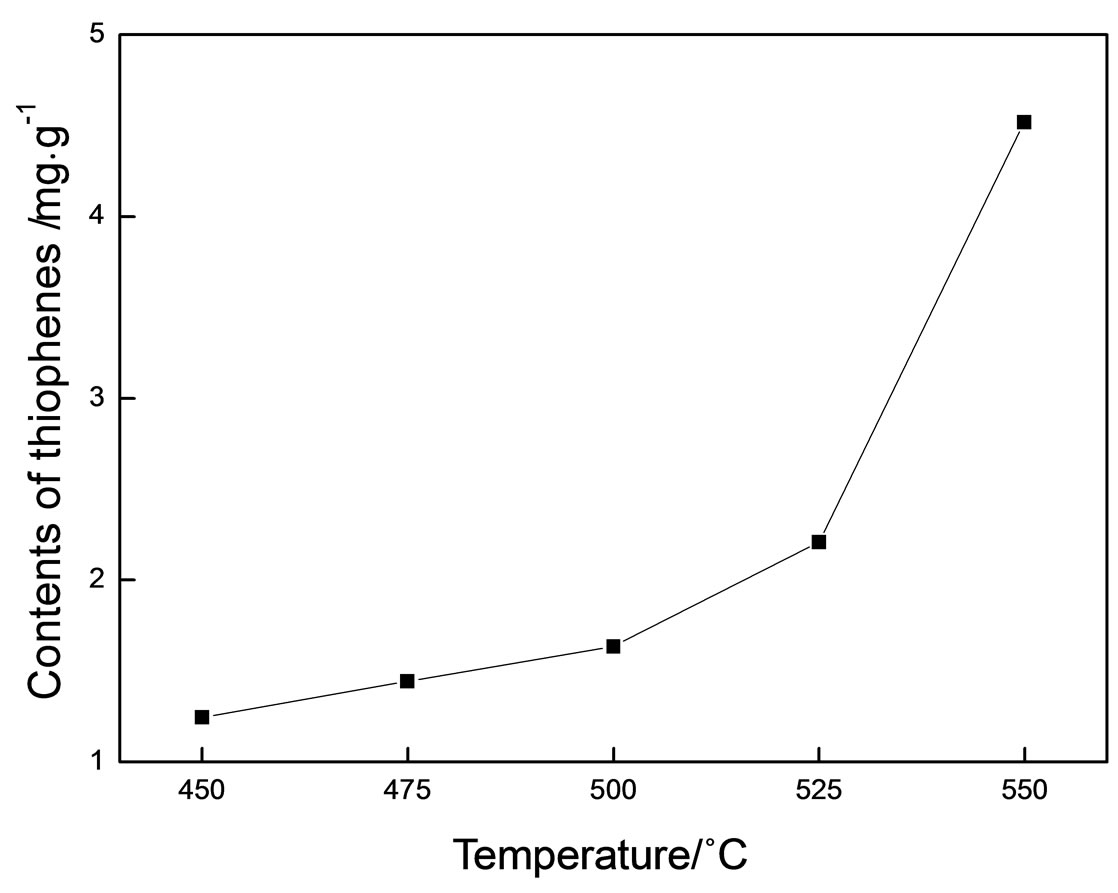
Figure 3. The contents of thiophenes in the oil phase at different reaction temperatures.
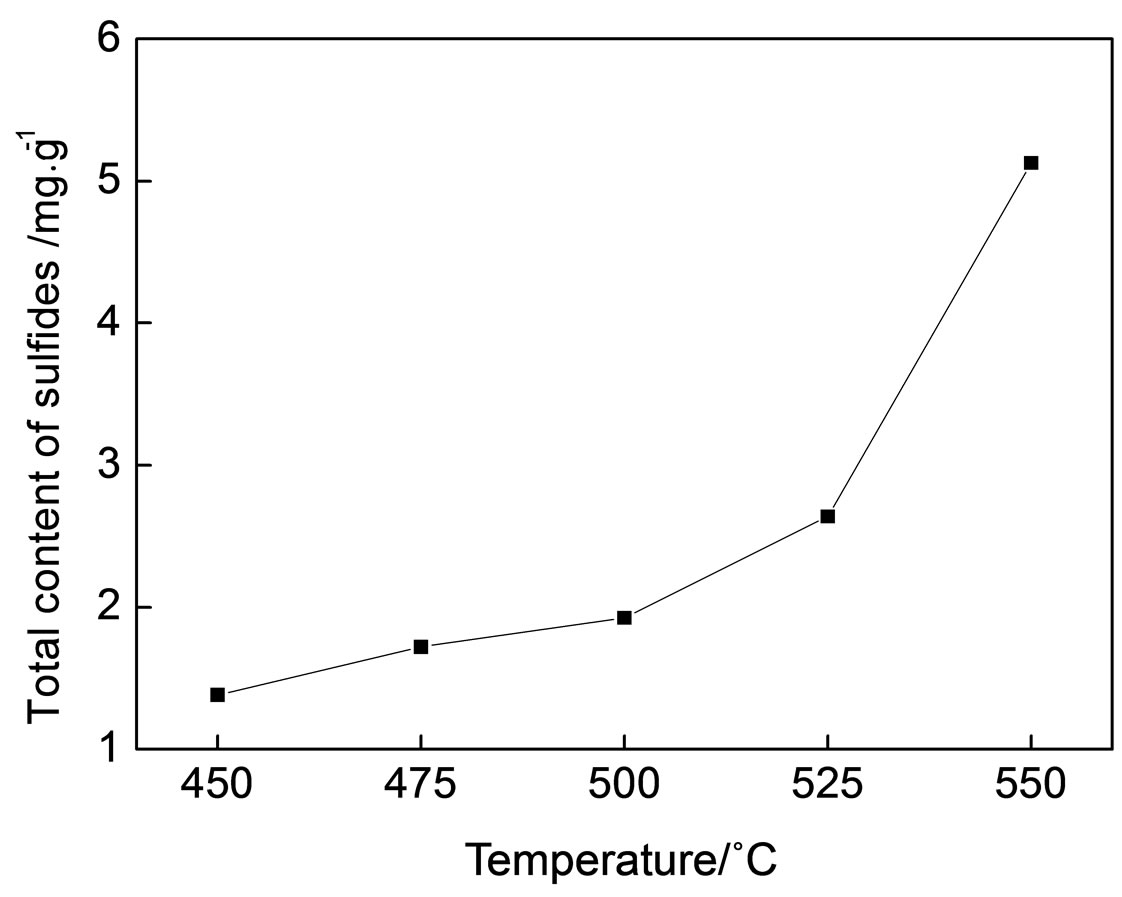
Figure 4. The total contents of sulfides in the oil phase at different reaction temperatures.

Figure 5. The FT-IR spectrum of the solid product after calcination at 450˚C.
peak at 1091 cm−1 is the stretching vibration band of  and the peak at 487 cm−1 is the band of characteristic frequency of Mg-O [16]. Thus, MgO is one of the products in solid phase. Shown in Figure 6 are the X-ray patterns of calcinated solid products at 450˚C. It is found that apart from residual MgSO4, MgO was also formed in the solid products, which coincides with the results of FT-IR.
Pure magnesium sulfate solution can be hydrolyzed to yield a small amount of magnesium hydroxide at high temperature. Magnesium hydroxide can be converted to magnesium oxide through dehydration. But this convertion process is effected by water contents and particularly external conditions. Only little water was used in this experiment, which is present mainly in the form of gaseous phase in the autoclave between 450˚C - 550˚C. Moreover, H2S generating during the reaction is an acidic gas which may inhibit hydrolysis of magnesium sulfate. No magnesium oxide appeared during the blank experiment in the system of magnesium sulfate-water, which demonstrates that the hydrolysis of magnesium sulfate can be neglected. Meanwhile, magnesium sulfate decomposition only occurs above 1124˚C. The temperature of the simulation experiment is far lower, so, magnesium oxide in the solid phase should mainly be the product of hydrocarbon reduction of magnesium sulfate.
According to the analysis results of the oil, gas and solid products, it is concluded that magnesium oxide, carbon, hydrogen sulfide, carbon dioxide, and thiols, thiophenes together with other organic sulfides are the main products of the reaction between gasoline and magnesium sulfate in an hydrous system.
3.4. Kinetics
The reaction between gasoline and magnesium sulfate

Figure 6. The X-ray patterns of the solid product after calcination at 450˚C.
was presumed as an n-order reaction, and its kinetic equation is written as follows [17].
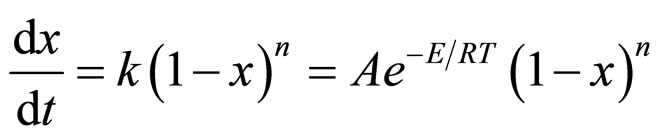 (1)
(1)
By integrating equation (1), for n ≠ 1, Equation (2) gives
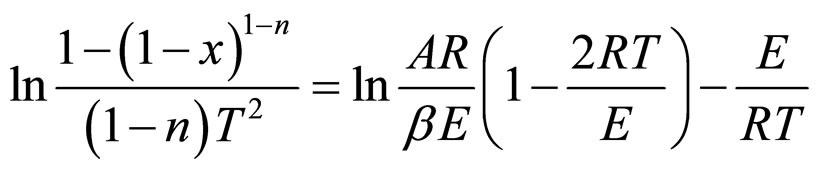 (2)
(2)
for n = 1, Equation (3) gives
 (3)
(3)
For n ≠ 1, drawing a linear regression line for
 vs 103/T. For n = 1, drawing a linear regression line for
  vs 103/T.
When the linear regression coefficient is closest to 1, the corresponding value of n is considered as the proper reaction order. The molar conversions are 28.1%, 29.6%, 33.2%, 33.7% and 35.2%, respectively. It is clear that the conversion increases with temperature. Therefore, temperature is the important factor affecting the reaction between gasoline and magnesium sulfate.
The linear regression coefficients for the reaction between gasoline and magnesium sulfate are listed in Table 3. It is shown that for n = 0, the linear regression coefficient is closest to 1. It hence can be concluded that the reaction between gasoline and magnesium sulfate is a zero-order reaction. Besides, it was found that when the mass of water was constant, the initial mass of MgSO4 or the volume of gasoline was variable, and the reaction conversion was barely changed. It is confirmed that the reaction is of zero order indeed. In other words, the reaction rate is only a function of temperature, neither affected by the concentrations of reactants nor by the system pressure.
Regression line for the reaction between gasoline and magnesium sulfate is shown in Figure 7. According to the slope and intercept of the regressed line, the activation energy E is calculated to be 68.9 kJ·mol−1 and the frequency factor A is 4.5 s−1.
4. Conclusions
In the system of gasoline and magnesium sulfate, when temperature is low, the reaction rate of the simulation experiment is so slow that little product is detected during such a short reaction time. According to the principle of temperature and time compensating each other, when the system temperature reaches 450˚C - 550˚C, the gasoline will react with magnesium sulfate in a hydrous system. From the early investigation of pyrolysis simulation for source rocks, it was known that for the reaction temperature in laboratory attained between 450˚C - 550˚C, the corresponding geological temperature is always between 160˚C - 200˚C. The results confirmed the possibility of the reaction between gasoline and magnesium sulfate.
In the presence of water, the products of the reaction are MgO, S, coke, H2S and CO2 and a series of organic sulfides such as mercaptans, thioethers and thiophenes. With increasing temperature, the oxidation effect of magnesium sulfate become more significant, the average molecular weight of hydrocarbon components dropped down and the overall trend of inorganic sulfur transformation into organic one was enhanced in the system. With the rise of temperature, sulfur tended to be converted to thiophenes with a higher thermal stability. The studies of kinetics have shown that the calculated activation energy and apparent frequency factor are 68.9 kJ·mol−1 and 4.5 s−1, respectively.
5. Acknowledgements
This work was finantially supported by the Open Project

Figure 7. Regression line for the reaction between gasoline and magnesium sulfate.

Table 3. Linear regression coefficients for the reaction between gasoline and magnesium sulfate.
of State Key Laboratory of Petroleum Resource and Prospecting (granted number 201107).
REFERENCES
- S. S. Hao, G. Gao and F. Y. Wang, “Marine Source Rock With High and over Maturity,” Petroleum Industry Press, Beijing, 1996.
- C. F. Cai, R. H. Worden, S. H. Bottrell, et al., “Thermochemical Sulphate Reduction and the Generation Of Hydrogen Sulphide and Thiols (Mercaptans) in Triassic Carbonate Reservoirs from the Sichuan Basin, China,” Chemical Geology, Vol. 202, No. 1-2, 2003, pp. 39-57. doi:10.1016/S0009-2541(03)00209-2
- B. K. Manzano, M. G. Fowler and H. G. Machel, “The Influence of the Thermochemical Sulfate Reduction on Hydrocarbon Composition in Nisku Reservoirs, Brazeau River Area, Alberta, Canada,” Organic Geochemistry, Vol. 27, No. 7, 1997, pp. 507-521. doi:10.1016/S0146-6380(97)00070-3
- W. L. Orr and J. S. D. Sinninghe, “Geochemistry of Sulfur in Petroleum Systems,” In W. L. Orr and C. M. White, Eds., Geochemistry of Sulfur in Fossil Fuels, American Chemical Society, Washington DC, 1990, pp. 2-29. doi:10.1021/bk-1990-0429.ch001
- T. G. Powell and R. W. MacQueen, “Precipitation of Sulfide Ores and Organic Matter: Sulfade Reactions at Pine Point, Canada,” Science, Vol. 224, No. 4644, 1984, pp. 63-66. doi:10.1126/science.224.4644.63
- D. J. S. Sinninghe, W. I. C. Rijpstra, D. van Kock, et al., “Quenching of Labile Functionalized Lipids by Inorganic Sulfur Species: Evidence for the Formation of Sedimentary Organic Sulfides at the Early Stages of Diagenesis,” Geochimica et Cosmochimica Acta, Vol. 53, 1989, pp. 1343-1355. doi:10.1016/0016-7037(89)90067-7
- A. Vairavamurthy and K. Mopper, “Geochemical Formation of Organosulphur Compounds (Thiols) by Addition of H2S to Sedimentary Organic Matter,” Nature, Vol. 329, No. 6140, 1987, pp. 623-625. doi:10.1038/329623a0
- Y. Q. Xia, Q. X. Meng, H. Y. Wang, et al., “The Simulation of the Formation of Benzothiophene Series Compounds and Their Significance,” Acta Sedimentologica Sinic, Vol. 17, No. 1, 1999, pp. 127-129.
- Y. Q. Xia, C. J. Wang, Q. X. Meng, et al., “The Simulation on the Mechanism of Formation of Thiopheneseries Compounds,” Geochimica, Vol. 28, 1999, pp. 393-396.
- Y. Q. Xia, C. J. Wang, Q. X. Meng, et al., “The Simulation of the Formation of Condensed Nucleus and Polycyclic Aromatic Hydrocarbon,” Acta Sedimentologica Sinic, Vol. 16, No. 2, 1998, pp. 1-4.
- S. Hanin, P. Adam, I. Kowalewski, et al., “Bridgehead Alkylated 2-Thiaadamantanes: Novel Markers for Sulfurisation Processes Occurring under High Thermal Stress in Deep Petroleum Reservoirs,” Chemical Communications, Vol. 16, 2002, pp. 1750-1751. doi:10.1039/b203551k
- R. N. Leif and B. R. T. Simoneit, “The Role of Alkenes Produced during Hydrous Pyrolysis of a Shale,” Organic Geochemistry, Vol. 31, No. 11, 2000, pp. 1189-1208. doi:10.1016/S0146-6380(00)00113-3
- H. C. Seewald, “Aqueous Geochemistry of Low Molecular Weight Hydrocarbons at Elevated Temperatures and Pressures: Constraints from Mineral Buffered Laboratory Experiments,” Geochimica et Cosmochimica Acta, Vol. 65, No. 10, 2001, pp. 1641-1664. doi:10.1016/S0016-7037(01)00544-0
- A. Stumpf, K. Tolvaj and M. Juhasz, “Detailed Analysis of Sulfides in Gasoline Range Petroleum Products with High-Resolution Gas Chromatography-Atomic Emission Detection Using Group-Selective Chemical Treatment,” Journal of Chromatogr A, Vol. 819, No. 1-2, 1998, pp. 67-74. doi:10.1016/S0021-9673(98)00444-0
- Y. T. Yang, H. Y. Yang, B. N. Zong, et al., “Determination and Distribution of Sulfides in Gasoline by Gas Chromatography-Atomic Emission Detector,” Chinese Journal of Analytical Chemistry, Vol. 31, No. 10, 2003, pp. 1153-1158.
- W. S. Peng and G. K. Liu, “The Charts of the Infrared Spectra of the Minerals,” Science Press, Beijing, 1982.
- J. M. Fu and K. Z. Qin, “Geochemistry of Kerogen,” Guangdong Technology Press, Guangzhou, 1995.
Nomenclature
A Apparent frequency factor, sec−1
k Reaction rate constant, sec−1
n Reaction order
R Gas factor, 8.314 J·mol−1·K−1
T Absolute tempreture, ˚C
x Reaction conversion,
dx/dt Reaction rate
NOTES
*Corresponding author.