Optics and Photonics Journal
Vol.3 No.4(2013), Article ID:35625,5 pages DOI:10.4236/opj.2013.34044
AFM Analysis on Polymer Optical Micro-Resonators: Investigation on Quality Factor Origin
1Institute of Physics of Rennes, UMR CNRS 6251, University of Rennes 1, Campus Beaulieu, Rennes, France
2Institut Universitaire de France-IUF, Paris, France
Email: bruno.beche@univ-rennes1.fr
Copyright © 2013 David Pluchon et al. This is an open access article distributed under the Creative Commons Attribution License, which permits unrestricted use, distribution, and reproduction in any medium, provided the original work is properly cited.
Received May 6, 2013; revised June 12, 2013; accepted July 16, 2013
Keywords: Optical Micro-Resonators; Quality Factor Origin; Atomic Force Microscopy; Surface Analysis; Scattering Loss
ABSTRACT
This paper deals with the surface analysis of spherical polymeric optical micro-resonators in order to correlate surface defects with optical characteristics. Atomic force microscopy was used on structures to determine surface quality, which is the main origin of optical scattering losses. Surface morphologies were numerically treated to enable a relevant investigation on surface parameters such as root mean square (RMS) roughness (30.1 +/− 3.0 nm) or correlation length (few microns) necessary to express optical quality factors. A statistical analysis was conducted for calibration of these parameters as a function of cavities’ diameter. Results are in perfect agreement with spectral analyses performed in parallel on others structures. This comparison highlights the main role of scattering losses on quality factor origin.
1. Introduction
Polymers materials [1-3] and micro-resonators are versatile devices that arouse many interests for applications in optics and telecommunications. Optical feature of such devices is characterized by the quality factor, Q. It provides information on storage capacity in term of energy, is directly linked to optical losses and has various origins but mainly limited by scattering phenomenon. Whereas inorganic material such as CaF2 or Si can reach very high Q-values around 109, polymeric micro-devices have more recently aroused a great interest for biological sensors applications [4,5]. Various origins can be assigned to Q-values decrease but in such micro-devices (smaller than 300 µm) the main limit of Q-factor is assigned to the scattering phenomenon [6,7]. In this paper, investigated resonators refer to polymeric (NOA 89, Northland Optical Adhesive 89) spheres of several tens of microns realized by micro-fluidics [7]. Such fabrication technique appears as a low-cost, flexible and quick way to generate spherical micro-cavities. Here we aim to determine the optical losses mechanisms in order to evaluate and calibrate the optical performances.
Resonant structures are based on optical modes called Whispering Gallery Modes (WGM) confined along the edges by total internal reflection [8]. So, getting information on surface aspect enables quality factor evaluation [9-11]. This consideration can be easily understood using geometric optics vision. Indeed, surface defects create a larger range of potential paths for resonant wavelengths directly increasing FWHM (Full Width at Half Maximum) of resonant peaks closely related to Q-factor. Several approaches exist to evaluate optical losses. However due to resonators morphology, it becomes difficult to evaluate the scattering light using common techniques such as scatterometer [12]. Also, the relevant idea consists to evaluate the origin of scattering phenomenon directly investigating surface properties. Among structural surfaces analysis techniques, atomic force microscopy (AFM) appears as an appropriate tool to quantitatively inform on surface texture [13]. Moreover, this technique offers a selective mean to evaluate scattering losses without taking into account others optical losses mechanisms.
2. AFM Measurements and Treatments
For a given R-radius sphere at a fixed excitation wavelength λ, quality factor associated to scattering, QSCATT, can be seen as the major contribution to the whole quality factor Q=λ/δλ (where δλ corresponds to the FWHM of resonance peaks). QSCATT is so directly linked to surface texture that can be determined by AFM in term of correlation length LC and root mean square (RMS) roughness hRMS. The first parameter corresponds to a length that informs on distribution roughness while the RMS roughness informs on the standard deviation of the mean height [14]. Also, QSCATT is expressed as Equation (1) [15]:
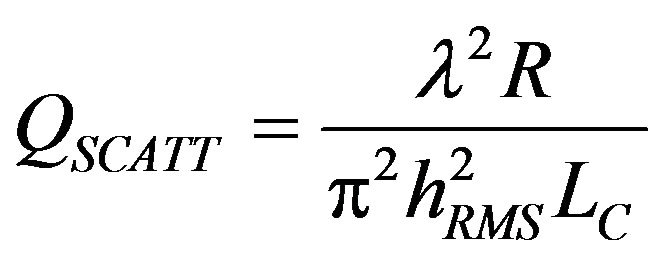 (1)
(1)
Two origins can be associated to scattering optical losses: environmental dust pollution and surface asperities due to the fabrication technique. To avoid the contribution of the first one, spherical cavities were preserved in silicone oil. AFM scanning process was performed using soft tapping mode with a specific silicon point probe (force constant: 1.2 - 29 N/m, type: PPP– NCSTR-SPL, NANOSENSORS) to operate at a constant scan rate and to permit a valid comparison between different cavities. The scanning surface, located on top of cavities, was adjusted following the cavities size in order to consider the same percentage of investigated surface. During measurements, the sample/tip distance was fixed to define the condition of soft tapping. Also, topographic pictures are obtained in term of deflection amplitude of cantilever during tip movement (Figure 1).
Due to the spherical morphology, the tip inclination angle fluctuated up to 10 degree. Then, a numerical posttreatment was applied on each topographic picture to be correctly analyzed using an appropriate software (WSxM 5.0, copyright Nanotec Electronica). Indeed, only flattened pictures give relevant data on surface but inherent sphericity is in first time treated as a roughness by the software. To overcome this problem a “Flatten using paths” treatment was applied on AFM pictures. It consists to draw a mesh defining lines of same height. Also with a sufficient number of lines, it becomes possible to subtract the parabolic plan associated with that of a sphere. As shown on Figure 1, topographic data are not affected during this preliminary process allowing a valid surface texture analysis.
The WSxM software is able to perform a roughness analysis which directly informs on RMS roughness but also on surface kurtosis and surface skewness. Both surface parameters (dimensionless numbers) respectively refer to the third and fourth moments of the roughness distribution function. Surface skewness (or asymmetry coefficient) informs on distribution shape and is equal to 0 for a symmetric function. Surface kurtosis (or flattening coefficient) measures the flattening of a distribution and is equal to 3 for a Gaussian distribution model (see Table 1).
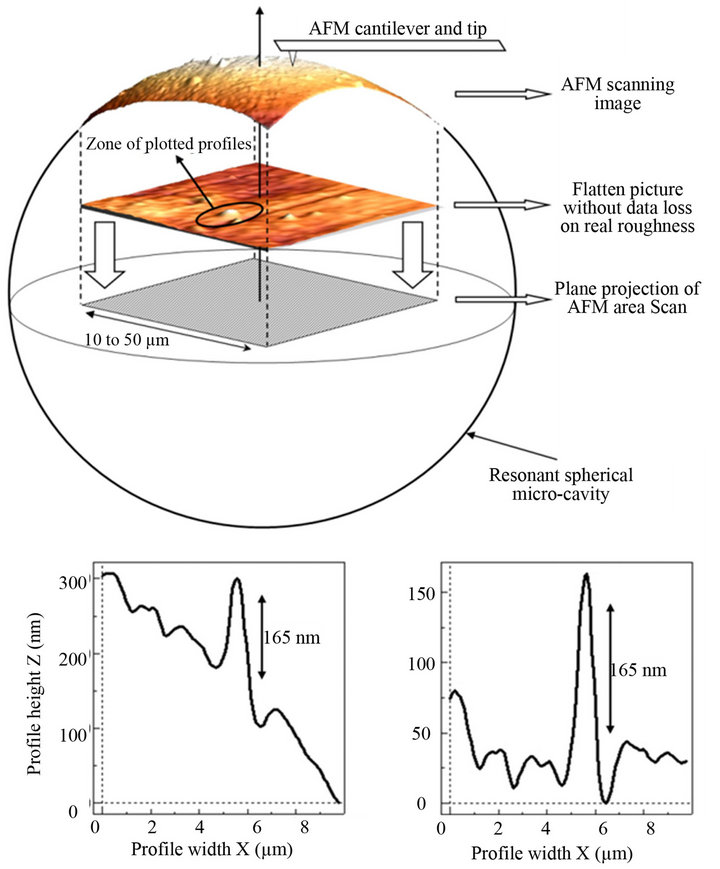
Figure 1. AFM analysis principle and WSxM flatten treatment on original surface picture of one micro-cavity. Plotted profiles along X-axis on pre-treatment (left) and posttreatment (right) demonstrate preservation of roughness data during flattening process.
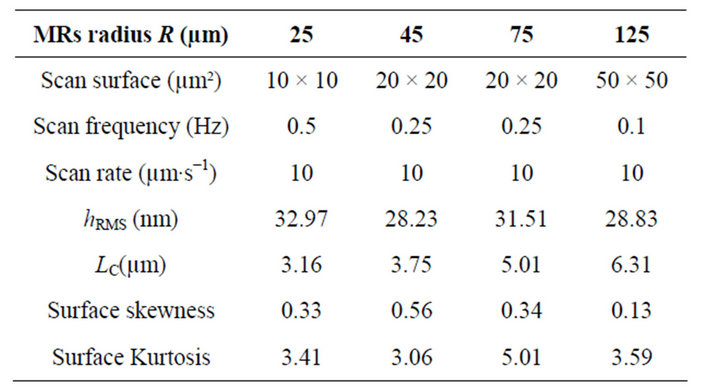
Table 1. AFM scanning properties and statistical surface parameters of various sizes micro-cavities.
To completely characterize surface roughness, it is essential to evaluate the correlation length LC. The technique consists to examine the surface pictures in a 2D reciprocal frequency space using a Fourier transforms to then plot the power spectral density (PSD). This one is a real 1D representation of the reciprocal space allowing determination of periodicities in real space. Surface roughness present a stochastic symmetric Gaussian distribution (Table 1) so remarkable changes of PSD are directly related to characteristic features sizes in real space. Also, correlation length was determined using the ABC model of k-correlation [16] where B-parameter corresponds to correlation length associated to behaviour change in the PSD curves (Figure 2).
All PSD curves of cavities present the same characteristic shape corresponding to a flat part in lower part of the spatial frequency spectrum followed by a linear slope in higher frequency domain. The random aspect inherent to these measures has necessitated a statistical analysis on each studied resonator by reiterating the study on different places to ensure the relevance of results.
Also evolutions of both LC and hRMS parameters plotted in Figure 3 presented a 10% standard deviation (Origin® software estimation).
The topographic study allows determination of surfaces parameters interfering in the QSCATT expression. Also to determine the quality factor of any spherical cavity, the evolution of both parameters according to the R-radius has been plotted (Figure 3). It appears that
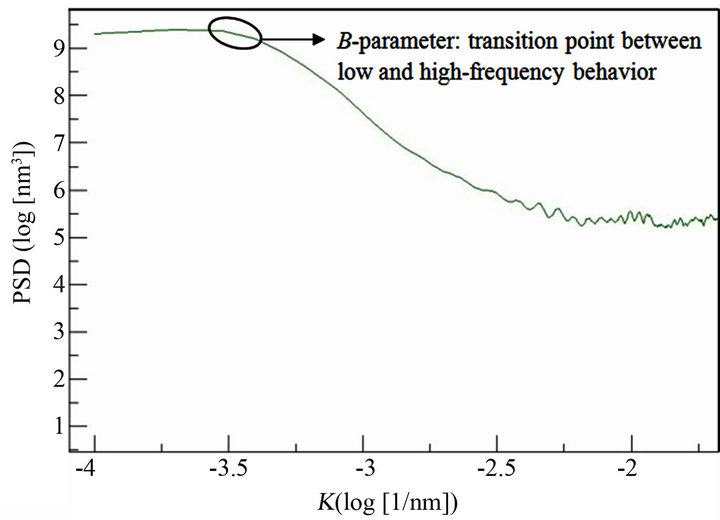
Figure 2. Power spectral density (PSD) curve of a 25 µm radius cavity. B-parameter corresponds to correlation length is located in the transition behavior between low and high-frequency.
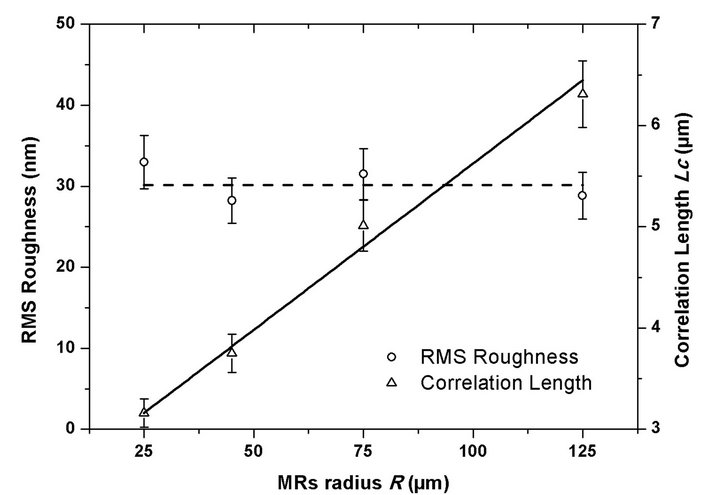
Figure 3. Correlation length and RMS roughness estimation for various sizes cavities. RMS roughness adopts a linear evolution whereas correlation length remains constant (30.14 nm) whatever micro-resonators size.
correlation length LC adopts a linear behaviour with the size whereas hRMS remains constant (30.1 nm ± 3.0 nm). The first behaviour reports that defects distribution over the surface is mainly governs by surface energies whereas the second one indicates that the size of asperities (associated to fabrication technique) remains constant. Quality factors associated to AFM measurements are presented in Table 2.
3. Comparison with Optical Measurements
For comparison with AFM measurements, optical spectral analyses were performed on resonant structures of equivalent dimensions. Using a broad band source (BBS) emitting in near infrared (ILX Lightwave, LDM 49 - 80), spherical cavities were optically excited under grazing incidence. For this, a set of lens was used to focus the light beam near the equator of the sphere. Investigation was then led on this incident beam after excitation using optical spectral analyzer (OSA), placed at the end of the optical bench. A typical resonances spectrum is presented in Figure 4. As mentioned above, WGM are confined modes propagating in circle along the inner surface. Also, to satisfy the condition of phase matching after each cycle, resonant wavelengths, λ, are defined as an integer multiple of resonators perimeter. Under WGM excitation, light beam interacts with the sphere following the formula 2πR = l × λ, where l is an integer and R refers to the
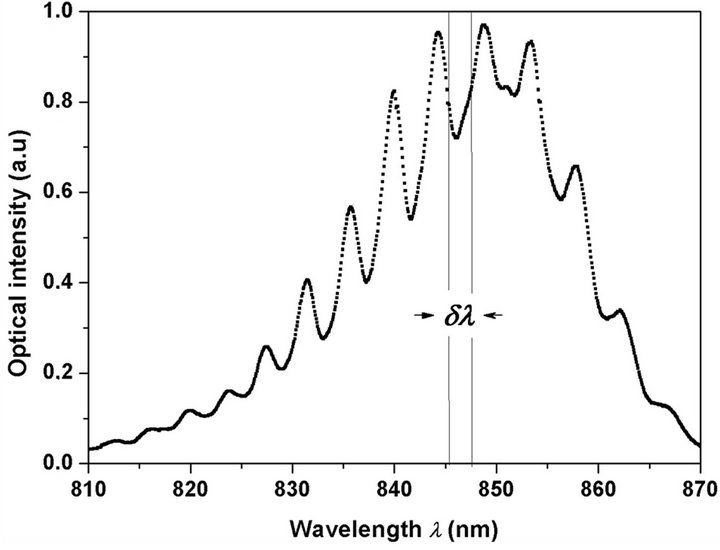
Figure 4. Optical spectrum of a 37 µm diameter spherical resonator with a Full width at half maximum, δλ = 2.25 nm.
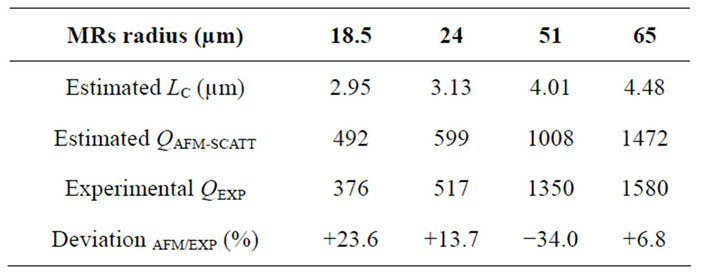
Table 2. Estimated correlation lengths LC and quality factors QAFM-SCATT compared to optical measurements QEXP for various sizes micro-cavities.
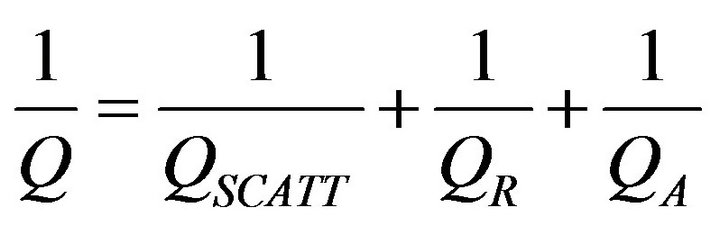
cavities’ radius. From the resonance spectra, quality factors are evaluated as Q = λ/δλ. As mentioned above, it exists several intrinsic losses mechanisms determined by three components of the global quality factor Q according to
 (2)
(2)
where QSCATT, QR and QA are quality factors respectively related to scattering losses, radiation losses and absorption losses. However, as above-mentioned for typical size of resonators tested here, radiation together with absorption losses can be neglected, so following Equation (2), the global Q-factor can be associated to QSCATT.
Optical measurements have been tested for a series of cavities with various radii enabling Q-factor estimation for comparison with the ones from AFM measurements. Results presented in Table 2 highlight a good agreement between both measurement techniques.
Standard deviation associated to LC and RMS roughness measurements directly act on estimated Q-values. Taking into account such data errors, results accuracy was calculated using Equation (1) and variations measurements on each relevant parameter:
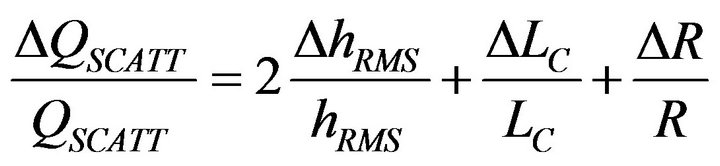 (3)
(3)
Also, taking into account the accuracy own to the statistical analysis (evaluated around 35%) experimental results presented in Table 2 perfectly include the estimation range of Equation (3) and validate the correlation between both Q-factors measurements.
4. Conclusion
Statistical AFM analyses together with a flattening surface treatment were conducted to determine RMS roughness and correlation length interfering in scattering Qfactor expression. Calibration of such parameters was developed according to optical micro-resonators dimensions in order to define the QSCATT evolution. For comparison, Q-factors measurements were performed by optical spectral analysis. Taking into account standard deviation of surface measures, both studies have revealed a good agreement. This study clearly highlights the scattering losses effects on Q-factor performances of organic micro-resonators. Such an experimental study allows a quick and valid prediction of optical performances correlated to surface roughness by releasing tedious optical injections.
REFERENCES
- P. Labbe, A. Donval, R. Hierle, E. Toussaere and J. Zyss, “Electro-Optic Polymer Based Devices and Technology for Optical Telecommunication,” Comptes Rendus Physique de l’Académie des Sciences, Vol. 3, No. 4, 2002, pp. 543-554.
- F. Michelotti, A. Belardini, M. C. Larciprete, M. Bertolotti, A. Rousseau, A. Ratsimihety, G. Schoer and J. Muller, “Measurement of the Electro-Optic Properties of Poled Polymers at 1.55 Micron by Means of Sandwich Structures with Zinc Oxide Transparent Electrode,” Applied Physics Letters, Vol. 83, No. 22, 2003, pp. 4477-4480. doi:10.1063/1.1622798
- B. Bêche, N. Pelletier, E. Gaviot and J. Zyss, “Single Mode TE00-TM00 Optical Waveguides on SU-8 Polymer,” Optics Communications, Vol. 230, No. 1-3, 2004, pp. 91- 94. doi:10.1016/j.optcom.2003.11.016
- F. Vollmer and S. Arnold, “Whispering-Gallery-Mode Biosensing: Label-Free Detection down to Single Molecules,” Nature Methods, Vol. 5, No. 7, 2008, pp. 591-596. doi:10.1038/nmeth.1221
- A. François and M. Himmelhaus, “Optical Biosensor Based on Whispering Gallery Mode Excitations in Clusters of Microparticles,” Applied Physics Letters, Vol. 92, No. 14, 2008, pp. 141107-141110. doi:10.1063/1.2907491
- P. Rabiei and W. H. Steier, “Polymer Microring Resonators,” World Scientific Publishing, Singapore, 2004, pp. 319-366.
- A. B. Matsko, A. A. Savchenkov, V. S. Llchenko and L. Maleki, “Optical Gyroscope with Whispering Gallery Mode Optical Cavities,” Optics Communications, Vol. 233, No. 1-3, 2004, pp. 107-112. doi:10.1016/j.optcom.2004.01.035
- N. Huby, D. Pluchon, N. Coulon, M. Belloul, A. Moreac, E. Gaviot, P. Panizza and B. Bêche, “Design of Organic 3D Microresonators with Microfluidics Coupled to ThinFilm Processes for Photonic Applications,” Optics Communications, Vol. 283, No. 11, 2010, pp. 2451-2456. doi:10.1016/j.optcom.2010.01.065
- L. Collot, V. Lefèvre-Seguin, M. Brune, J. M. Raimond and S. Haroche, “Very High-Q Whispering-Gallery Mode Resonances Observed on Fused Silica Microspheres,” Europhysics Letters, Vol. 23, No. 5, 1993, pp. 327-334. doi:10.1209/0295-5075/23/5/005
- D. W. Vernooy, V. S. Ilchenko, H. Mabuchi, E. W. Streed and H. J. Kimble, “High-Q Measurements of Fused-Silica Microspheres in the Near Infrared,” Optics Letters, Vol. 23, No. 4, 1998, pp. 247-249. doi:10.1364/OL.23.000247
- M. Borselli, K. Srinivasan, P. E. Barclay and O. Painter, “Rayleigh Scattering, Mode Coupling, and Optical Loss in Silicon Microdisks,” Applied Physics Letters, Vol. 85, No. 17, 2004, pp. 3693-3695. doi:10.1063/1.1811378
- I. M. White, N. M. Hanumegowda, H. Oveys and X. Fan, “Tuning Whispering Gallery Modes in Optical Microspheres with Chemical Etching,” Optics Express, Vol. 13, 2005, pp. 10754-10759. doi:10.1364/OPEX.13.010754
- S. Jakobs, A. Duparré and H. Truckenbrodt, “AFM and Light Scattering Measurements of Optical Thin Films for Applications in the UV Spectral Region,” International Journal of Machine Tools and Manufacture, Vol. 38, No. 5-6, 1998, pp. 733-740. doi:10.1016/S0890-6955(97)00125-9
- W. Z. Wang, H. Chen and Y.-Z. Hu, “Effect of Surface Roughness Parameters on Mixed Lubrication Characteristics,” Tribology International, Vol. 39, 2006, pp. 522-527. doi:10.1016/j.triboint.2005.03.018
- M. L. Gorodetsky, A. A. Savchenkov and V. S. Ilchenko, “Ultimate Q of Optical Microsphere Resonators,” Optics Letters, Vol. 21, No. 7, 1996, pp. 453-455. doi:10.1364/OL.21.000453
- R. Gavrila, A. Deniscu and D. Mardare, “A Power Spectral Density Study of Thin Films Morphology Based on AFM Profiling,” Romanian Journal of Information Science and Technology, Vol. 10, No. 3, 2007, pp. 233-241.