Optics and Photonics Journal
Vol.2 No.3A(2012), Article ID:23302,4 pages DOI:10.4236/opj.2012.223033
Growth and Characterization of Ethylene Diamine Tetra Acetate (EDTA) Doped Lithium Sulphate Monohydrate Crystals
1AVVM Sri Pushpam College, Thanjavur, India
2Government Arts College (Autonomous), Kumbakonam, India
Email: *crraja_phy@yahoo.com
Received May 21, 2012; revised June 24, 2012; accepted July 7, 2012
Keywords: Nonlinear Optical Crystal; Growth from Solution; Characterization; Semi Organic Material
ABSTRACT
Nonlinear optical single crystals of Ethylene Diamine Tetra Acetate (EDTA) doped lithium sulphate monohydrate are successfully grown by using slow evaporation technique at room temperature with double distilled water as solvent. In order to know its suitability for device fabrication, different characterization analyses have been performed. The single crystal X-ray diffraction (XRD) and powder X-ray diffraction methods are used for identifying the structural parameters of grown crystals. It is found that the addition of dopant doesn’t change the crystal structure. The range and percentage of optical transmission as well as absorption are ascertained by recording UV-Vis-NIR spectrum. No absorption in the entire visible region implies that it is a potential candidate for optoelectronic applications. The modes of vibration of different groups present in the crystals are identified by FT-IR technique. To understand the thermal properties, thermo gravimetric and differential thermal analyses (TGA & DTA) were carried out. The melting point was confirmed by differential scanning calorimetric (DSC) analysis. The amount of dopant included into the crystals was estimated by colorimetric method. The second harmonic generation efficiency measured by Kurtz powder technique is 0.53 times that of potassium dihydrogen orthophosphate.
1. Introduction
The ideal material that could have potential applications in non-linear optical (NLO) devices should possess the combination of large non-linear figure of merit for frequency conversion, high laser damage threshold, fast optical response time, wide phase matchable angle, architectural flexibility for molecular design and morphology, optical transparency and high mechanical strength [1-4]. Compared with inorganic NLO materials, organic materials may fulfill many of these requirements, but there are also some drawbacks with organic NLO materials such as environmental stability, poor chemical and mechanical stability, red-shift of the cut-off wavelength, low laser damage thresholds and poor phase matching properties [5-7]. In order to overcome these drawbacks and improve the properties, the growth of semi-organic crystals has nowadays come into prominence. The semi organic crystals have some advantages such as higher second order optical non-linearities, short transparency cut-off wavelength and stable physio-chemical performance over the traditional inorganic and organic crystals [8,9]. For greater Second Harmonic Generation (SHG) efficiency, one requires highly polarizable molecular system having asymmetric charge distribution in the molecule [10,11]. Since there is a large demand for crystals because of the revolution in electronic industries, it is required to synthesize new NLO materials and improve the properties of the existing materials. Considering all the above mentioned facts, ethylene diamine tetra acetate (EDTA) doped lithium sulphate monohydrate single crystals have been synthesized and grown moderately at low cost.
Nearly hundred years ago, Groth (1908) had described the lithium sulphate monohydrate Li2SO4·H2O, with its monoclinic point group 2 [11]. It has remarkable piezo electric and electro-optic properties. The crystal is also having high pyroelectric coefficient among the group of non-ferroelectric polar crystals [12,13]. The dopant EDTA is an artificial amino acid and it usually binds to a metal cation through its two amines and four carboxylates, that is, (4 oxygen atoms from carboxylate groups and 2 nitrogen atoms from amino groups) [14,15]. In this work, the growth and characterization of EDTA doped lithium sulphate monohydrate crystals by slow evaporation technique are reported, as no reports are available on the growth and characterization of the title crystal. Hereafter, the grown semi organic crystals are named as ELSMH (EDTA doped Lithium Sulphate Monohydrate).
2. Experimental Technique
Selecting a Template
EDTA doped lithium sulphate monohydrate (ELSMH) single crystals were grown from analar grade lithium sulphate monohydrate and ethylene diamine tetra acetate. Using doubly distilled water, the super saturated lithium sulphate monohydrate was prepared. The parent and dopant (lithium sulphate monohydrate, EDTA) were added in the ratio 1:P, where P = 0.01, 0.02, 0.03, 0.04 and 0.05 with pH = 5.0, 5.3, 5.6 and 5.9 and respectively. The pH variations were carried out using dilute sulphuric acid. The solution was filtered using filter paper and tightly closed for controlled evaporation of the solvent. Slow evaporation of the solvent produced ELSMH crystals in a time span of 27 - 30 days. Good transparent harvested single crystals are shown in Figure 1.
When the solution is at pH 5.0 and parent dopant molar ratio is 1:0.01, it is observed that the crystal growth rate and the quality of the crystal are much better. It is found that pH value of the solution has a strong effect on the formation of ELSMH crystals [16]. The minute amounts of EDTA can effectively suppress the impurities and promote the crystal quality. Higher dopant concentration may lead to the formation of structural grain boundaries, which in turn may lead to deterioration of crystal perfection. The observed results are in good agreement with the reported observations [17-20].
3. Results and Discussion
3.1. X-Ray Diffraction Studies
The BRUKER NONIUS CAD4 single crystal X-ray diffractometer was used to find the lattice parameters of the grown crystal. Powder XRD pattern was recorded using Rich-Seifert powder diffractometer with CuKa radiation (l = 1.5405 Å) and it is shown in Figure 2. The single crystal XRD result confirms the grown ELSMH crystal belongs to the monoclinic system with the lattice parameter values are: a = 5.457(3) Å, b = 4.874(1) Å, c = 8.149(3) Å, V = 216.74 Å3, b = 107.32˚.
The lattice parameters from the powder XRD pattern were calculated with the help of the computer program, TJB Holland and SATRED FERN 1995. The lattice parameters of both powder XRD and single crystal XRD of the grown ELSMH are shown in Table 1. The observed
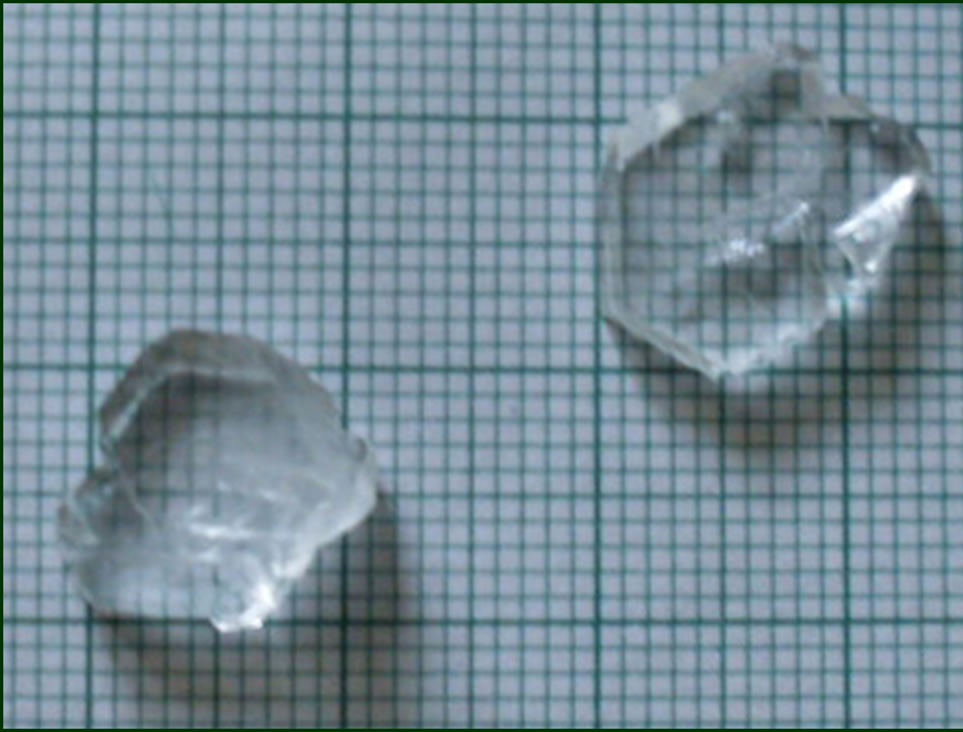
Figure 1. As grown ELSMH crystal.
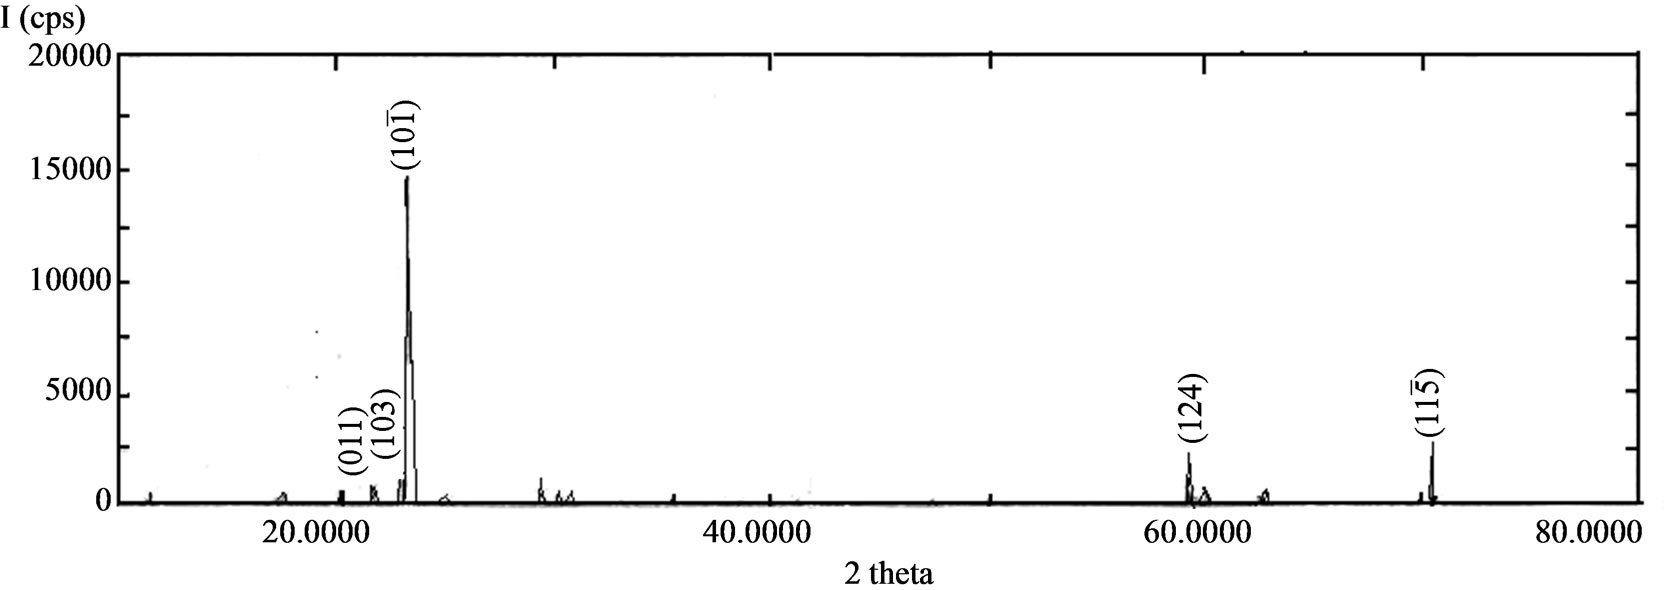
Figure 2. Powder XRD pattern of ELSMH crystal.
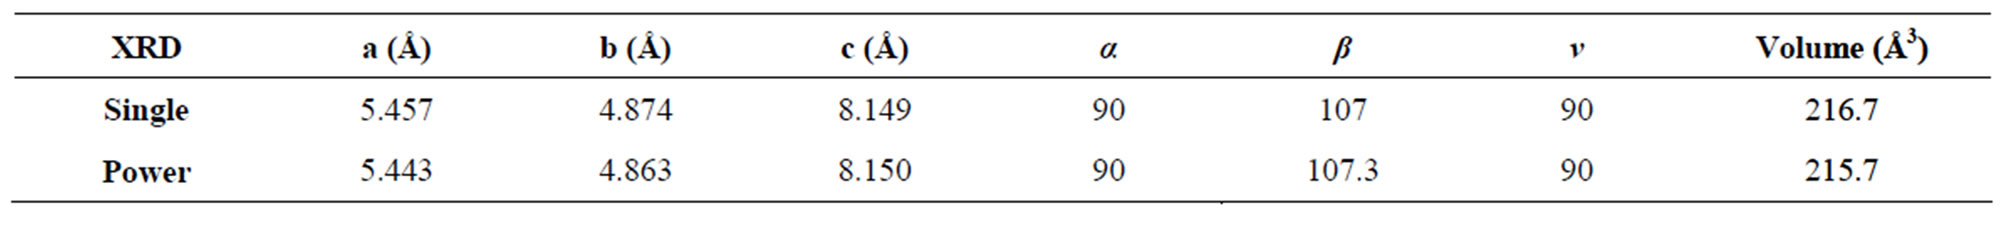
Table 1. Lattice parameters of ELSMH crystal.
2q, d and calculated hkl indices of the corresponding reflecting planes are shown in Table 2. G. E. Ziegler in Chicago, has investigated the structure of Li2SO4·H2O as monoclinic system with space group  (Part 2.1) [11].
3.2. FT-IR Spectral Analysis
The FTIR spectrum of ELSMH is recorded in the range 400 - 4000 cm–1 using Perkin-Elmer spectrometer (KBr pellet technique) is shown in Figure 3 and its frequencies are compared with that of pure lithium sulphate monohydrate [20] and EDTA. It is seen that the recorded ELSMH spectrum is having the same absorption peaks as LSMH with some additional peaks. The peak at 3467 cm–1 is assigned to O-H symmetric stretching vibration of water molecule. The bending vibration of H2O is observed at 1616 cm–1. The prominent peaks near 1136 and 485 cm–1 are attributed to SO4 stretching. It is also observed that there are some more extra peaks which are absent in pure LSMH. A sharp peak at 1365 cm–1 is due
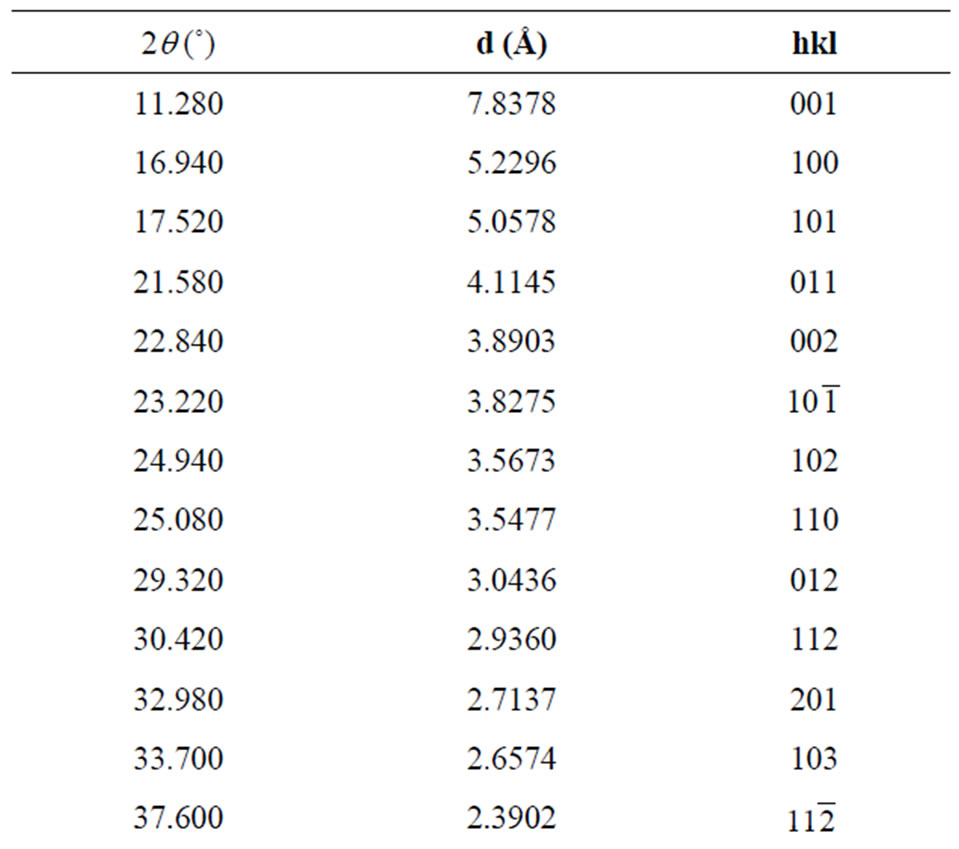
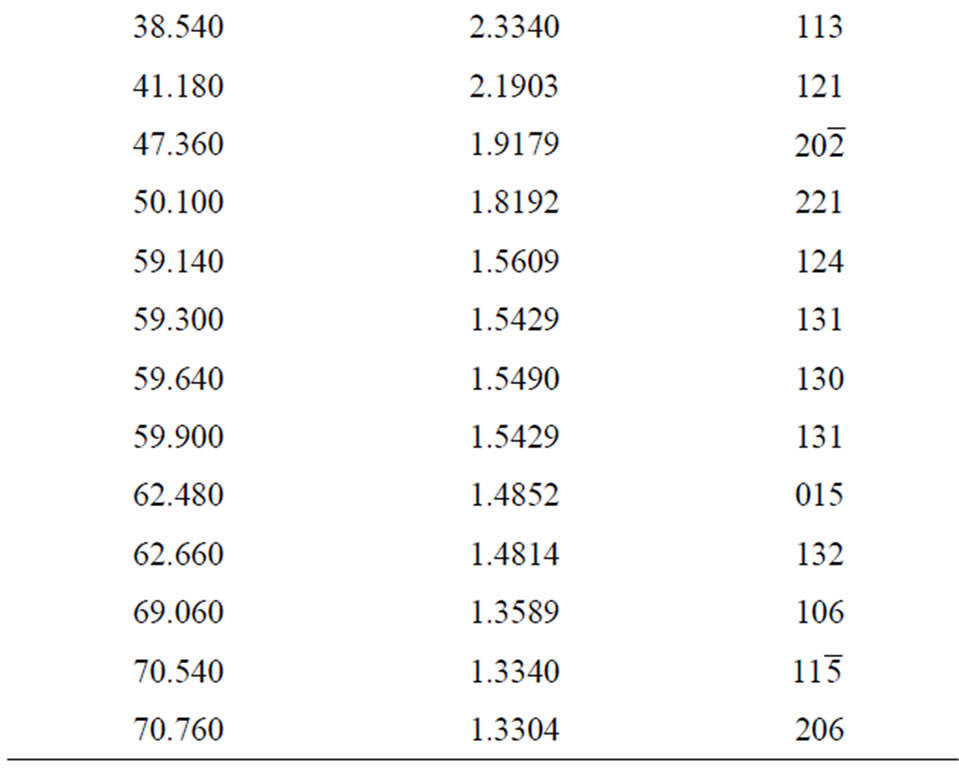
Table 2. X-ray powder diffraction data of ELSMH crystal.
to COO– stretching. Hence, they confirm the inclusion of the dopant and the formation of ELSMH compound. The FTIR vibrational frequencies are given in Table 3. Thus, the observed frequencies are in good agreement with the available data [20-26].
3.3. UV-Vis-NIR Spectral Analysis
The transmission spectrum plays a vital role in identifying the potential of a NLO material because a given NLO material can be of utility only if it has a wide transparency window without any absorption at the fundamental and second harmonic wavelengths. The UV-Vis-NIR spectrum of the grown crystal was recorded in the wave length range of 190 and 1100 nm using Lamda 35 UVVis-NIR spectrophotometer in order to determine the transmission range and hence the suitability of the crystals for optical applications. It is also useful for obtaining information about the structure of the molecule because, the absorption of UV and visible light involves promotion of the electron in the σ and π orbital from the ground state to higher states [26,27]. The UV-Vis-NIR transmission spectrum is shown in the Figure 4 and it is noted that the UV transparency cut off is around 200 nm. It can be seen from the transmission spectrum that the lower cutoff wavelength lies nearly at 240 nm [20] and 200 nm for LSMH and ELSMH crystals respectively. Thus lower
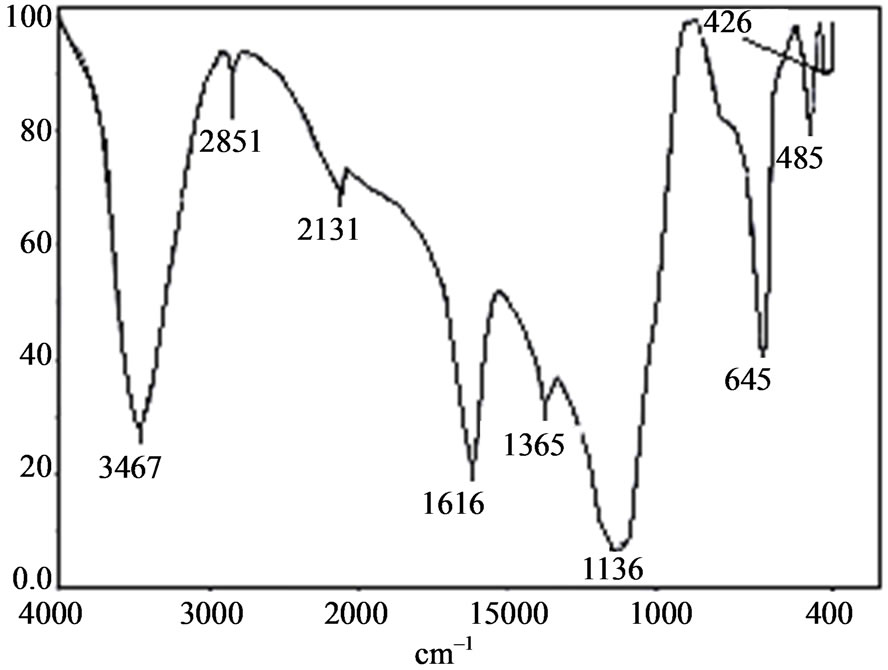
Figure 3. The recorded FTIR spectrum of ELSMH.
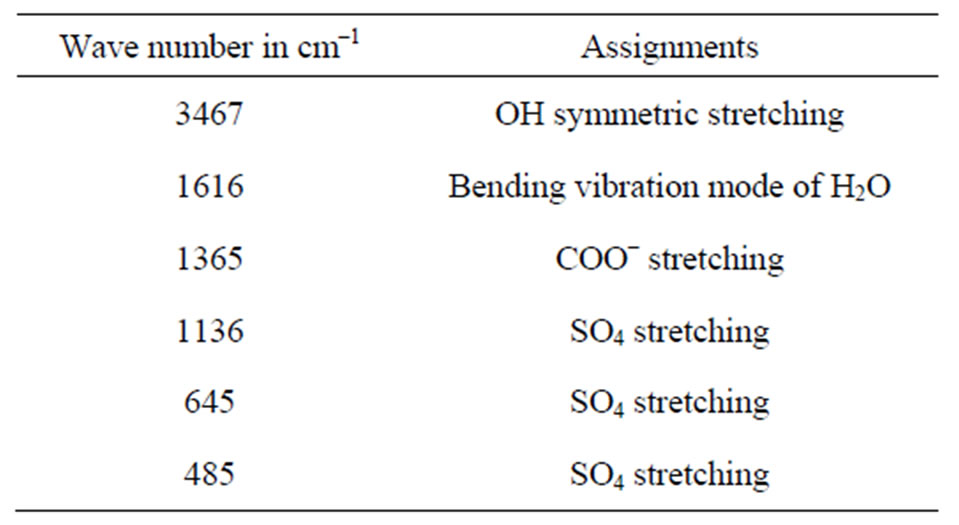
Table 3. Functional group assignment of ELSMH.
cut off value decreases due to EDTA doping in LSMH crystal. The absorption is negligible in the entire visible region of the electromagnetic spectrum. The transmission extends nearly from 200 nm to 1100 nm, makes it suitable for the applications requiring blue/green light. It is also an important requirement for NLO materials having nonlinear optical applications [28].
3.4. Thermal Analysis
Thermo gravimetric analysis (TGA), differential thermal analysis (DTA) and differential scanning calorimetry (DSC) were carried out, using universal V4-5A-TA instrument at a heating rate of 20˚C/min, recorded in the same chart are shown in Figure 5. Thermo gravimetric analysis (TGA) is a technique in which the weight of a substance is recorded as a function of temperature. In the present case, the TGA and DTA are carried out between 30˚C and 400˚C in the nitrogen atmosphere which provide an inert environment. The thermo gravimetric results are governed by the weight and particle size. In practice, a small sample weight is desirable for thermo gravimetric results [14] and hence the weight of the sam-
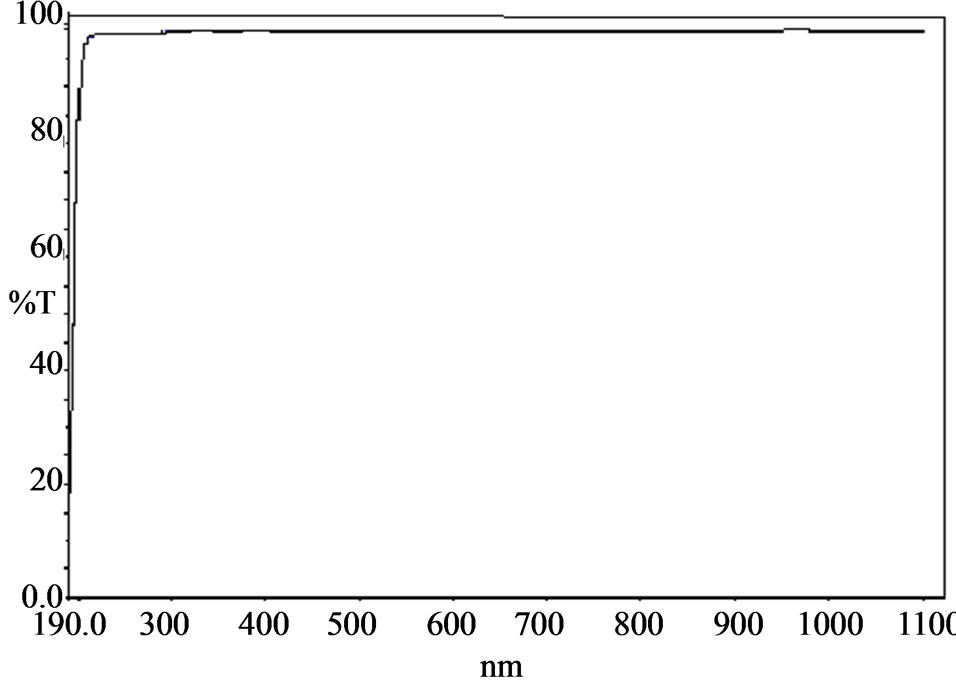
Figure 4. Transmission spectra of ELSMH.
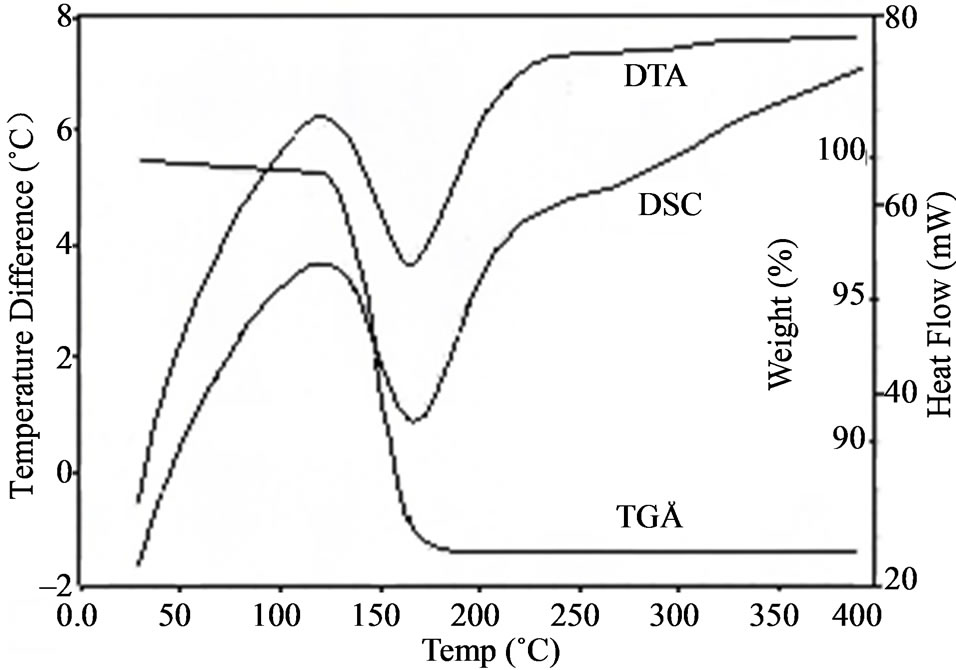
Figure 5. The recorded TGA, DTA and DSC of ELSMH.
ple taken for investigation is 6.2870 mg. The loss of water molecule is observed at 125˚C. This is inferred from the exothermic peaks observed near 125˚C in DTA and DSC. This ensures the suitability of the material for possible device application in lasers. In DTA, the endothermic peak at around 174˚C represents the melting point of the sample.
DSC is a technique by which phase transitions or chemical reactions can be followed by observation of the heat absorbed or liberated: Fusion, change in the crystalline state and other physical changes of the sample while heating give sharp endothermic peak. Dehydration is indicated by a broad endothermic peak. Certain chemical changes such as oxidative degradations are aided by exothermic peaks [29]. The endothermic peak at ~174˚C is indicative of the melting point of the sample.
3.5. Colorimetric Estimation of EDTA in ELSMH Single Crystal
Using a deep vision colorimeter, operating at 540 nm, the inclusion of dopant is confirmed by colorimetric estimation method. At lower concentrations the colorimetric method will often give more accurate results. It is desirable, particularly when minute amounts of substance are to be determined, then the colour reaction be highly sensitive. The reaction product absorbs strongly in visible region. The strong absorption may be enhanced by the presence of groups like –OH, NH2 and CH3, called auxochromes. The colour produced should be sufficiently stable to permit an accurate reading to be taken. The colours arise from 1) d ® d transitions within the metal ion and 2) n ® π* transitions within the ligands. Ninhydrin is having the capacity to bind with EDTA and imparts stable colour (pale yellowish green) to EDTA, therefore it is added with our sample. The colour intensity (optical density) is measured by DEEP VISION COLORIMETER (digital) at 540 nm [30]. Initially, the colorimeter is adjusted for null value with zero concentration (Blank) of EDTA. Then, our sample added with ninhydrin is introduced. The measured optical density is 0.082. With the help of standard graph, the amount of EDTA, dopant present in our crystal is found to be ~196 mg/mL, which is less than the amount of EDTA present in the solution.
3.6. Second Harmonic Generation Study
The SHG property of ELSMH is determined by the modified version of powder technique by Kurtz and Perry [31]. The microscopic origin of non-linearity in the NLO materials is due to the presence of delocalized π-electron systems, connecting donor and accepter groups, which enhance their asymmetric polarizability. Each type of constituent chemical bond is regarded as one part of the whole crystal that has contributions to the total nonlinearity. The distribution of valence electrons of the metallic elements is an important factor that strongly affects the linear and nonlinear properties of each type of constituent chemical bond [32]. The fundamental beam of 1064 nm from Q-switched Nd:YAG laser was used to test the SHG property of the grown crystal. The input pulse with energy 3.5 mJ/pulse and pulse width of 10 ns with a repetition rate of 10 Hz was used. The fundamental beam was filtered by using IR filter. A photo multiplier tube (Philips photonics) was used as detector of the optical output signal emitted by the sample. Potassium dihydrogen ortho phosphate (KDP) [36 mV] was used as the reference material. The second harmonic generation was confirmed by the emission of green light having the wavelength around 532 nm and the output is 19 mV (0.53 times that of KDP).
4. Conclusion
EDTA doped lithium sulphate monohydrate single crystals have been grown by slow evaporation technique at room temperature. The lattice parameter values of ELSMH were determined by single crystal XRD. The sharp well defined Bragg’s peak confirms the crystalline nature of grown crystal. The presence of carboxyl functional groups was identified by FTIR analysis. The optical transparency and the lower cut-off wavelength were identified from the UV-Vis-NIR spectrum. Thermal analyses reveal that the grown crystals are thermally stable up to 125˚C. The peak observed at 174˚C in the DSC corresponds to the melting point of the material. The inclusion of the dopant was confirmed by colorimetric estimation method. The concentration of EDTA in the grown crystal is ~196 mg/mL. The Kurtz powder second harmonic generation test shows that the crystal is a promising candidate for optical second harmonic generation applications.
5. Acknowledgements
The authors thank Dr. P. K. Das, Indian Institute of Science, Bangalore, India for providing SHG facilities. The authors acknowledge St. Joseph’s College, Trichy, India, and SASTRA University, Thanjavur, India for spectral facilities. The authors gratefully acknowledge the School of Physics, Madurai Kamarajar University, Madurai, for the XRD studies.
REFERENCES
- H. O. Marcy, L. F. Warren, M. S. Webb, C. A. Ebbers, S. P. Velsko, G. C. Kennedy and G. C. Catella, “Second Harmonic Generation in Zinc Tris(thiourea) Sulfate,” Applied Optics, Vol. 31, No. 24, 1992, pp. 5051-5060. doi:10.1364/AO.31.005051
- Y. J. Ding, X. Mu and X. Gu, “Growth, Optical, Thermal and Di-Electric Studies of an Amino Acid Organic Nonlinear Optical Material: l-Alanine,” Nonlinear Optical Physics and Material, Vol. 9, No. 1, 2000, p. 21. doi:10.1016/S0218-8635(00)00004-2
- X. Q. Wang, D. Xu, D. R. Yuan, Y. P. Tian, W. T. Yu, S. Y. Sun, Z. H. Yang, Q. Fang, M. K. Lu, Y. X. Yan, F. Q. Meng, S. Y. Guo, G. H. Zhang and M. H. Jiang, “Synthesis, Structure and Properties of a New Nonlinear Optical Material: Zinc Cadmium Tetrathiocyanate,” Material Research Bulletin, Vol. 34, No. 12-13, 1999, pp. 2003-2011. doi:10.1016/S0025-5408(99)00211-1
- L. Li, Z. P. Wang, G. R. Tian, X. Y. Song and S. X. Sun, “Growth and Properties of Dichloro Bis(Triphenyl Phosphine Oxide) Zinc(II), a Novel Nonlinear Optical Crystal,” Journal of Crystal Growth, Vol. 310, No. 6, 2008, pp. 1202- 1205. doi:10.1016/j.jcrysgro.2007.12.058
- G. Pasupathi and P. Philominathan, “Investigation on Growth and Characterization of a New Inorganic NLO Material: Zinc Sulphate (ZnSO4:7H2O) Doped with Magnesium Sulphate (MgSO4:7H2O),” Material Letters, Vol. 62, No. 28, 2008, pp. 4386-4388. doi:10.1016/j.matlet.2008.07.023
- M. N. Bahat and S. M. Dharma Prakash, “Growth of Nonlinear Optical γ-Glycine Crystals,” Journal of Crystal Growth, Vol. 236, No. 1-3, 2002, pp. 376-380.
- X. Ren, D. L. Xu and D. F. Xue, “Crystal Growth of KDP, ADP, and KADP,” Journal of Crystal Growth, Vol. 310, No. 7-9, 2008, pp. 2005-2009. doi:10.1016/j.jcrysgro.2007.11.008
- N. J. Long, “Organometallic Compounds for Nonlinear Optics—The Search for Enlightenment,” Angewandte Chemie, Vol. 34, No. 1, 1995, pp. 21-38. doi:10.1002/anie.199500211
- K. Y. Li, X. T. Wang, F. F. Zhang and D. F. Xue, “Electronegativity Identification of Novel Superhard Materials,” Physical Review Letters, Vol. 100, No. 23, 2008, pp. 659-666. doi:10.1103/PhysRevLett.100.235504
- D. F. Xue, L. J. Zou, L. Wang and X. X. Yan, “Crystallization Behavior of Magnesium Salts: A Summary of Some Experimental Observations,” Modern Physics Letters B, Vol. 23, No. 31-32, 2009, pp. 3761-3768. doi:10.1142/S0217984909021806
- P. Groth, “Chemische Krystallographie,” Verlag Wilhelm Engelmann, Leipzig, Vol. 2, 1908, p. 362.
- P. Becker, S. Abrweiler, P. Held, H. Schneeberger and L. Bohaty, “Thermal Expansion, Pyroelectricity and Linear Optical Properties of Li2SeO4·H2O and Li2SO4·H2O,” Crystal Research Technology, Vol. 38, No. 10, 2003, pp. 881-887. doi:10.1002/crat.200310107
- J. O. Lundgren, A. Kvick, R. Karppinen, R. Liminga and S. C. Abrahams, “Neutron Diffraction Structural Study of Pyroelectric Li2SO4·H2O at 293, 80, and 20 K,” Journal of Chemical Physics, Vol. 80, No. 1, 1984, pp. 423-430. doi:10.1063/1.446465
- G. H. Jeffery, J. Bassett, J. Mendham and R. C. Denney, “Vogul’s Text Book of Quantitative Chemical Analysis,” ELIBS, Addison Wesley Longman Limited, UK, 1989.
- N. K. Asapoglu, A. Baykal, M. S. Toprak, Y. Koseoglu and H. Bayrakdar, “Synthesis and Characterization of NiFe~2O~4 Nano-Octahedrons by EDTA-Assisted Hydrothermal Method,” Turkish Journal of Chemistry, Vol. 31, No. 6, 2000, pp. 659-666.
- V. A. Kuznetsov, J. M. Okhrimenko and M. Rak, “Growth Promoting Effect of Organic Impurities on Growth Kinetics of KAP and KDP Crystals,” Journal of Crystal Growth, Vol. 193, No. 1-2, 1998, pp. 164-173. doi:10.1016/S0022-0248(98)00489-8
- D. L. Xu and D. F. Xue, “Chemical Bond Analysis of the Crystal Growth of KDP and ADP,” Journal of Crystal Growth, Vol. 286, No. 1, 2006, pp. 108-113. doi:10.1016/j.jcrysgro.2005.09.040
- G. Bhagavannarayana, S. K. Kushwaha, S. Parthiban, G. Agitha and S. M. Sundaram, “Influence of Inorganic and Organic Additives on the Crystal Growth, Properties and Crystalline Perfection of Tris(thiourea) Copper(I) Chloride (TCC) Crystals,” Journal of Crystal Growth, Vol. 310, No. 10, 2008, pp. 2575-2583. doi:10.1016/j.jcrysgro.2008.01.032
- K. Meera, A. Claude, R. Muralidharan, C. K. Choi and P. Ramasamy, “Growth and Characterisation of EDTA Added TGS Crystals,” Journal of Crystal Growth, Vol. 285, No. 3, 2005, pp. 358-364. doi:10.1016/j.jcrysgro.2005.08.041
- R. Priya, S. Krishnan, C. Justinraj and S. Jerome Das, “Growth and Characterization of NLO Active Lithium Sulphate Monohydrate Single Crystals,” Crystal Research Technology, Vol. 44, No. 12, 2009, pp. 1272-1276. doi:10.1002/crat.200900504
- K. Nakamoto, “IR and Raman Spectra of Inorganic CoOrdination Compounds,” Wiley & Sons, New York, 1986.
- R. M. Silverstein, G. C. Basseler and T. C. Morrill, “Spectrometric Identification of Organic Compounds,” John Wiley & Hall, London, 1975.
- M. Lenin, G. Bhagavannarayana and P. Ramasamy, “Synthesis, Growth, and Characterization of a Non-Linear Optical Crystal-Glycine Lithium Chloride,” Optics Communications, Vol. 282, No. 6, 2009, pp. 1202-1206. doi:10.1016/j.optcom.2008.08.048
- D. T. Sawyer and P. J. Paulsen, “Ethylenediaminetetraacetic Acid Complexes. I. Alkaline Earth Chelates,” Journal of American Chemical Society, Vol. 80, No. 7, 1958, pp. 1597-1600. doi:10.1021/ja01540a022
- T. Balakrishnan and K. Ramamurthi, “Growth and Characterization of Glycine Lithium Sulphate Single Crystal,” Crystal Research Technology, Vol. 41, No. 12, 2006, pp. 1184-1188. doi:10.1002/crat.200610746
- V. Subhashini, S. Ponnusamy and C. M. Chelvan, “Growth, Optical, Thermal, Piezo and Ferroelectric Studies on Ethylenediamine Ditartrate Dihydrate (EDADTDH) Single Crystals,” Journal of Crystal Growth, Vol. 312, No. 7, 2010, pp. 1040-1045. doi:10.1016/j.jcrysgro.2010.01.014
- T. Baraniraj and P. Philominathan, “Growth and Characterization of Organic Nonlinear Optical Material: Benzilic Acid,” Journal of Crystal Growth, Vol. 311, No. 15, 2009, pp. 3849-3854.
- N. Vijayan, R. R. Babu, M. Gunasekaran, R. Gopalakrishnan, P. Ramasamy, R. Kumaresan and C. W. Lan, “Studies on the Growth and Characterization of p-Hydroxyaceto Phenone Single Crystals,” Journal of Crystal Growth, Vol. 249, No. 1-2, 2003, pp. 309-315. doi:10.1016/S0022-0248(02)01949-8
- R. Gopalan, P. S. Subramanian and K. Rengarajan, “Elements of Analytical Chemistry,” Sultan Chand & Sons, New Delhi, 2003.
- S. Moore and W. H. Stein, “Methods in Enzymol,” Academic Press, New York, 1948.
- S. K. Kurtz and T. T. Perry, “A Powder Technique for the Evaluation of Nonlinear Optical Materials,” Journal of Applied Physics, Vol. 39, No. 8, 1968, pp. 3798-3813. doi:10.1063/1.1656857
- D. F. Xue and S. Y. zhang, “Chemical Bond Analysis of the Correlation between Crystal Structure and Nonlinear Optical Properties of Complex Crystals,” Physica B: Condensed Matter, Vol. 262, No. 1-2, 1999, pp. 78-83. doi:10.1016/S0921-4526(98)00465-7
NOTES
*Corresponding author.