Archaeological Discovery
Vol.2 No.3(2014), Article ID:48025,12 pages
DOI:10.4236/ad.2014.23009
Appliance of Geophysical Methods to Detect the Ancient Remains at “Tell Defenneh” Area, Ismailia, Egypt
Alhussein Adham Basheer1*, Ahmed El-Kotb Al-Imam1, Abdelnasser Mohammed Abdelmotaal1, Mostafa Sarhan Toni2, Sayed Omar Elkhateeb3
1National Research Institute of Astronomy and Geophysics (NRIAG), Helwan, Cairo, Egypt
2Geology Department, Faculty of Science, Helwan University, Cairo, Egypt
3Geology Department, Faculty of Science, South Valley University, Qena, Egypt
Email: *alhussein.adham.basheer.mohammed@gmail.com
Copyright © 2014 by authors and Scientific Research Publishing Inc.
This work is licensed under the Creative Commons Attribution International License (CC BY).
http://creativecommons.org/licenses/by/4.0/


Received 25 May 2014; revised 27 June 2014; accepted 9 July 2014
ABSTRACT
The main target of this study is to detect the ancient archaeological remains by using Helicopter Electromagnetic Method (HEM) and Ground Penetrating Radar (GPR) survey at “Tell Defenneh” Area, which is located in the west bank of Suez Canal at the northeastern Desert of Egypt. It is far about 15 Km to the northeast of “Qantara Gharb” town which is a part of “Ismailia” governorate. This area is full of different archaeological features, because it is located in the ancient international trade-military road (Horus Road). This road connected ancient Egypt with its neighboring eastern countries. In additional to that, this area used to protect ancient Egypt from invaders, who came from the East. HEM has been used to detect the conductivity anomalies over the study area. These anomalies are useful to show the different and distinctive places which can be focused, on small scalar, by GPR to identify it more clearly in the study area. According to the HEM data, it was noticed that there are distinctive geometric shape with very low resistivity or very high conductivity values in the northeastern part of the study area. These data have been supported by GPR survey focused on this part. It was suggested that these anomalies may be due to old man-made mud bricks that was customary used in the building in ancient times. The subsequently archaeological excavations, which are based on these interpreted data as a guide and proof, revealed that the remains belong to the citadel of pharaoh “Psamtik I” (664-610 BC). This result confirms that the incorporated geophysical methods can be efficiently supplied in the archaeological prospection in Egypt.
Keywords:Helicopter Electromagnetic Survey (HEM), Ground Penetrating Radar (GPR), Archaeological Ancient Remains, Tell Defenneh, Ismailia, Egypt

1. Introduction
The study area is located between latitude 30.84434285˚N and 30.87715297˚N and longitude 32.16001781˚E and 32.19607835˚E parallel to the coast of the Suez Canal in the eastern Desert of Egypt (Figure 1). Due to its location at the old trade-military road in the ancient age and because it was a base area of ancient Egypt to repel the attacks of invaders from the East, it is very important to perform the present study to detect the archaeological remains in the area. Helicopter Electromagnetic method (HEM) in frequency domain has been used in this study to detect the conductivity anomalies over Tell Defenneh Area. The main distinctive anomalies have been located and surveyed on land by using the Ground Penetrating Radar (GPR) which provides more details and supports the (HEM) interrelated data. These methods have proven to be the most effective methods used to detect the buried remains at an area.
2. Geologic Setting
The study area and its environs are occupied by sedimentary rocks ranging in age from Miocene to Quaternary of fluvial-marine deposits. The exposed rock units are arranged from old to new as follow:
1) Lower Miocene rocks.
2) Upper Miocene rocks.
3) Pliocene deposits.
4) Pleistocene alluvial deposits.
Most of the studies classified the exposed Miocene rocks into the marine Miocene unit at the base and nonmarine rocks of the Upper Miocene. The marine lower Miocene rocks are composed of shallow marine sediments of bioturbated marls, shales, sandstones and marly limestones. The non-marine Miocene unit at the top is composed of sandstones, gravels, chalky limestone limestones and clays. According to (Said, 1962) and (Abdallah, 1993) most of the exposed rock units are belonging to Hagul Formation which extends between Gebel Ataqa in the north and El Galala El-Bahariya Plateau in the south representing Upper Miocene Clastic/limestone sequence of about 22 m thick measured at the entrance of Wadi Hagul. This pointed that Hagul Formation is related to early Pliocene. The exposed Pliocene deposits are represented by unlithified sands and gravels composed of sands, gravels, clays and limestone. The Pleistocene is also represented by alluvial deposits composed of sands and gravels of alluvial origin. The alluvial deposits consist of coarse gravels in the upstream; they become rougher downstream towards the entrance of Wadi Hagul with large limestone boulders. The Holocene
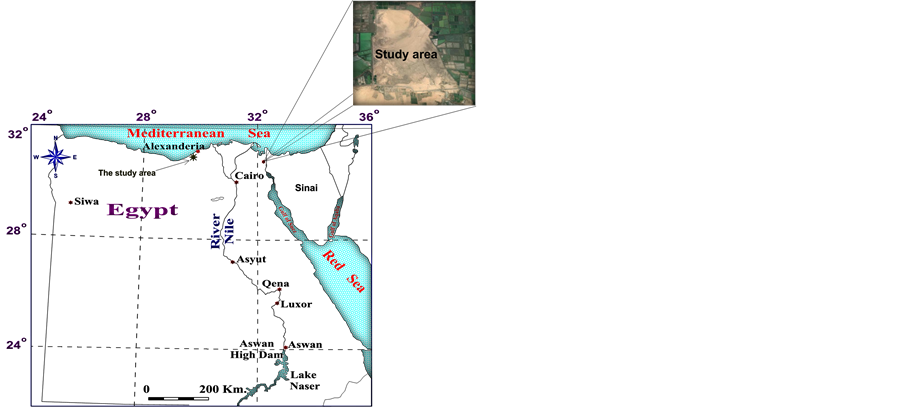
Figure 1. Location map of the study area.
deposits occupy form Wadi deposits (Calcareous boulders), coastal sand (near the shoreline), and Sabkha area (parts of the coastal sands wet by seawater forming salty deposits). The alluvial deposits amplify the rate of ground motion up to three times (Sadek, 1926). Based on the previous description of the different rock units, the study area consists of five rock units arranged from the top to the bottom as follow (Figure 2):
1) Sand dunes 2) Sabkha deposits 3) Nile deposits 4) Undivided deposits (Wadi and playa deposits; raised beaches and corals of the Red Sea coast)
5) Miocene (consists of a basal clastic section overlain by a carbonates units; along the Gulf of Sues and Red Sea coast, clastics, gypsum, and carbonates are dominant, especially in the north).
3. Applied Geophysical Methods
3.1. Frequency-Domain Helicopter-Born Electromagnetic (HEM) Survey
HEM systems (Figure 3) utilize several transmitter and receiver coils simultaneously. The transmitter signals and the primary magnetic fields are generated by sinusoidal current flow through the transmitter coils at discrete frequencies. The oscillating primary magnetic fields induce eddy currents in the subsurface. These currents generate the secondary magnetic fields, which depend on the conductivity distribution of the subsurface. The secondary magnetic fields measured by the receiver coils are divided by the primary magnetic fields expected at the centre of the receiver coils and the ratio is measured in parts per million. As the secondary fields are very small with respect to the primary fields, the primary fields have to be bucked. The orientation of the transmitter coils is horizontal or vertical and the receiver coils are oriented in a maximum coupled position resulting in horizontal coplanar, vertical coplanar or vertical coaxial coil systems. Typically 4 - 6 frequencies are used on modern (HEM) systems (Siemon, 2006).
Compared to ground based Electromagnetic systems, the vertical distance from the TX-RX system to the target is large. This makes the in-phase and quadrate anomalies quite small. The value of the secondary field is typically measured in parts-per million (ppm) of the primary magnetic field. Digital helicopter-borne electromagnetic (DIG-HEM) survey type has been used in this study.
Bucking coil used to suppress the primary magnetic field at the RX. This allows a weak secondary field to be detected in the presence of a strong primary field. Multiple coil configurations are used. This allows 9 combinations of TX and RX to be used. These will couple differently with different conductor geometries. Multiple frequencies give estimate of depth variation of conductivity (Palacky & West, 1991).
Depth of penetration depends on TX-RX distance, frequency and the skin depth. It is clearly noted that the measuring of weak secondary magnetic fields in the presence of the primary magnetic field is difficult. Very strong conductors have small quadrate response. Thus, the best targets in archaeological exploration and minor
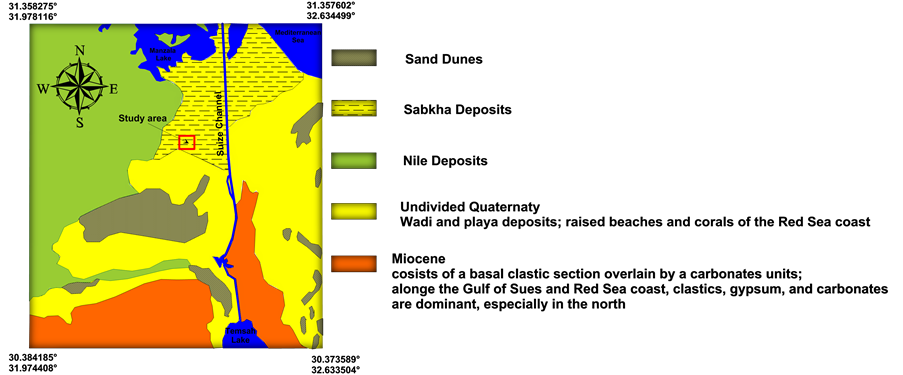
Figure 2. Geological map of the study area (After the EGSMA, 1996).
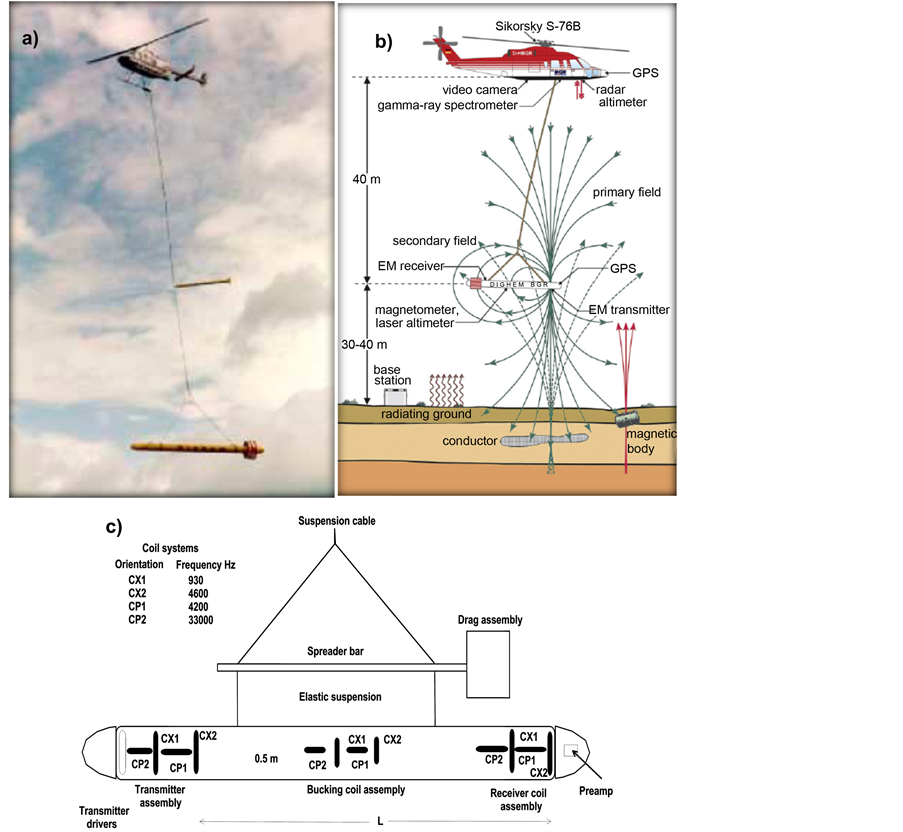
Figure 3. a) Helicopter Electromagnetic system; b) BGR system: The nominal bird altitude is 30 - 40 m above the ground. The helicopter is also equipped with differential GPS, video camera and a radar-altimeter; c) The system of AEM or (HEM) (Called the bird).
structure mapping are the most difficult to detect with frequency domain EM. Multiple frequencies can be used to estimate conductivity with depth variations. The measured data displayed as secondary field/primary field as ppm or as ground (terrain) resistivity map as in 2D.
The (HEM) system operates at three frequencies ranging from 56 Hz to 72 kHz. The transmitters and receivers of the horizontal coplanar coil system are about 6.7 m apart. GPS provides the positions of the helicopter and the system. Laser and radar altimeters record the altitudes of the (HEM) system and the helicopter, respectively. The nominal ground clearance of the system is 30 - 40 m. The sampling rate of 10Hz provides sampling distances of about 4 m at a flight speed of 140 km/h.
To interpret the (HEM) data in terms of layered-earth resistivity models the Marquardt-Levenberg 1-D inversion technique (Sengpiel & Siemon, 1998, 2000) was used.
3.2. Ground Penetrating Radar (GPR) Survey
A SIR-2000 (Subsurface Interface Radar) system was used with a 200 MHz antenna and survey wheel, manufactured by Geophysical Survey Systems, Inc. (GSSI). The 200 MHz antenna was chosen in order to have maximum detail/highest resolution in the uppermost 3 - 10 meters. A consciously grid was chosen in the study area such as the anomalous feature detected from Helicopter Electromagnetic investigations. Starting at the Northeastern corner of the grid, the antenna was pulled from East to West direction, and return back in the opposite direction from West to East. Survey lines were spaced every 0.5 m and 450 in length. The data set for the study area were completed with 1450 GPR survey lines in site and 633 GPR survey lines in another site. The survey parameter was a time windows of 120 ns, 20 scans per meter, and 512 samples per scan. Figure 4 shows the principle idea of GPR instrument.
4. Data Processing and Interpretation
4.1. HEM (Frequency Domain) Data Processing
The aim of the data processing is to extract those field values from the measured data that correspond to the subsurface material parameters and to eliminate—or at least to minimize-those portions in the data that are affected by sources not belonging to the subsurface. (HEM) data processing requires a number of processing steps such as the conversion of measured voltages to relative secondary field values using calibration signals, standard and advanced drift corrections (zero-level drift correction/2D leveling), and other necessary data corrections (Valleau, 2000; Siemon et al., 2009).
The (HEM) system is calibrated using external and internal calibration coils, which produce definite signals in the (HEM) data measured. The external coils are used for the calibration on ground in order to derive the conversion factors. After phase and gain adjustment at the beginning of each survey flight, the calibration is checked using internal calibration coils several times during a survey flight. Phase and gain adjustments are best performed above highly resistive ground or at high flight altitude (e.g. 350 m).
The signals measured at high altitude are due to insufficiently bucked-out primary fields, coupling effects with the aircraft, or (thermal) system drift. These values are used to shift the (HEM) data with respect to their zero-levels. The zero leveling eliminates the long-term quasi-linear drift; the affect of short-term variations, however, caused by e.g. varying air temperatures due to varying sensor elevations cannot be corrected successfully by this procedure. 2D filter techniques (micro-leveling) are necessary to adjust the line data in order to remove the stripe patterns resulting from remaining zero-level and calibration errors.
As the dependency of the secondary field on both the resistivity of the subsurface and the sensor altitude is strongly non-linear. The half-space parameters are leveled instead. The secondary field components are then leveled with respect to synthetic (HEM) data derived from the leveled half-space parameters (Siemon, 2009).
External sources (e.g. radio transmitters or power lines) or strong man-made conductors affect the (HEM) data. Noise can be eliminated from the (HEM) data by appropriate filtering or interpolation procedures. The elimination of induction effects from buildings and other electrical installations or effects from strongly magnetized sources is a very sensitive processing step as these effects are often not clearly separable from that of natural sources.
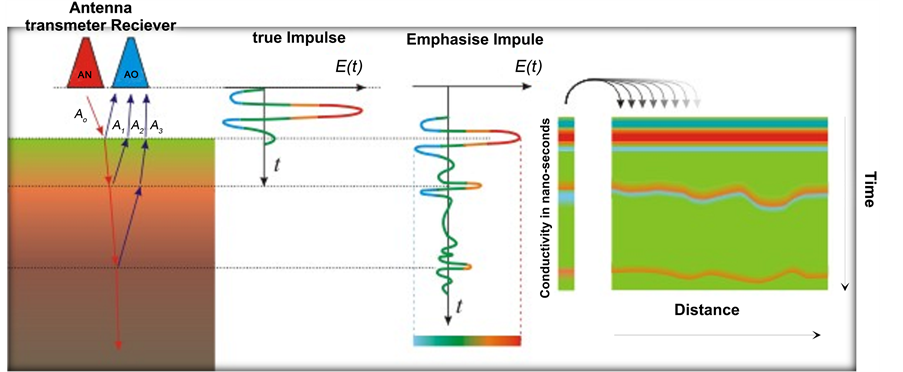
Figure 4. The basic idea of GPR instrument.
4.2. HEM (Frequency Domain) Data Interpretation
(HEM) measured data were separated and processed. The obvious differences between the values of the apparent electrical resistivity show a lot of features related to difference in rock compositions. This difference is related to the range of the conductivities of its components, which measured by (HEM) instrument. Geometrical sharp forms appear in the study area with very low resistivity values. These shapes are located in the northeastern part of the study area. Near the previous geometrical forms, another shape with cycle form appeared.
Analytical signal filtering was used to show the values of low resistivity and the places of the changing values to represent the sites of the suggested subsurface remains (Figure 5). Apparent resistivity map (7.2 KHz) in the Figure 5 shows distribution in data with vague separated shapes of rock units, this may be due to its difference of its conductivities. By decreasing the frequency to (133 Hz), the difference in resistivities between the buried remains and the soils that surround it became more lucid (Figure 6).
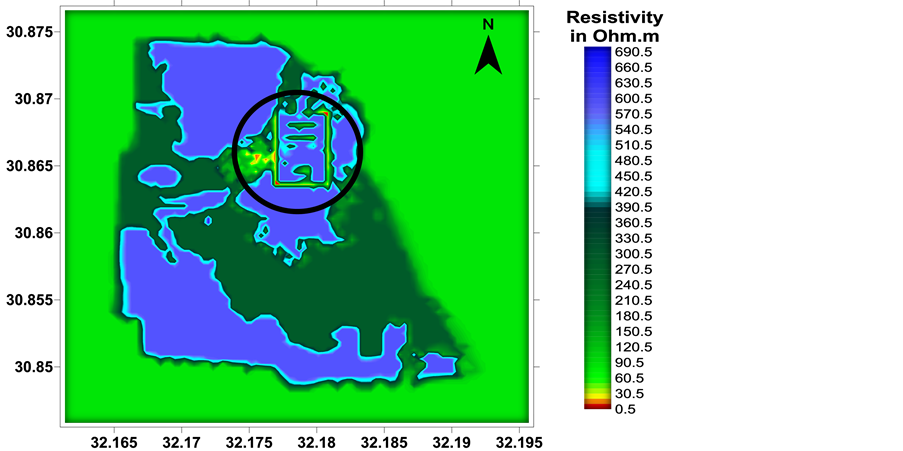
Figure 5. Apparent resistivity map of the study area (Frequency 7.2 KHz).
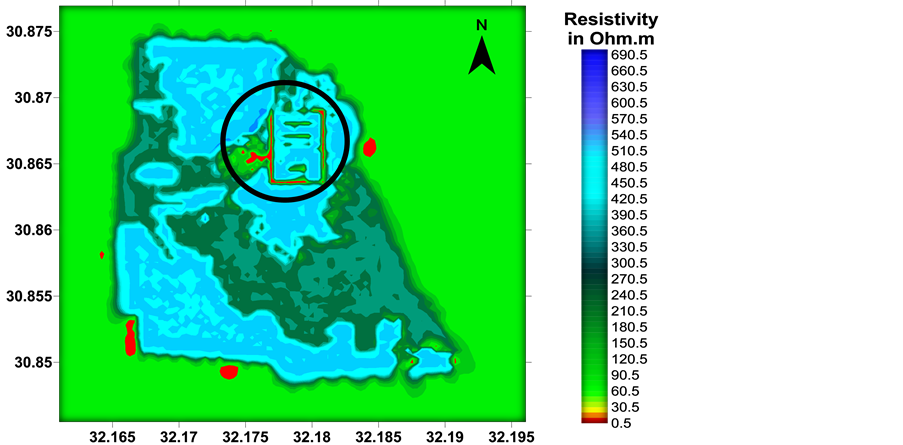
Figure 6. Apparent resistivity map of the study area (Frequency 133 Hz).
Figure 7 shows more comprehensible 3-D image to the suggested buried remains and the soil that surrounds it under low frequency (56 Hz). The places of low resistivity values clearly show the sites of these suggested buried remains in the study area, and the places of closed values show the existence and extension of the same buried remains which have the same electrical properties. By using analytical signal filtering method, the places of the suggested buried remains, such as the interval break zones that exist between the buried remains and surrounded soil, can be located (Figure 8).
4.3. GPR Data Processing
The radar data cannot be immediately used for interpretation and excavation. Typical GPR reflection profiles include noise and clutter reflections that are produced by antenna “ringing”, differences in the coupling of energy with the ground, multiple reflections that occur between the antenna and the ground surface and also back
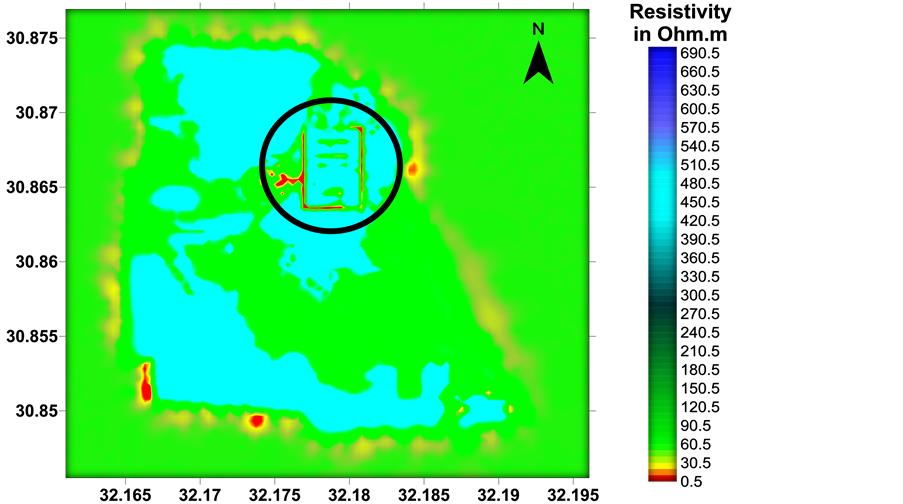
Figure 7. Apparent resistivity map of the study area (Frequency 56 Hz).
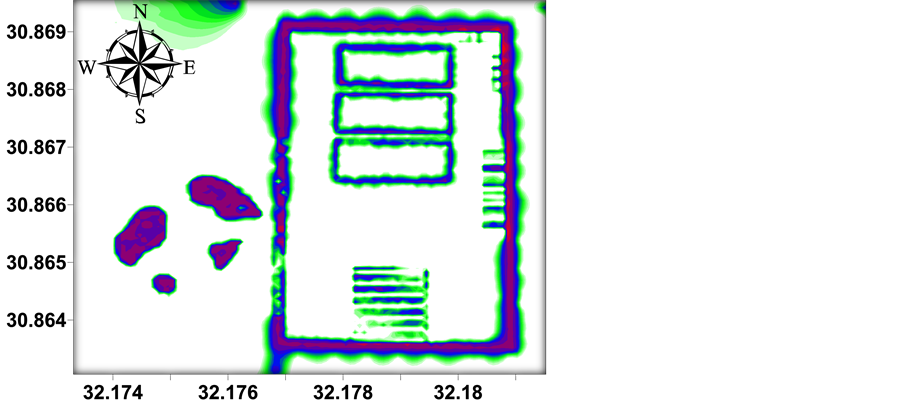
Figure 8. The analytical signal filtering map of the interval break zones in the study area.
ground “noise” (Conyers et al., 2002). The final steps in data processing involve transforming radar data into usable images. Quite often this requires considerable simplification of the complex mass of GPR data. The processing of the working areas has been conducted in two stages. The first stage was to emphasize the anomalous features which could be found on the GPR field sections. The complete GPR data set has been analyzed using REFLEX-Win software version 4.5 (Sandmeier, 2001) for post-processing operations. During this stage a number of processing steps have been applied including background removal to remove the horizontal lines resulting from surface reflections, band pass filter in order to eliminate high-frequency components, F-K filter and Automatic gain control.
Figure 9 shows an example of a B-scan along profile number (11). Examining Figure 9 shows that there are hyperbolic reflectors at a horizontal distance about 14 m from the starting point. These hyperbolic features correspond to a depth of 2.5 m, and they also agree with the location of the low resistive anomalous objects detected on HEM data. The C-Scan along profile number (34) in Figure 10 shows that there are continuous hyperbolic reflectors at a horizontal distance bout 10 m. from the starting point, these hyperbolic features correspond to a depth of 1.5 m, and continuously appeared to the end of the profile. They also agree with the location of low resistive anomalous objects detected on HEM data.
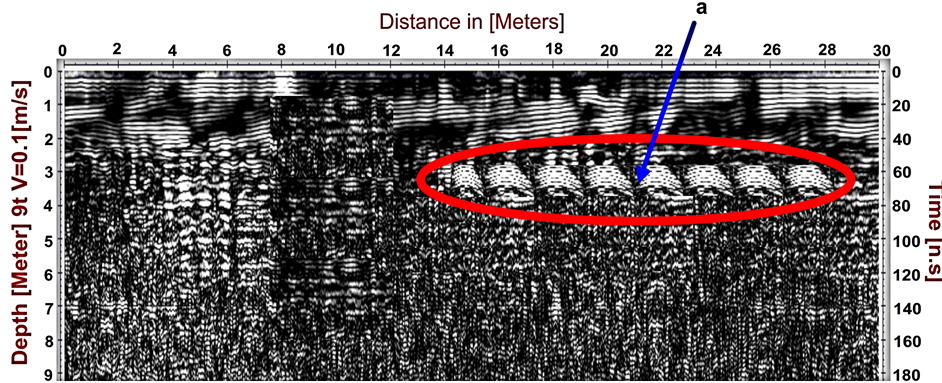
Figure 9. 2-D GPR profile along line No. (11) pass over the main wall of citadel.
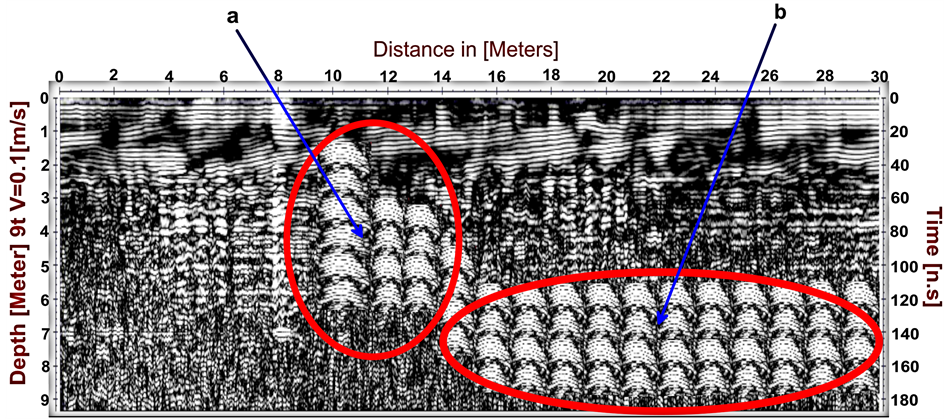
Figure 10. 2-D GPR profile along line Nr. (34) pass over the surface entrance of the tunnel stockroom a. The surface entrance of the tunnel stockroom, b. The tunnel stockroom.
4.4. 3D GPR Images
In the past, the use of 3-D images has been restricted because of the time required to conduct fieldwork over limited areas and the lack of satisfactory signal-processing software. The recent development of sophisticated software has enabled signal enhancement and improved pattern recognition on radar records. Three-dimensional interpretations of ground-penetrating radar have been used to identify burials and other cultural features (Conyers & Goodman, 1997).
GPR sections can be used to identify the structure of the subsurface objects as long as we cannot easily see the plan shapes of the anomalies. Time slicing and topographic slicing of GPR data are a relatively new procedure in archaeology and routinely applied since the early 1990’s. We can run many closely spaced parallel lines, no more than half the anticipated target width apart, to reach both vertically and horizontally resolution which was impossible to reach by the traditional techniques (namely resistance and magnetic). 3D GPR is the fastest way to accomplish complete mapping of the site.
The depth slices resulting from building three dimensional images at depth range from 2.5 m to 4.5 m have been shown in Figure 11. The examination of Figure 11 shows the attendance of elongated and circular anomalous objects, these objects are continuously appeared in all depth slices which sequence with proportional rates to the depth. The positions of these anomalous features are in a good agreement with those detected by HEM survey.
5. Discussion and Conclusions
The key target of this study was to detect and localize the buried archaeological remains in Tell Defenneh Area by using geophysical methods. Two geophysical tools had been applied in the study area. The first tool was the Aero-electromagnetic survey, which was performed by Helicopter. (HEM) measured data were digitally separated and processed. The clear dissimilarity between the values of apparent electrical resistivity shows very interested features with very low resistivity in comparison with the surrounded places. This distinction related to the range of the conductivities of its components, which measured by (HEM) instrument.
With the purpose of verifying the reliability of the (HEM) to detect the different features and remains at Tell Defenneh area, we have used the ground penetrating radar (GPR) with global position system (GPS) as another supported geophysical tool. This is performed to survey the part which showed very interesting features that could be old man-made mud bricks that were used in ancient building. Figure 12 shows the schematic form of
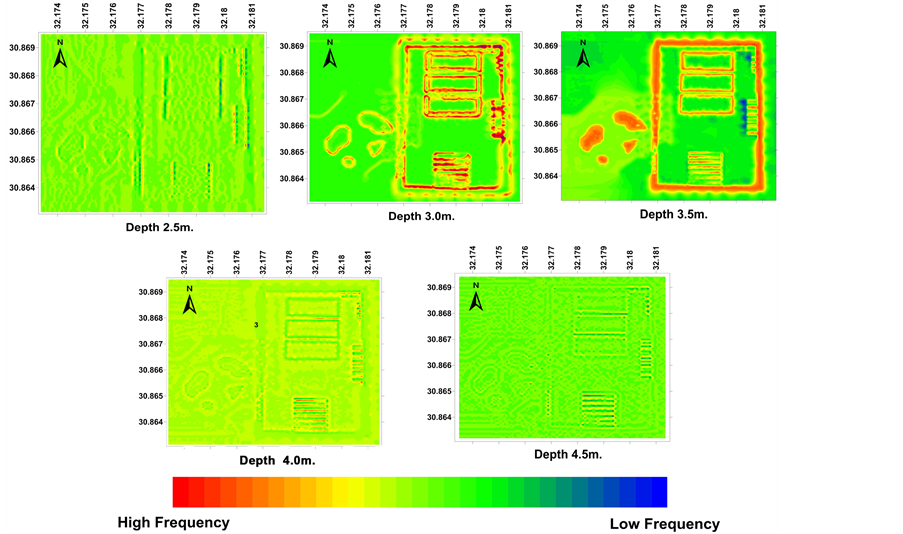
Figure 11. GPR depth slice maps at depth range 2.5 m to 4.5 m for the citadel and tunnel room.
the suggested citadel walls, halls, stockrooms, and outside underground cycle stockroom that depends on the interpreted data of both (HEM) and (GPR) survey.
Following our interpretation and the probable detection of buried archaeological remains, the excavation and digging process started by the Egyptian General Authority for Antiquities with the association of the Egyptian third-field army [Corps of Engineers]. They have found that the detected features belong to the citadel of pharaoh “Psamtik I” (664-610 BC). According to GPS systems in both of HEM and GPR instruments, the measurement area of the citadel is (380 m × 625 m), and the width of its wall is (13 m). In the northern part of the citadel, three consecutive lobbies are located; each lobby has area as (76 m × 182 m). There are eight rooms traced in the northeastern part with inverted shape of “L”; each room has area (14 m × 15 m). Fifteen consecutive stockrooms are located in the eastern part; each stockroom has area (6 m × 36 m). Another seven consecutive stockrooms are located in the southern part of the citadel; each one has area (8 m × 57 m). Figure 13 shows side of the fifteen stockrooms that discovered with the remains of the main wall.
Near the citadel area, another place shows interested features which are far about 28 m. from the west wall of the citadel. The excavation and digging process found another underground big stockroom which takes a form of a cycle with width 3.5 and circumference 315 m. Figure 14 shows the surface entrance of this cycle stockroom tunnel. Figure 15 shows the excavation and drilling processes in the presence of men of the Egyptian General
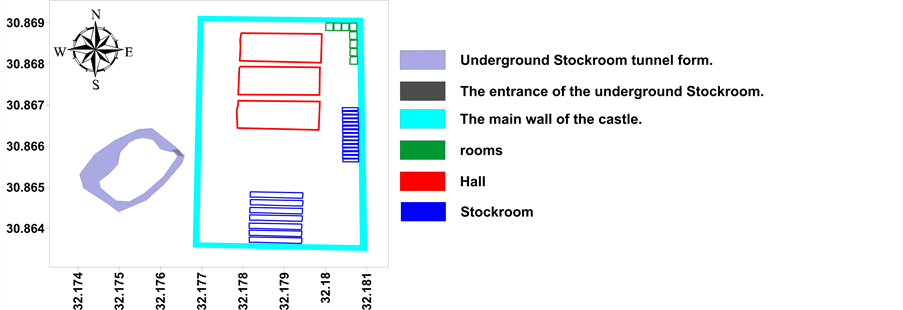
Figure 12. The schematic form of the suggested remains of the citadel of pharaoh “Psamtik I” according to the interpreted data of both (HEM) and (GPR) survey.
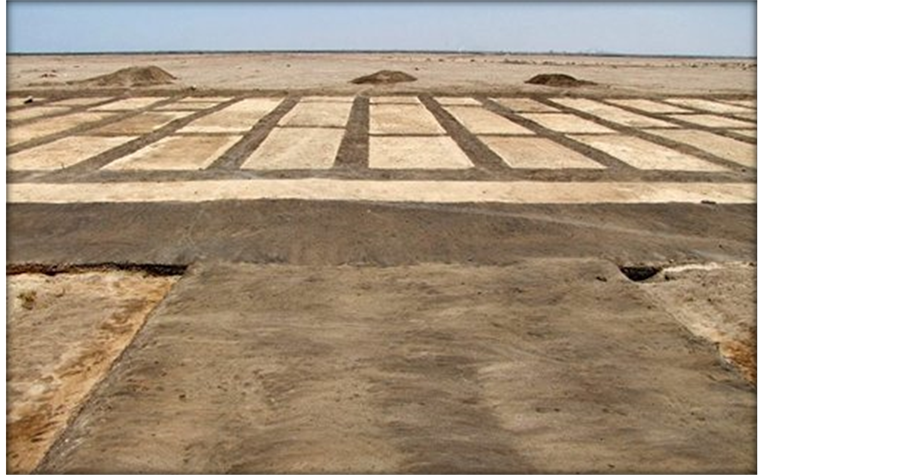
Figure 13. Parts of the wall of citadel and some halls after excavation process.
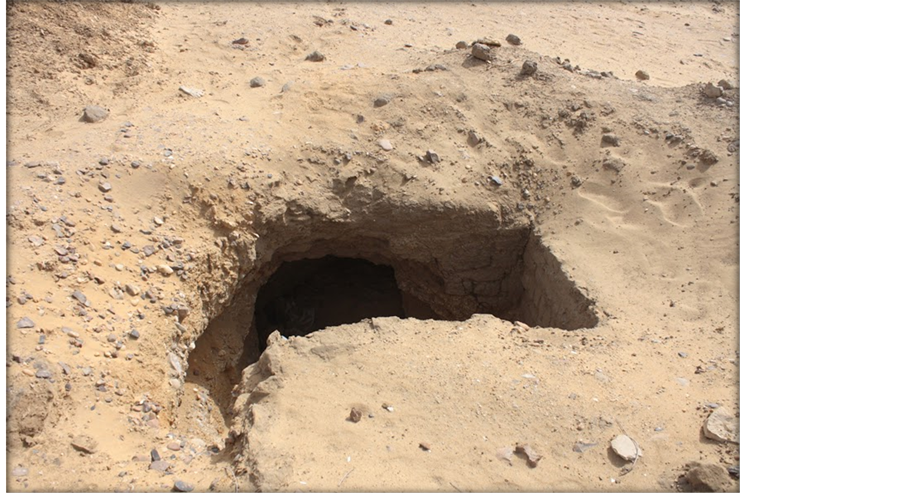
Figure 14. The surface entrance of the underground cycle stockroom.
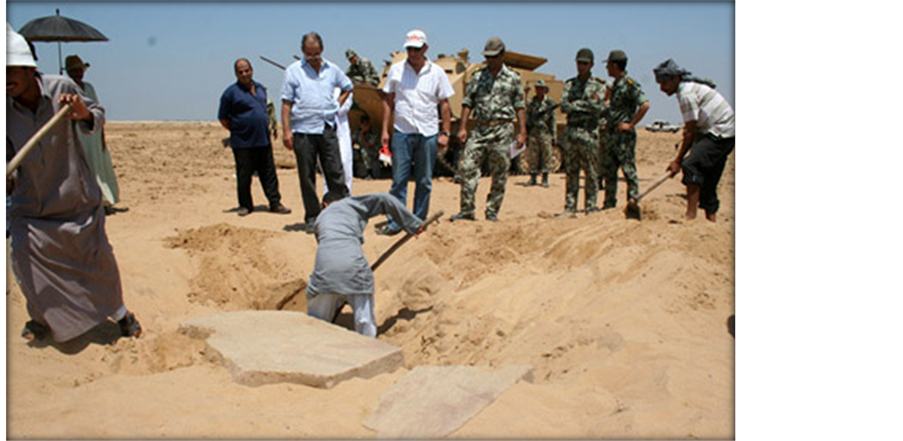
Figure 15. Excavation and drilling processes on the specific locations guided on suggested interpreted data, in the presence of men of the Egyptian General Authority for Antiquities and officers of the Egyptian third field army [Corps of Engineers].
Authority for Antiquities and officers of the Egyptian third-field army [Corps of Engineers].
From the results, it can be concluded that the high degree of similarity between (HEM) and (GPR) for the detection of buried archaeological remains in both locations and dimensions.
References
- Abdallah, M. (1993) Structural Geology of the Area between El Galala El-Bahariya and Gabal Okheider, Egypt. Ph.D. Thesis, Cairo: Ain Shams University.
- Conyers, L. B. (2002). Ground-Penetrating Radar Techniques to Discover and Map Historic Graves. Olemiss Education, Research of Anthropology, Haley, Class 2010, 131-157.
- Conyers, L. B., & Goodman, D. (1997). Ground-Penetrating Radar: An Introduction for Archaeologists. Walnut, Creek, CA: AltaMira Press.
- EGSMA (1996). Egyptian Geological Survey and Mining Association, Geological Map of Ismailia Area, Northeastern Desert of Egypt.
- Palacky, G. J., & West, G. F. (1991). Airborne Electromagnetic Methods. In M. N. Nabighian (Ed.), Electromagnetic Methods in Applied Geophysics (pp. 811-879). Newmont Exploration Limited, Denver, Colorado, USA. http://dx.doi.org/10.1190/1.9781560802686.ch10
- Sadek, H. (1926) The Geography and Geology of the District between Gebel Ataqa and El Galala El Bahariya (Gulf of Suez). Cairo: Egyptian Geological Survey and Mining Association, Geology Department.
- Said, R. (1962). The Geology of Egypt. Amsterdam: Elsevier Publishing Company. Vol. 2, 103-127.
- Sandmeier, K. J. (2001). Program for Processing and Interpretation of Reflection and Transmission Data, Refelex-Win version 4.5 copyrights ? Sandmeier Software Zibse strasse 1,D-76227 Karlsruha, Germany.�
- Sengpiel, K. P., & Siemon, B. (1998). Examples of 1D Inversion of Multifrequency AEM Data from 3D Resistivity Distributions. Exploration Geophysics, 29, 133-141. http://dx.doi.org/10.1071/EG998133
- Sengpiel, K. P., & Siemon, B. (2000). Advanced Inversion Methods for Airborne Electromagnetics. Geophysics, 66, 1983-1992. http://dx.doi.org/10.1071/EG998133
- Siemon, B. (2006). Electromagnetic Methods—Frequency Domain: Airborne Techniques. In R. Kirsch (Ed.), Groundwater Geophysics—A Tool for Hydrogeology (pp. 155-170). Berlin: Springer.
- Siemon, B. (2009). Levelling of Frequency-Domain Helicopter-Borne Electromagnetic Data. Journal of Applied Geophysics, 67, 206-218. http://dx.doi.org/10.1016/j.jappgeo.2007.11.001
- Siemon, B., Christiansen, A. V., & Auken, E. (2009). A Review of Helicopter-Borne Electromagnetic Methods for Groundwater Exploration. Journal of Near Surface Geophysics, 7, 629-646. http://dx.doi.org/10.3997/1873-0604.2009043
- Valleau, N. (2000). (HEM) Data Processing—A Practical Overview. Journal of Exploration Geophysics, 31, 584-594. http://dx.doi.org/10.1071/EG00584
NOTES

*Corresponding author.