Geomaterials
Vol.4 No.1(2014), Article ID:42117,20 pages DOI:10.4236/gm.2014.41004
Petrographic, Radiometric and Paleomagnetic Studies for Some Alkaline Rocks, South Nusab El Balgum Mass Complex, South Western Desert, Egypt
Nuclear Materials Authority, Cairo, Egypt
Email: dr.soliman72@yahoo.com
Copyright © 2014 Ragaa A. M. Elsayed et al. This is an open access article distributed under the Creative Commons Attribution License, which permits unrestricted use, distribution, and reproduction in any medium, provided the original work is properly cited. In accordance of the Creative Commons Attribution License all Copyrights © 2014 are reserved for SCIRP and the owner of the intellectual property Ragaa A. M. Elsayed et al. All Copyright © 2014 are guarded by law and by SCIRP as a guardian.
Received November 21, 2013; revised December 21, 2013; accepted December 28, 2013
Keywords:Radiometric; Paleomagnetic; Alkaline Volcanics; Peralkaline Granite; Amorphous Secondary Uranium; Thorium
ABSTRACT
Nusab El Balgum mass complex represents one of the alkaline igneous activities in the south Western Desert of Egypt. Petrographic investigations defined some different rock types in south of the complex represented by alkaline volcanics (pyroclastics [rhyolitic crystal tuffs], spherulitic rhyolites, alkaline rhyolite dykes), sub-volcanic peralkaline granites and structurally controlled mylonitic volcanoclastics. These rocks recorded significant concentrations in terms of the two radioactive elements Th and eU, which displayed considerable spatial variations, especially within the peralkaline granites. The abundance of Th and eU is mainly related to favorable combination of structural and pos-magmatic hydrothermal conditions. Paleomagnetic results give well-defined stable remanent magnetization directions of reliable VGP positions, which are presented and discussed in the context of the African APWP. Rock types, magnetization directions and VGP positions with the corresponding ages are as follows: 1) Rhyolitic crystal tuffs; D/I = 340.0˚/−19.4˚, α95 = 6.8˚; VGP Lat./Long. = 51.4˚N/240.5˚E, A95 = 5.9˚ (Late Triassic). 2) Spherulitic rhyolites; D/I = 346.7˚/−6.6˚, α95 = 3.5˚; VGP Lat./Long. = 60.4˚N/237.0˚E, A95 = 3.0˚ (Late Triassic/Early Jurassic). 3) Alkaline rhyolite dykes; D/I = 341.3˚/16.7˚, α95 = 5.4˚; VGP Lat./Long. = 67.0˚N/262.8˚E, A95 = 4.2˚ (Early Jurassic). 4) Peralkaline granites; D/I = 173.3˚/−9.7˚, α95 = 3.6˚; VGP Lat./Long. = −70.5˚S/49.7˚E, A95 = 5.0˚ (Late Cretaceous). 5) Mylonitic volcanoclastics; D/I = 3.4˚/32.7˚, α95 = 4.4˚; VGP Lat./Long. = 83.6˚N/178.2˚E, A95 = 3.9˚ (Oligo-Miocene). Except for the mylonitic volcanoclastics, these ages correspond to extrusion of the rocks and acquisition of primary thermal remanent magnetizations during the initial cooling. The formation events of the volcanic rocks are coincident with the most dynamic phases of Pangaea break-up, which occurred during the emplacement of the Central Atlantic Magmatic Province and the subsequent opening of the Central Atlantic Ocean. The sub-volcanic peralkaline granites are coeval with anorogenic alkaline rocks in south of Egypt and these rocks formed due to alkaline melts in the asthenosphere. The mylonitic volcanoclastics reflect a secondary magnetization acquisition age, most likely, corresponding to local tectonic event where the rocks are genetically related to fault system in the area.
1. Introduction
Volcanism is a major contributor to the formation of important uranium (U) deposits [1]. The International Atomic Energy Agency (IAEA) tabulation lists 100 volcanogenic U deposits in 20 countries, which amount to 6 percent of the known global resources [2]. Generally, felsic volcanic rocks proximal to U deposits typically contain U concentrations in excess of 10 ppm. Enriched U contents are characteristics of rocks with aluminous and alkaline affinities [3].
In south of Egypt, the alkaline igneous activity can be related to major tectonic event [4,5]. Black et al. [6] and Bowden [7] reported that the occurrence of alkaline provinces in North Africa (including Egypt) is controlled by major lithosphere weaknesses represented by the Trans African Lineament (TAL) and the Central African lineament (CAL) megashears (Figure 1(a)). According to [8], the ENE-WSW trending tectonic zones in southern Egypt have a comparable strike of these two major megashear zones.
Nusab El Balgum mass complex, which is the subject of this study, represents one of the volcanic and subvolcanic alkaline activities in the south Western Desert of Egypt, at the intersection of lat. 23˚17'N and long. 29˚18'E (Figure 1(b)). Abu Elatta, et al. [9] suggested that this mass complex may be due to the intersection of an ENE-WSW trend of CAL (the most important part of this lineament in the southwest of Egypt is the Kalabsha fault, [10]) with Tarafawi-Qena-South Sinai Arch of NE trend (Arch built along major fracture zone forming the plate or sub-plate). According to [11], the volcanic activities took place in Permo-Triassic age, but from geologic evidences, they may begin at Late Triassic, associating with rifting of the Central Atlantic Ocean which led to the formation of main mass complex.
Generally, Nusab El Balgum mass complex is of a considerable geological interest for the discovery of some radioactive anomalies in the area [12]. Besides, the numerous igneous processes at the complex, despite its comparatively small volume, provide geochronologic insight to larger processes in the area and in a broader sense to regional alkaline igneous system. Therefore, the purpose of this study is fourfold; first, to define the main rock types of south Nusab El Balgum complex through petrographic investigations; second, to explain the unusual occurrence and distribution of the radioactive elements in these volcanic rocks as an attempt to establish some criteria that could help the U exploration; third, to infer the geochronological sequence of these areally restricted rocks using paleomagnetic and rock magnetic methods and discuss their formation events in a regional context, using recently published paleomagnetic results to a time-averaged reference Apparent Polar Wander Path (APWP) for Africa; and, fourth, to help in further refining of the Mesozoic APWP of Africa.
2. Field Relations and Observations
Nusab El Balgum mass complex occurs as elongated body (~12 Km × 4 Km), trending NNE-SSW and surrounded by a peneplain surface, represented by sandstone of the Six Hills Formation of late Jurassic-early Cretaceous age [13] and windblown recent sands. The main mass complex is composed mainly of rhyolitic lava flow, banded tuffs, agglomerates, jasperoid veinlets or clots and breccias of vent type, as well as parallel dyke swarms
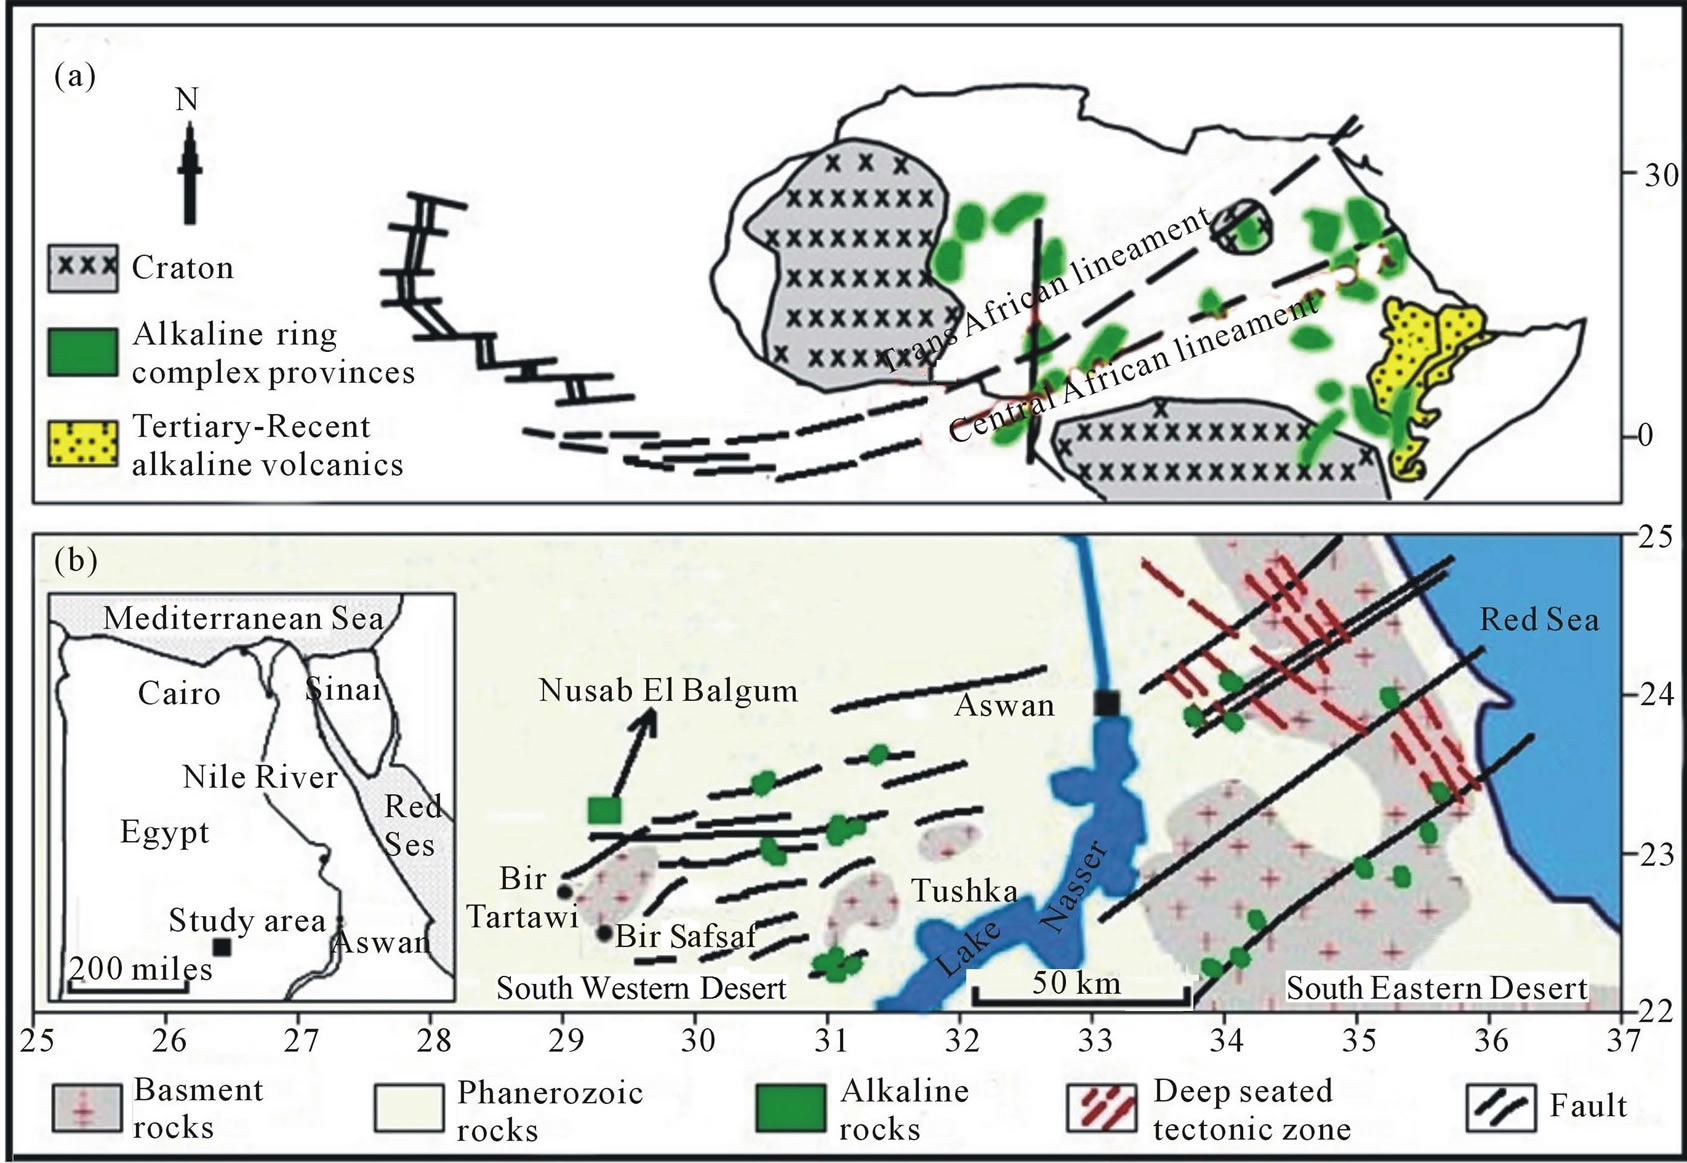
Figure 1. Compiled geologic maps showing: (a) Pre-Cambrian Cratons, Trans African Lineament, Central African Lineament and alkaline provinces of North Africa. (b) Lineaments and alkaline complexes of south Egypt, including Nusab El Balgum mass.
of trachytic and rhyolitic types. Based on this composition and the evident field relations, [12] considerd Nusab El Balgum mass as an example for a caldera complex, where a caldera is a large basin-shaped volcanic depression with diameter greater many times than that of the included vent or vents and comprising dykes, sills, stocks, vent breccia, crater fill of lava, talus beds of tuffs and agglomerate. Figure 2 illustrates both of the main crater of Nusab El Balgum mass, which composed of the above mentioned rock types, and some field observations in the area.
Mapping of south Nusab El Balgum mass complex was performed by the authors through field survey, including intensive sampling for some rock types and petrographic investigations. As illustrated from the field observations (Figure 2) and the geologic map (Figure 3), the different rock types in the area were represented by volcanic rocks and their pyroclastics, sub-volcanic altered peralkaine granites, structurally controlled mylonitic volcanoclastic rocks, sandstone of the Six Hills Formation and windblown sands. As the main purpose of this research is the study of some alkaline rocks, concentration is focused on the volcanic rocks and the peralkaline granites.
The volcanic rocks and their pyroclastics (tuffs and agglomerates) represent the main mass of the complex (Figures 2 & 3). Besides, parallel dyke swarms of rhyolitic type, nearly trending N 40˚ E, are located along the southeastern side of the mass with variable length and width.
The altered peralkaline granites crop out as small stock intrusions with low relief (the highest peak is about 30 m above the surroundings) intruding the volcanic rocks. Xenoliths from both of the volcanics and sandstones of the Six Hills Formation are found within their shield margins. Generally, most of the granites are dark massive rocks, strongly affected by hydrothermal alterations which represented by silicification, sericitization, carbonatization and kaolinitization. Dark color fracture due to Fe-Mn oxy-hydroxides alterations are also present. Finally, the mylonitic volcanoclastic rocks occur west of the study area along NE-SW left lateral strike-slip fault as a smoky color rock, with well-developed bands.
Structurally, the area of Nusab El Balgum complex was affected by two types of predominant faults. The oldest one of right lateral movement (known as Kalabsha fault) strikes ENE-WSW and dips from 75˚ - 80˚ NNW, with width zone ranging from 20 - 60 m. The second
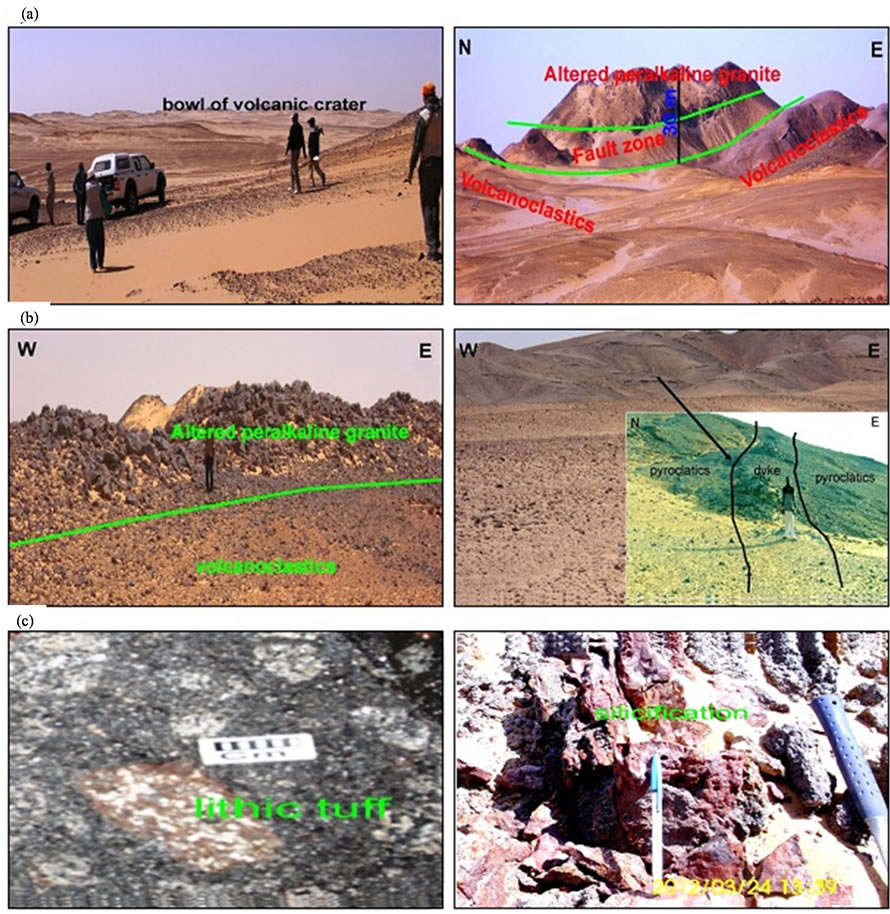
Figure 2. View shows: (a) Bowl of the volcanic crater and the main rock types of the mass complex, (b) ENE-WSW fault zone between the granites and volcanoclastics, and NE-SW alkaline dyke extruded in the pyroclastics, (c) Lithic tuffs and silicified alteration in the peralkaline granites.
type of left lateral movement strikes N30˚ - 37˚E and dips from 75˚- 80˚ SE, with width zone ranging from 20 - 30 m. The two types were characterized by gouge fault planes, hematitization, brecciation and mylonitization.
3. Petrographic Investigations
Petrographic investigations were done for thin sections of some representative samples using a Nikon (optical-pol) polarizing microscope, equipped with a full automatic photomicrograph attachment (Microflex AFX-II). Results of the optical examination for the different rock types are illustrated in Figures 4 to 8 and summarized as follows:
1) Rhyolitic crystal tuffs
They are composed of quartz, feldspars (orthoclase perthite, string perthite and plagioclase), chalcedony and opaques as well as lithic fragments of rhyolite set in a fine matrix of rhyolitic composition texture. Quartz occurs as euhedral to subhedral crystals, most of them are cracked with hematite filling and showed the effect of the
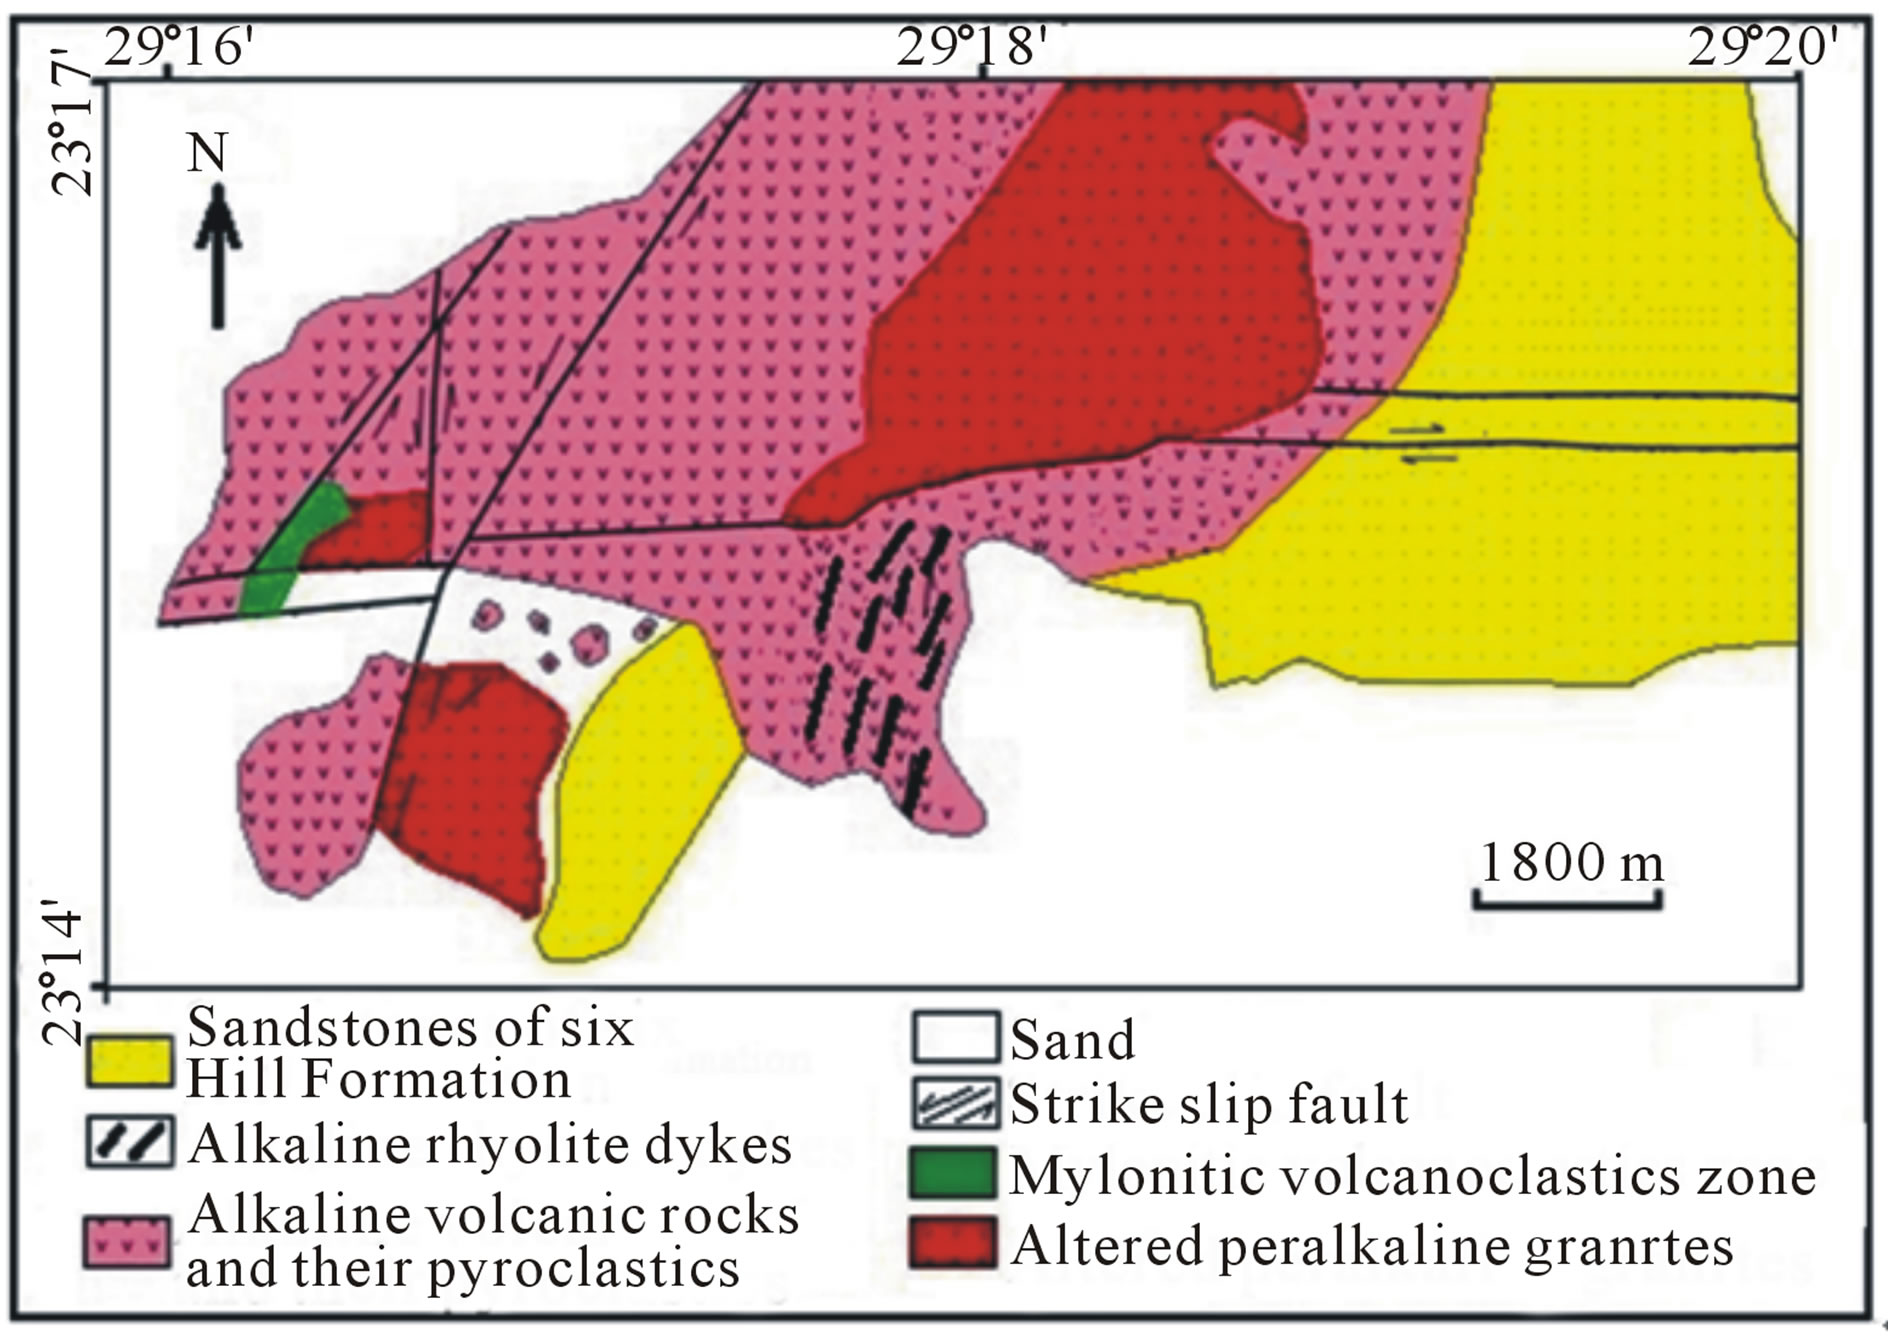
Figure 3. Geologic map of south Nusab El Balgum mass complex, south Western Desert, Egypt.
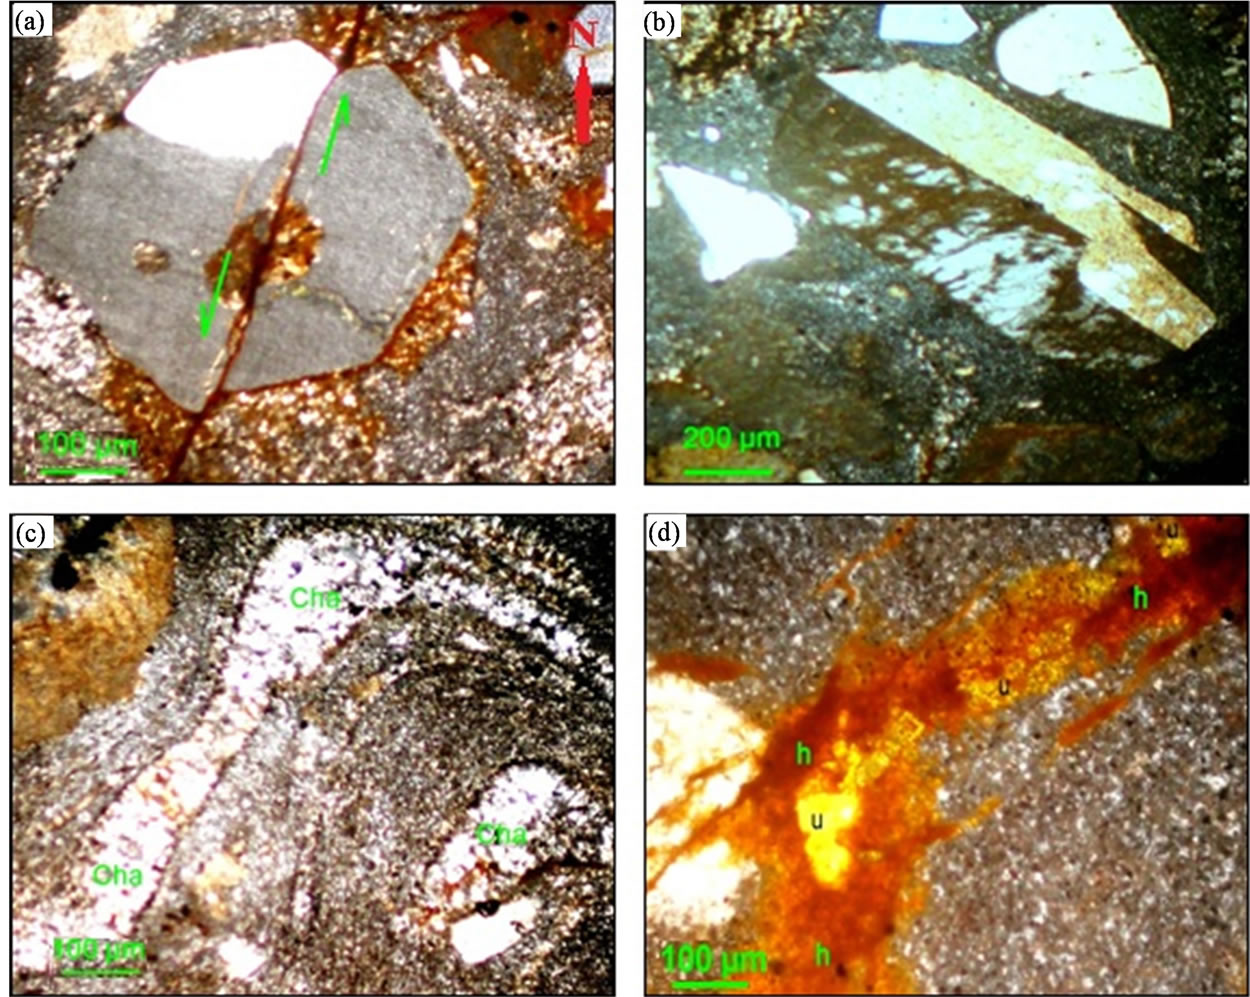
Figure 4. View shows: (a) Sinistral ENE-WSW fault, (b) Orthoclase perthite, (c) Chalcedony occurs as kink bands and (d) Amorphous secondary uranium associated with iron in the rhyolitic crystal tuffs.
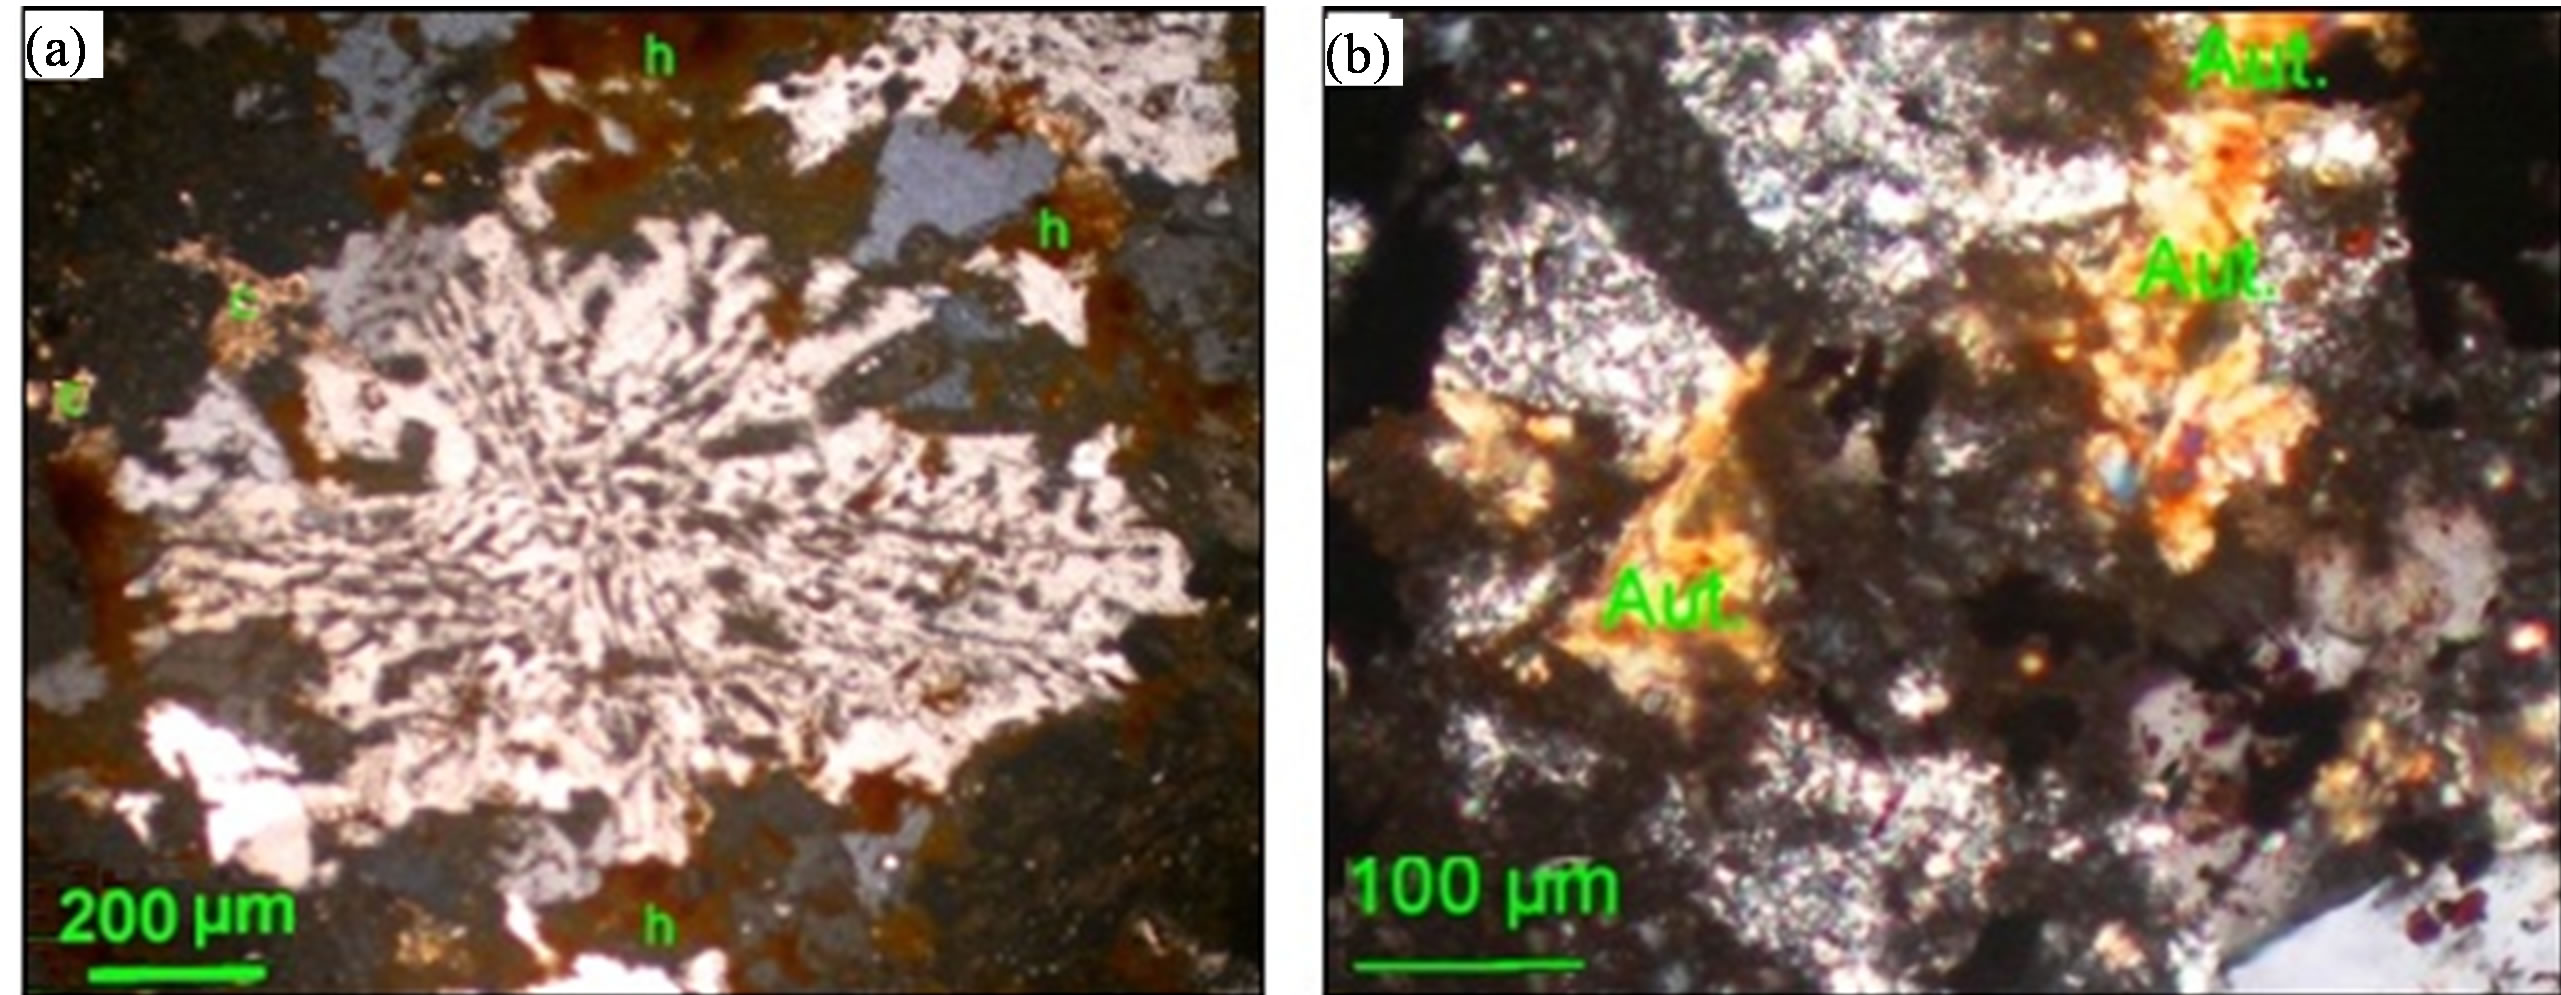
Figure 5. View shows: (a) Spherulitic texture and (b) Autunite in the Spherulitic rhyolite rocks.
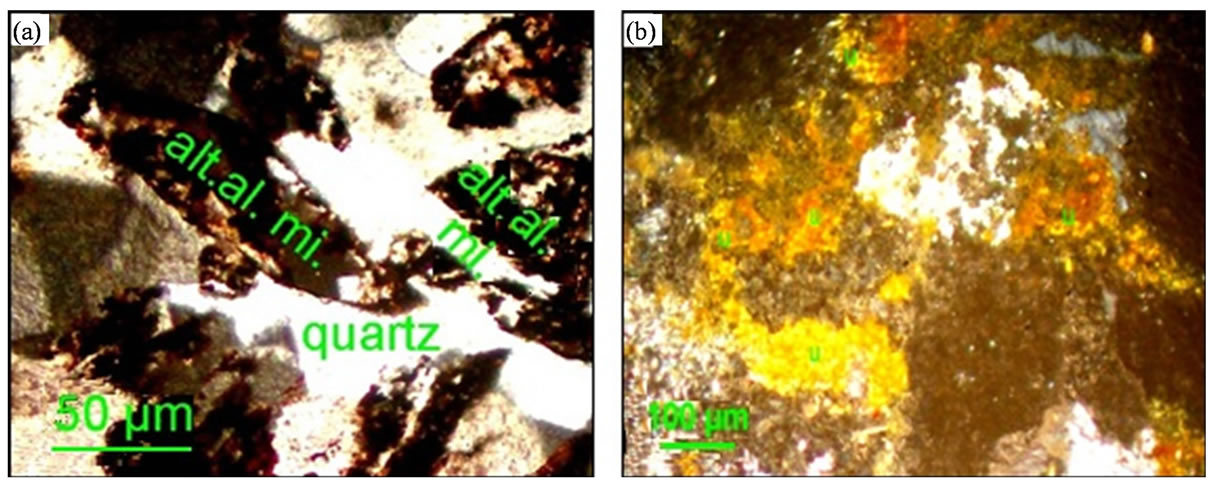
Figure 6. View shows: (a) Altered alkali minerals and (b) Amorphous secondary uranium occurs as coating upon the quartz and feldspar crystals in the alkaline rhyolite dykes.
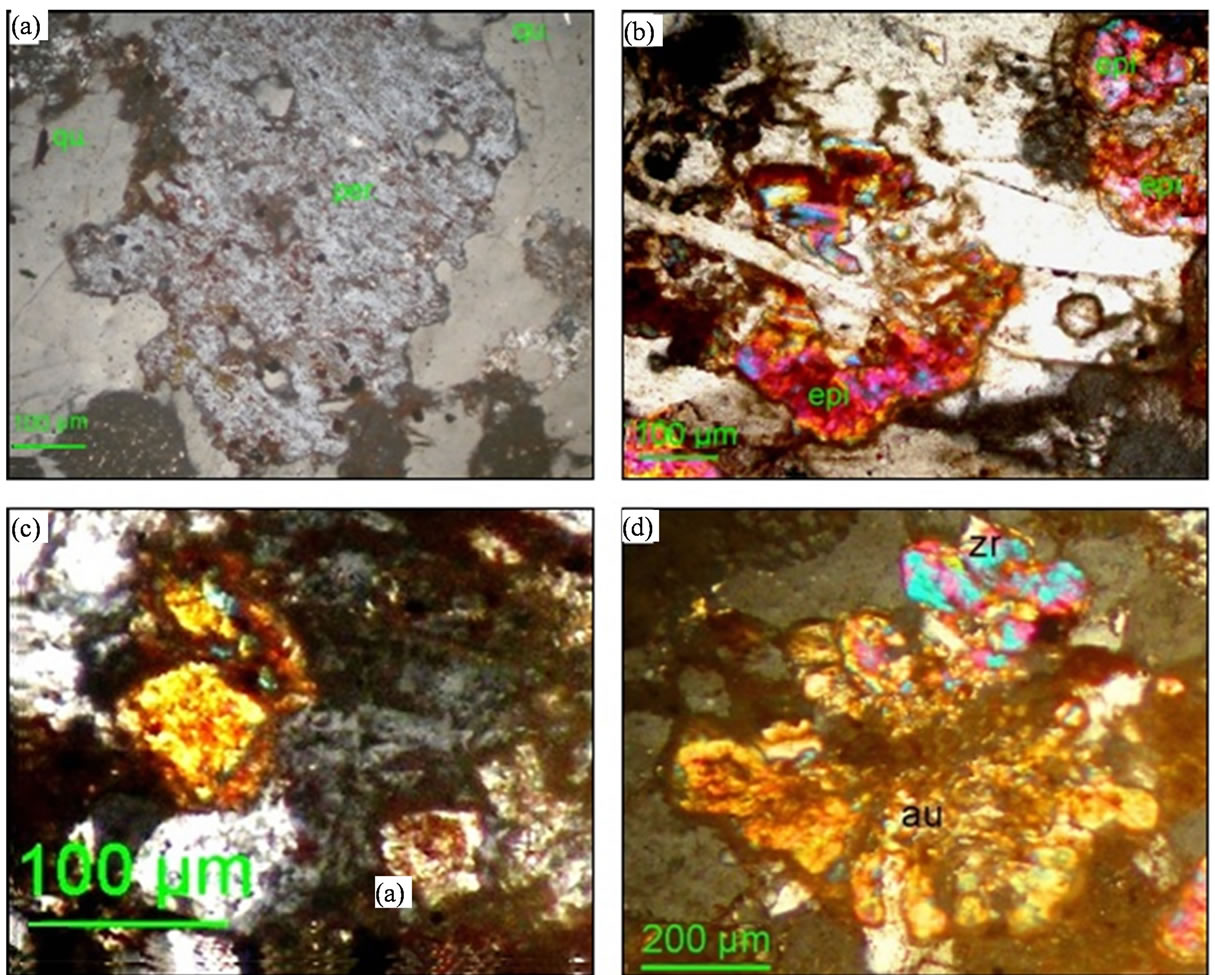
Figure 7. View shows: (a) String perthite, (b) Anhedral crystals of epidote, ((c) & (d)) Uranophane boxworks and autunite secondary uranium minerals in the altered peralkaline granites.
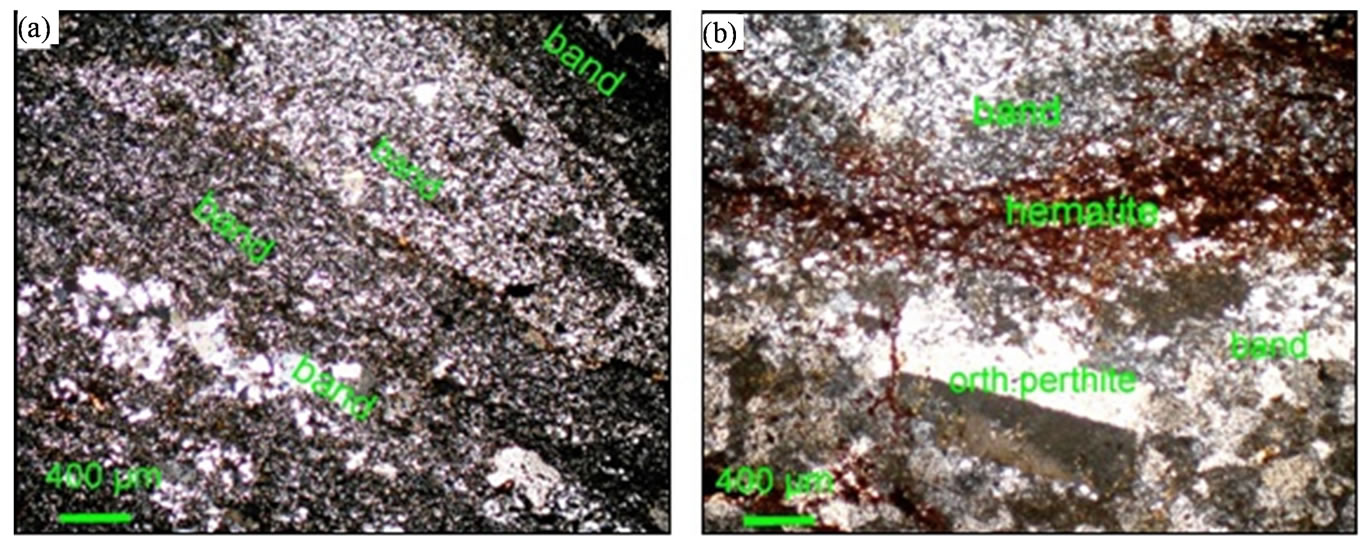
Figure 8. View shows: (a) Banding and (b) Orthoclase perthite parallel to the band in the mylonitic volcanoclastic rocks.
strike slip faults in the area (Figure 4(a)). Orthoclase perthite occurs as euhedral to subhedral crystals showing simple twinning (Figure 4(b)), but some crystals are highly sericitized. String perthite occurs as subhedral to anhedral crystals, partially or completely sericitized. Plagioclase is rare and occurs as subhedral to anhedral crystals corroded by the groundmass. Most of the feldspar crystals are broken and filled by hematite. Chalcedony often displays some kind of distinctive banding (Figure 4(c)). On the other hand, opaques constitute about 8% of the whole rocks and most of them represented by sulphides (sphalerite and pyrite) and magnetite. Amorphous secondary uranium is associated with hematite or filling the fractures (Figure 4(d)).
2) Spherulitic rhyolites
They are composed mainly of quartz, potash feldspars, albite and minor alkaline minerals. The spherulites formed as a result of intergrowth between potash feldspars and quartz (Figure 5(a)). Albite is intergrowth with potash feldspar forming subhedral perthite crystals. Opaques and zircon represent the main accessory minerals, while carbonate and hematite are secondary products. Opaques occur as small irregular crystals of magnetite, while zircon is rare and occurs as fine crystals. Carbonate occurs as fine-grained aggregates distributed over the whole rocks, while hematite filling the fractures and cracked crystals. Secondary uranium mineral occurs as a rose-like shape, autunite (Figure 5(b)).
3) Alkaline rhyolite dykes
They are composed essentially of quartz, alkali feldspars (perthite and orthoclase perthite) and alkaline minerals. The accessories are opaques, zircon, monazite, apatite and fluorite, while carbonates, hematite and amorphous uranium are secondary products. The phenocrysts reach up to 20% of the rock and represented by randomly scattered plates of alkali feldspars, embedded in finegrained of the same above minerals. Quartz phenocrysts occur as patches forming micropoikilitic texture in between alkali feldspars or intergrowth with them forming graphic texture. Alkaline minerals occur as prismatic crystals (radiating and patches), most of them are altered (Figure 6(a)), not easily to recognized and occur within feldspars and quartz. Opaques represented by magnetite (associated with decomposed phenocrysts of alkali feldspars), elmenite and pyrite. Zircon occurs as fine crystals adjacent to the black opaque grains, while monazite occurs as minute crystals and relatively more than zircon. Both apatite and fluorite occur as fine irregular grains associated with the alkaline minerals, while carbonates are regularly distributed through the rock. Amorphous secondary uranium occurs as coating upon the quartz and feldspar crystals (Figure 6(b)) and observed filling fracture planes as a rose-like shape.
4) Altered peralkaline granites
The essential minerals of the peralkaline granites exhibit different degrees of alteration, Fe-Mn oxy-hydroxides alterations, with well-presented original structural characteristics of the rock. Manganese oxides occur along the fractures while iron oxides being heterogeneous in the intensity and distribution. The dominant potash feldspars occur mainly as anhedral perthite crystals of string and patch types and graphically intergrowth with quartz forming graphic texture (Figure 7(a)). Some of the crystal cores are fresh while the peripheries were stained by iron oxides. Besides, some of these crystals were completely transformed to silica, hematitized by the action of hydrothermal solutions in silicified variety. Alkaline minerals are completely metasomatized forming pseudomorphs iron oxides and silica or may change to nearly opaques, especially along its cleavages, as a result of strong invading of Fe3+ ions. The alkaline amphibole may also be changed to carbonates which developed as patches or crystals and microveinlets. Zircon occurs in clusters of short prismatic crystals while monazite occurs as minute crystals. Opaques distributed over the thin section and represented by magnetite (most of them occur as grid-like crystals), pyrite and chalcopyrite (subhedral to anhedral). Hematite and goethite also found while epidote is very rare and occur as anhedral crystals (Figure 7(b)). A secondary radioactive mineral represented by uranophane was observed as a boxworks (Figure 7(c)) or in association with the silicification or filling the fractures in the primary quartz. Autunite is another secondary radioactive mineral occurs as rose-like crystals associating hematite upon the primary quartz (Figure 7(d)).
5) Mylonitic volcanoclastic rocks
Mylonitic volcanoclastics are mainly composed of porphyroclasts and matrix as well as opaques and hematite. The porphyroclasts represented by quartz with relatively very small crystals of orthoclase perthite and perthite. The matrix or groundmass forms finely layered or bands and composed of fine-grained recrystallized material represented by quartz, sericite, clay minerals and opaques (Figures 8(a) & (b)). Quartz occurs in two generations; porphyroclast and fine-grained crystals. The crystals are anhedral, corded and show strong wavy extinction. Orthoclase perthite and perthite crystals are parallel to the bands, partially sericitized, fractured and corroded margins by matrix. Opaques are represented by sphalerite, pyrite and magnetite. The sphalerite occurs as anhedral crystals or filling micro fractures while pyrite and magnetite exist as small subhedral to anhedral crystals or as interstitial skeletal crystals and irregular patches. Hematite also occurs among the bands or filling fractures.
4. Radiometric Investigations
4.1. Analytical Methods
Field gamma-ray spectrometry measurements were carried out for some different rock types of Nusab El Balgum complex using RS-230 spectrometer. The instrument is used for measuring concentrations of the three radioactive elements potassium (K%), equivalent uranium (eU ppm) and thorium (Th ppm) by detection of their gamma-rays in selected energy intervals, which are fixed by channels of the amplitude multichannel analyzer. Results of the measurements and the calculated statistical parameters are listed in Table 1.
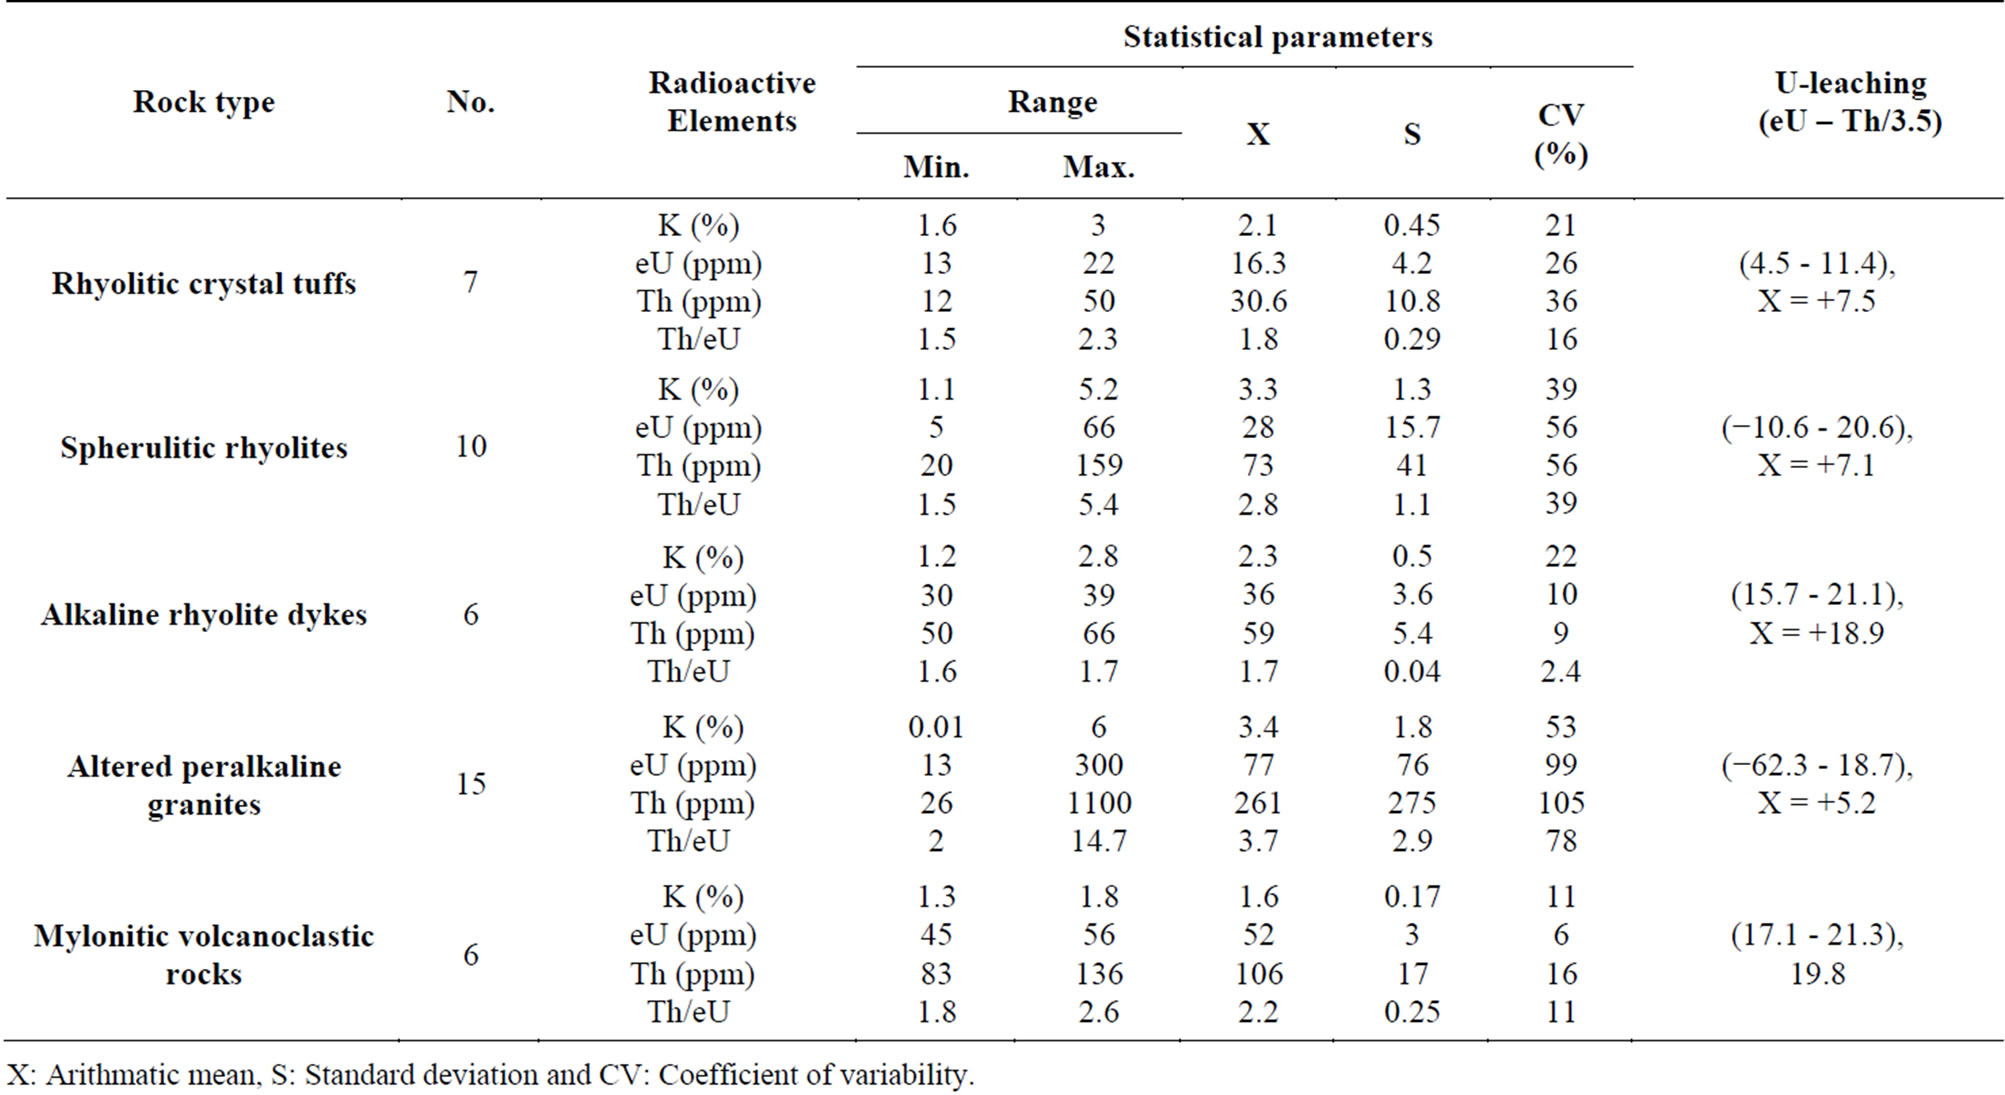
Table 1. Gamma-ray spectrometry data for the different rock types, south Nusab El Balgum mass complex, south Western Desert, Egypt.
X: Arithmatic mean, S: Standard deviation and CV: Coefficient of variability.
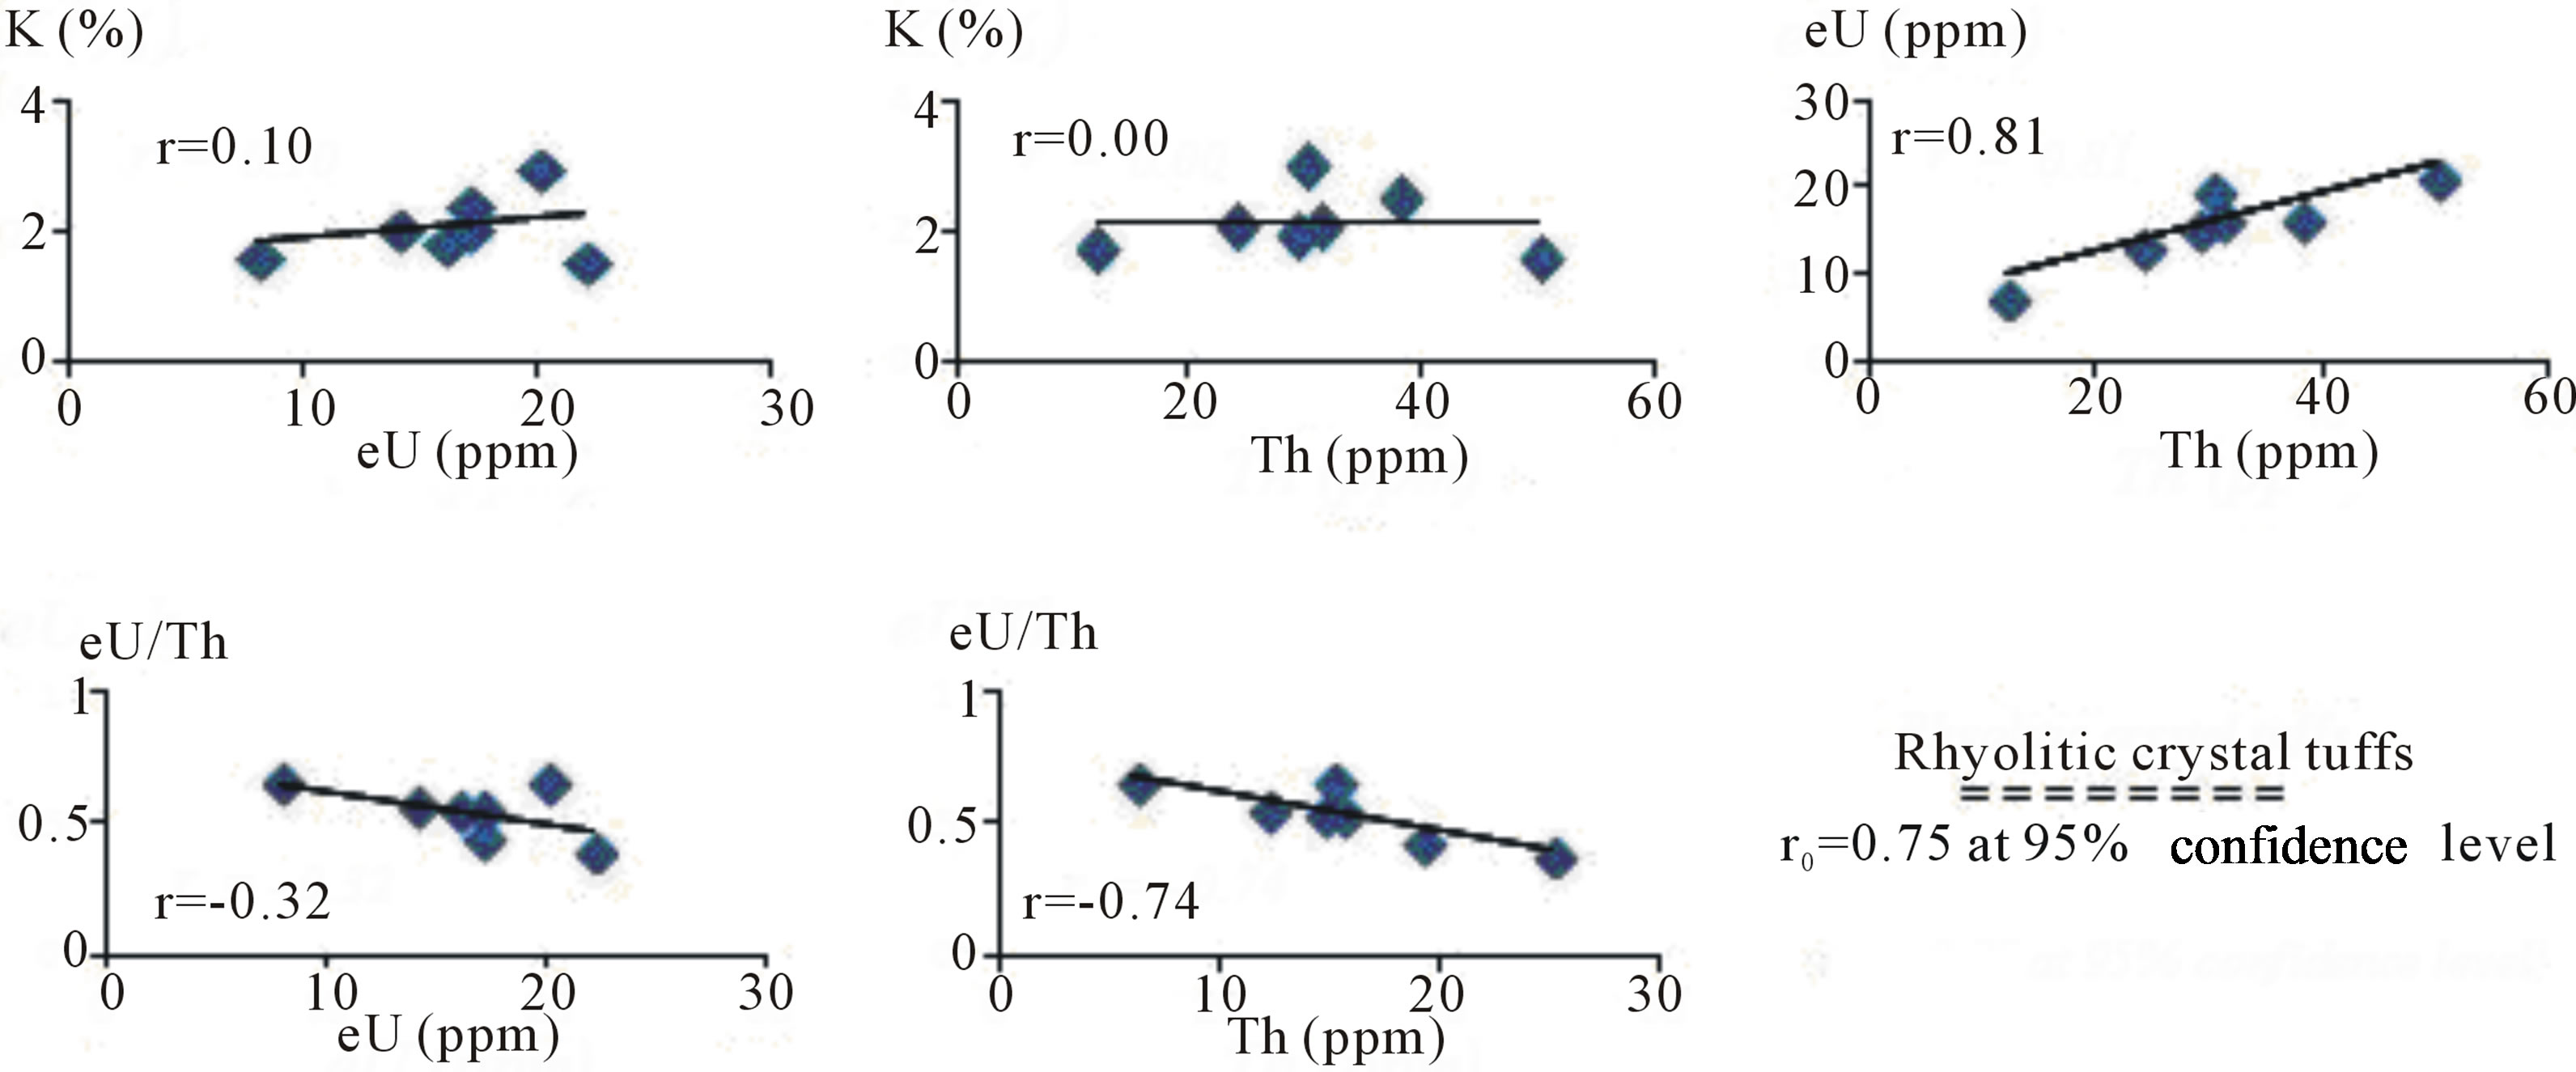
Correlation between the three radioelement concentrations as well as correlation of eU/Th ratios with both eU and Th concentrations was carried out and illustrated in Figures 9 & 10. This aims to investigate the mutual relation and strength of association between these parameters, which, consequently, reflect distribution and remobilization of the radioelements, particularly uranium. The relation (goodness of a trend) was estimated through calculation of the linear Person correlation coefficient “r”, with reliability checked against critical values “ro” at 95% confidence level [14].
4.2. Discussion and Interpretation
The visual examination of Table 1 showed some variations for K concentrations within and between the different studied rock types, with the highest and very close average values (3.4% & 3.3%) reported in the peralkaline granites and the spherulitic rhyolites, while the lowest value (1.6%) is at the mylonitic volcanoclastics. The calculate coefficient of variability (CV) values reflect a relatively high variability distribution for K concentrations within both the peralkaline granites (average of 53%) and the spherulitic rhyolites (average of 39%) which is expected in view of the observed post-magmatic alterations (carbonatization and sericitization) for these rocks. Despite the presence of such variability, there is no any significant correlation between K and both eU and Th for each of the different rock types (Figures 9 &
10). This appears to broadly coincide with the fact that K is a wide spread element in the crustal rocks, since it consider as a major element in the rock forming minerals, particularly the acidic rocks. On the other hand, the relatively high variability distribution for the K concentrations within both the peralkaline granites and the spherulitic rhyolites suggested, therefore, that K is closely associated with the mineralogical changes due to alteration, and not allied with increasing of eU and Th concentrations. This fact seems an adequate target for aerial and ground surveys and may provide a means of distinguishing between hydrothermally-altered high-potassium zones and unaltered rocks of similar composition.
Regarding the principle radioactive elements eU and Th, they showed much variation within the different rock types of the complex. The rhyolitic crystal tuffs is marked by relatively high average contents of eU (16.3 ppm, approximately 4 times the Clark value) and Th (30.6 ppm) than the average concentrations record for their equivalent normal granites. The average Th/U ratio is low (1.8 ppm) and close to the minimum value of range of the granitic rocks, between 2 and 6 ppm [15,16], indicating U addition to the rocks [16]. This, also, confirmed from the calculated leaching values of uranium, which gave an average positive value of about 7.5 ppm. The U-leaching value is the difference between eU and the theoretical (Th/3.5) value, and generally represented by positive sign for U-enrichment (leaching in), negative sign for U-depletion (leaching out) or zero value (no
 (a)
(a) (b)
(b)
Figure 9. The relationships of, K-eU, K-Th, eU-Th, eU/Th-eU and eU/Th-Th for the rhyolitic crystal tuffs and spherulitic rhyolites, south Nusab El Balgum mass complex, south Western Desert, Egypt.
depletion or enrichment). As illustrated in Figure 9(a), a significant positive correlation exist between eU and Th (r = 0.81), which suggest that U is associated with Thrich accessory minerals. On the other hand, the eU/Th ratios exhibit a good negative relation with Th and also tend to decrease with decreasing eU. This behavior suggested that some of the Th content is concentrated mainly in the primitive phases of magmatic evolution and remain fixed (relatively immobile), while there is a limited mobilization of the uranium within the rocks [17,18]. This suggestion is confirmed from the calculate coefficient of variability (CV) values (Table 1) which reflect relatively higher variability for Th concentrations within the rocks (average of 36%) than the eU (average of 26%).
Regarding the spherulitic rhyolites, they recorded higher concentrations for both eU (averaging 28 ppm) and Th (averaging 73 ppm) than the rhyolitic crystal tuffs. Despite these anomalously high concentrations, the average Th/eU ratio (2.8 ppm) falls within the range of the granitic rocks (between 2 and 6). These evidences, with the calculated low positive U-leaching value (7.1 ppm), suggest that U was derived mostly from the rocks itself with some addition from outer sources [16]. The eU and Th concentrations exhibit a significant positive relation (r = 0.77) whereas there is no any relation between eU/Th ratio and both of the two elements (Figure 9(b)), indicating an association between eU and Th within the same accessory minerals, with a much limited mobility of eU within the rocks. This fact broadly coincides with the calculated CV values which reflect the same variability distribution (56%) for both eU and Th within the rocks.
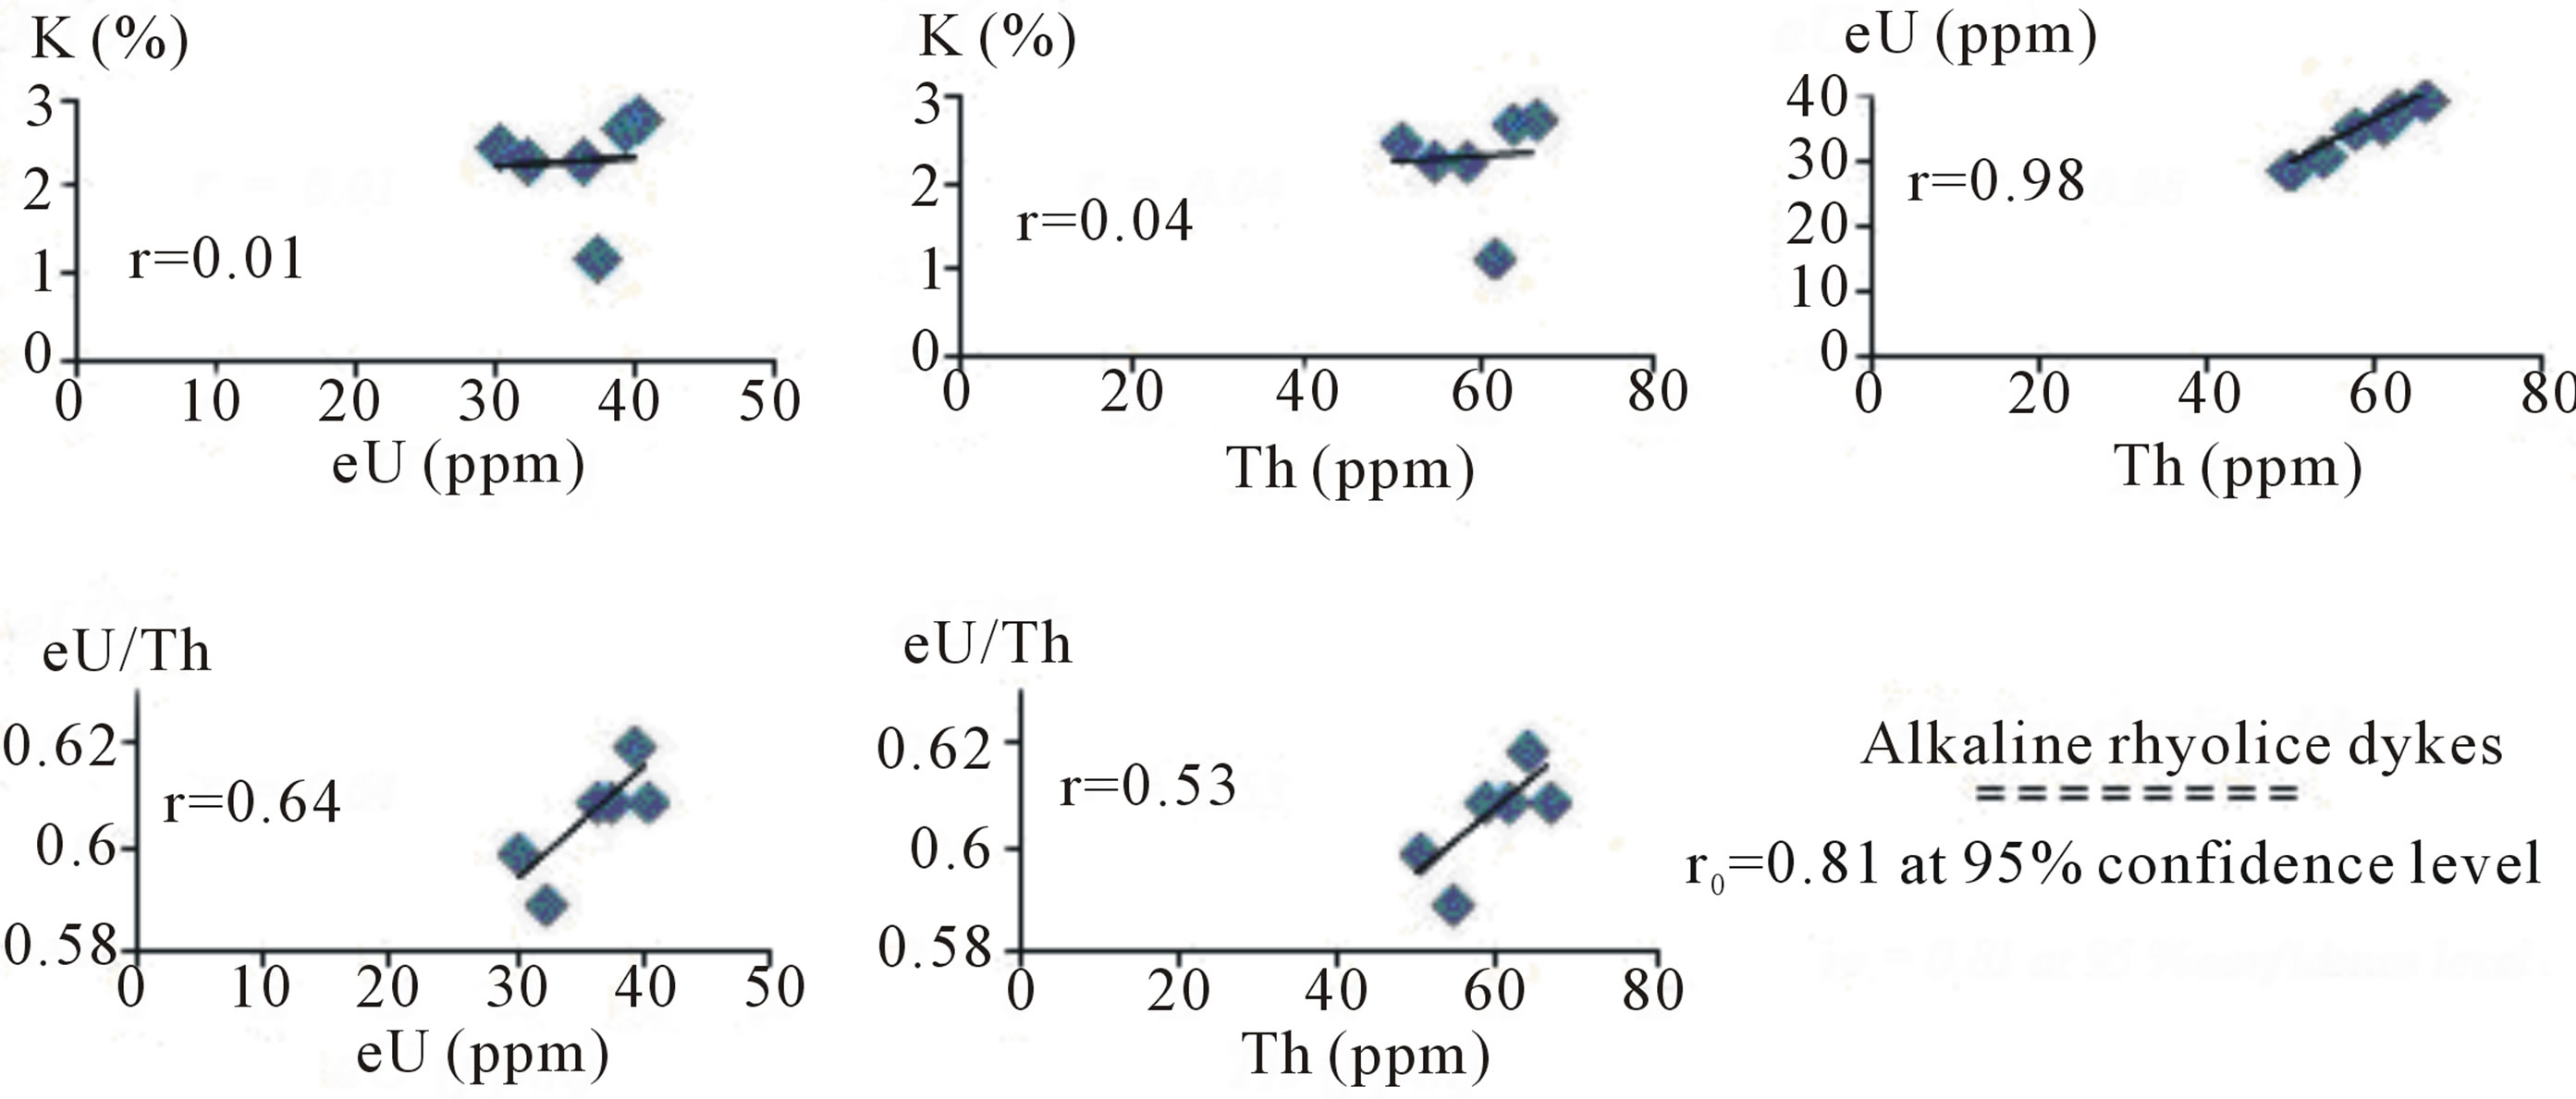
The alkaline rhyolite dykes show high and homogeneous concentrations for both the eU and Th, with a relatively lower average Th/eU ratio (1.7 ppm) than their equivalent rocks. This indicates much additions of U from outer sources [16], which agree fairly well with the calculated high U-leaching average value (+18.9 ppm), reflecting the enrichment of uranium (leaching in). The trend defined in the correlation of eU with Th concentrations (Figure 10(a)) exhibit a very good positive relation (r = 0.98), furthermore, the eU and Th concentrations exhibit very close average CV values (Table 1). This indicates that eU is largely associated with Th within the
 (a)
(a)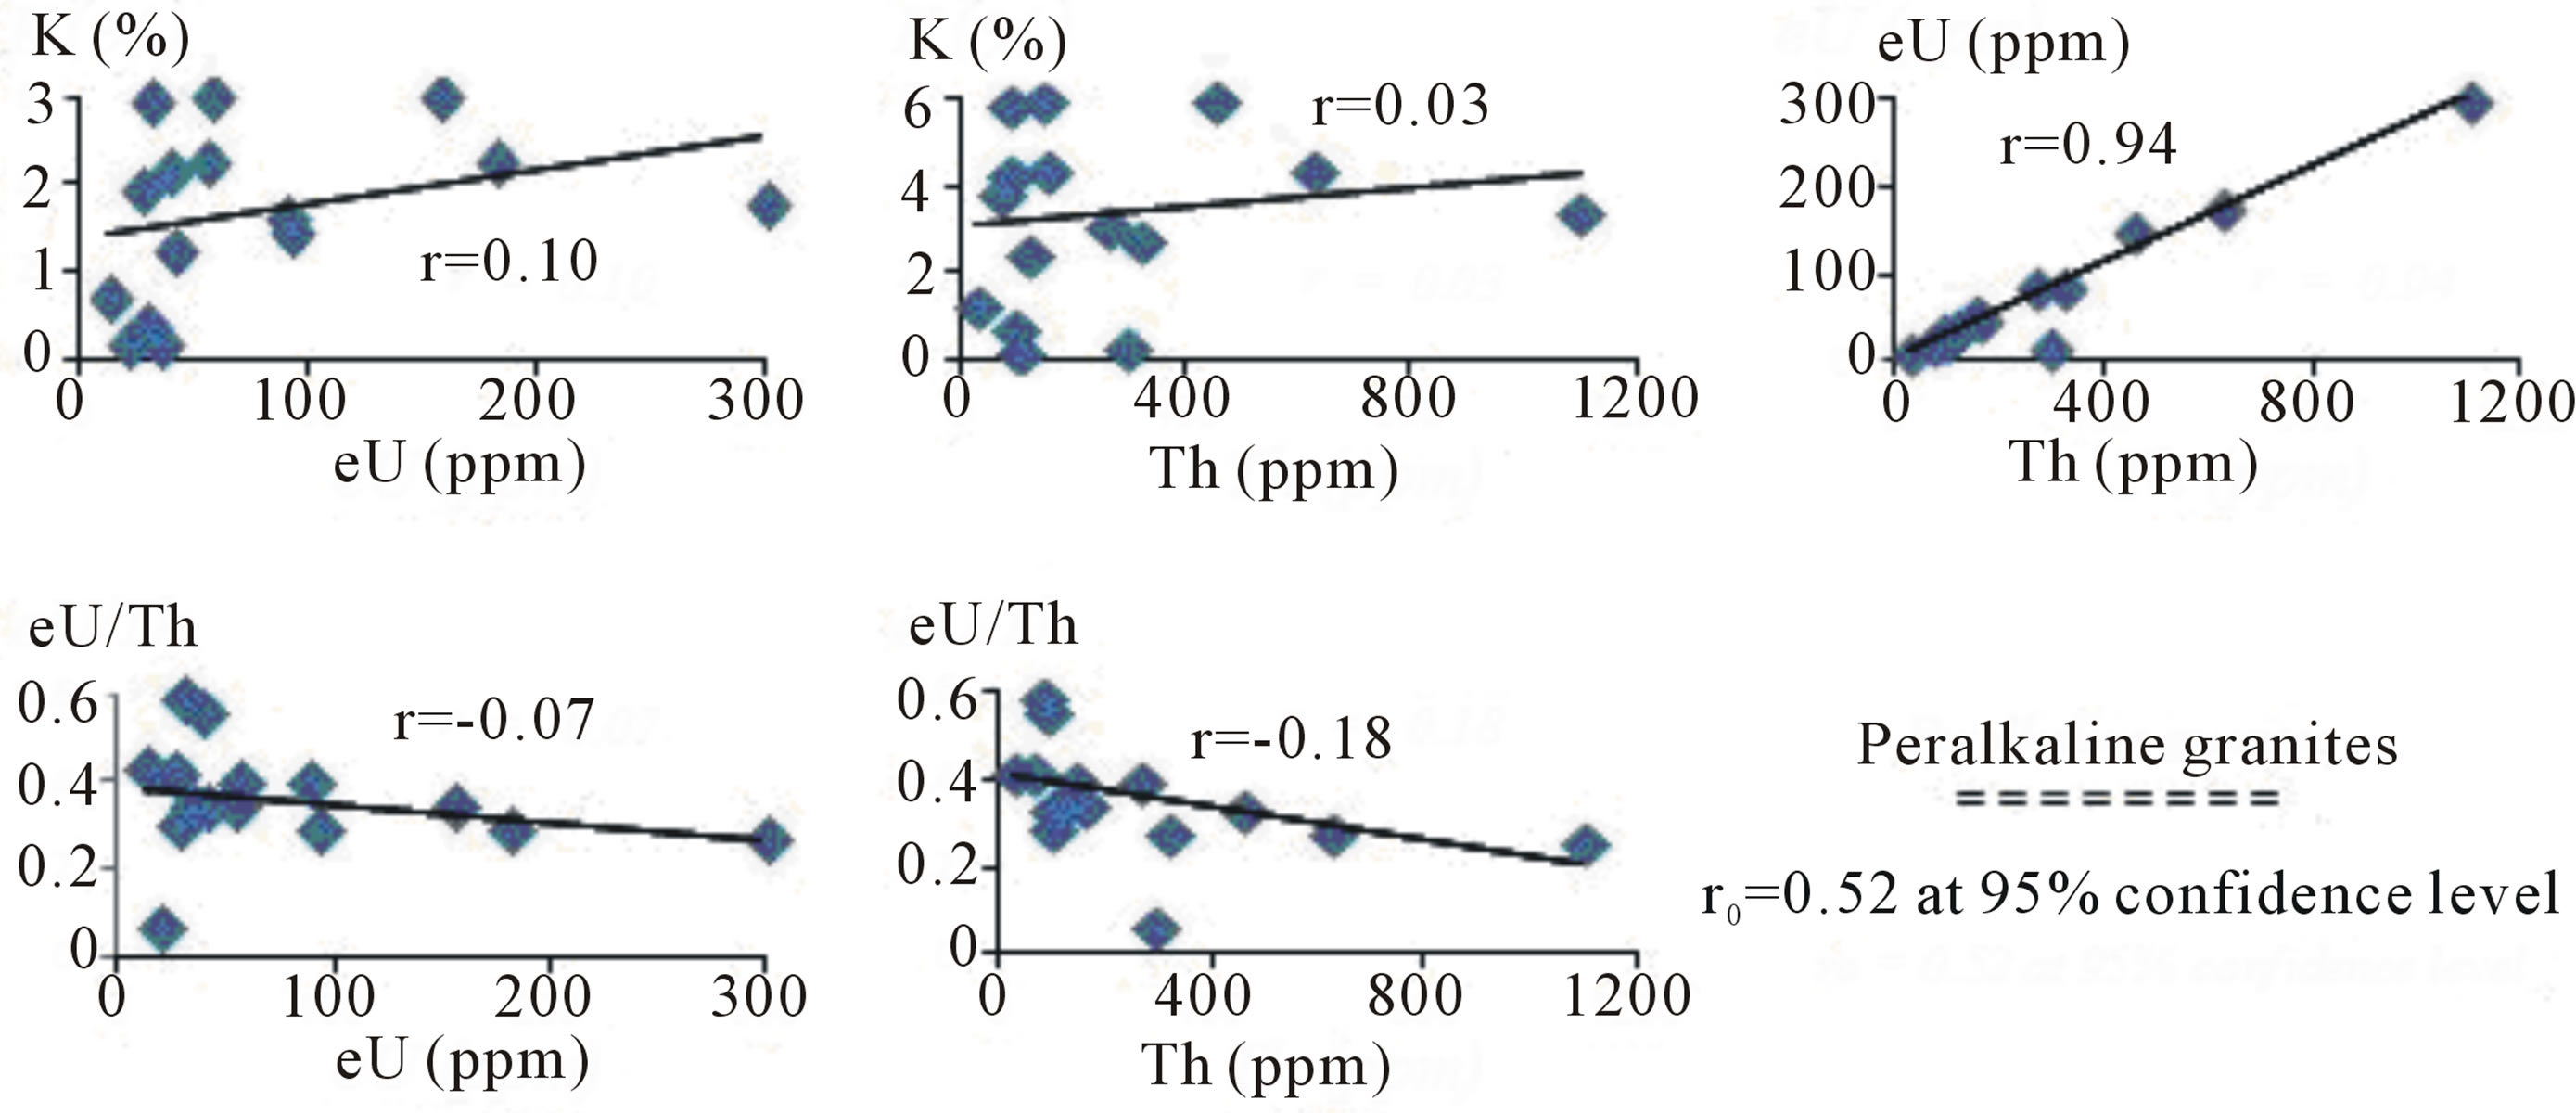 (b)
(b)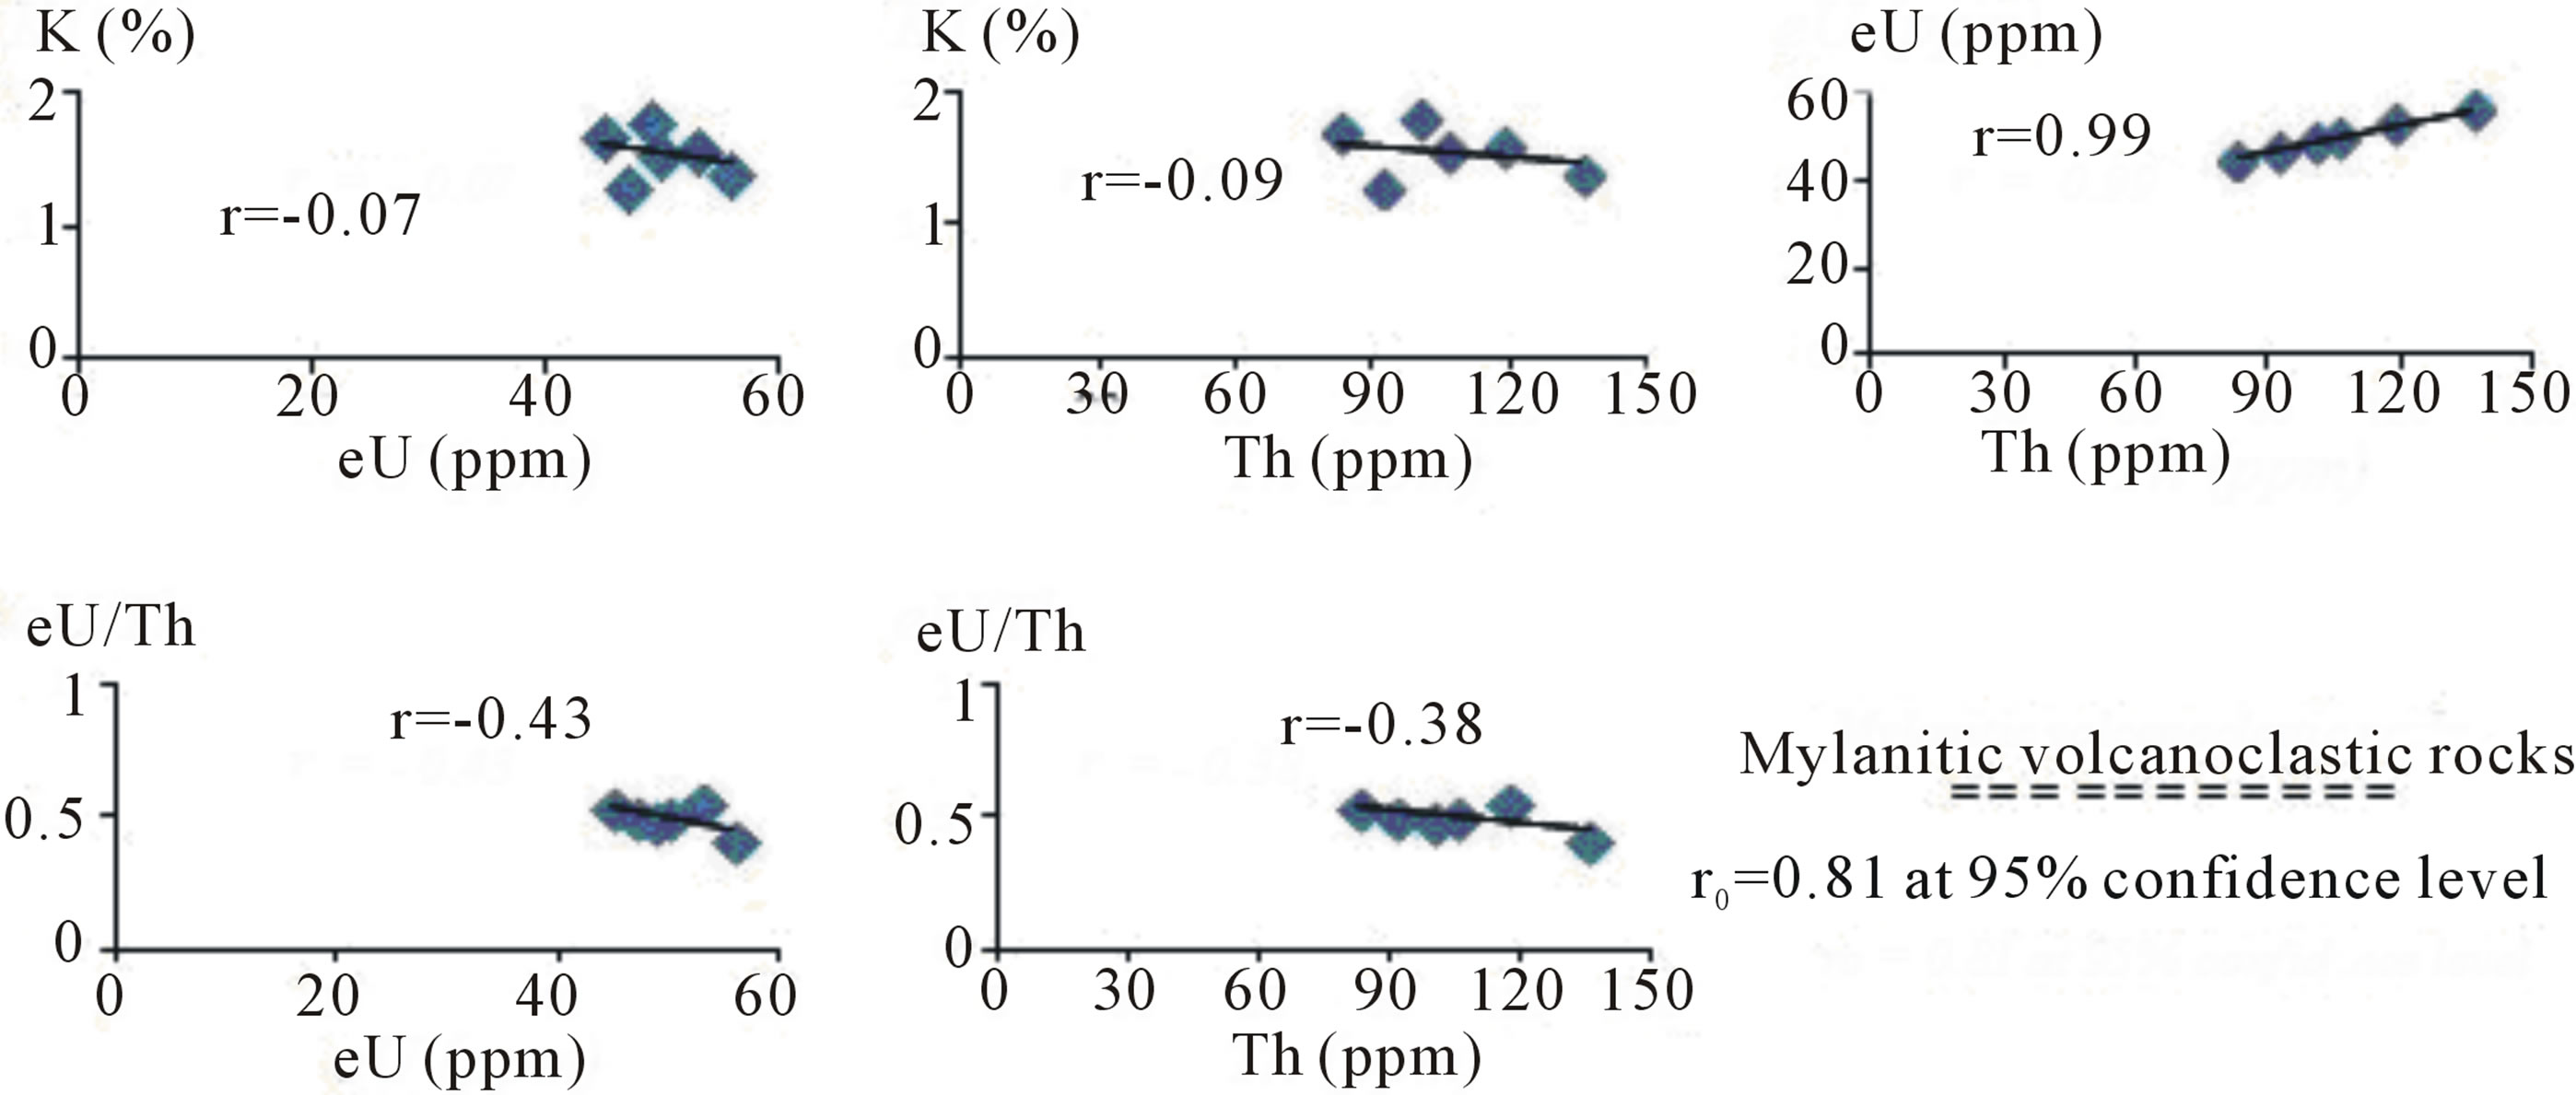 (c)
(c)
Figure 10. The relationships of, K-eU, K-Th, eU-Th, eU/Th-eU and eU/Th-Th for the peralkaline granites, the alkaline rhyolite dykes and the mylonitic volcanoclastic rocks, south Nusab El Balgum mass complex, south Western Desert, Egypt.
same accessory minerals. The eU/Th ratios show a remarkable increase with increasing both of the eU and Th concentrations, with a relatively higher tendency with eU. This, also, reflects the strong association between eU and Th with limited mobilization for eU within the rocks.
The peralkaline granites are marked by a fairly high eU contents (averaging 79 ppm), with very high average values of the calculated statistical parameters S and CV. Thus, these granites are considered uraniferous and belong to group IV granites of [19], which is favorable for U mineralization. These granites, also, appear to be Th-rich (theoriferous), where the average Th concentration is about 261 ppm. The average value of Th/eU ratio (3.8 ppm) typically falls within the range of granite rocks. The anomalously high eU and Th contents and the corresponding normal average Th/eU value, together with the significant positive correlation between eU and Th (Figure 10(b)), suggests that eU is largely associated with Th-rich accessory minerals. The calculated CV values support this suggestion and reflect very strong variability distributions, with very close CV values for both eU (99%) and Th (105%). The presence of Th-rich accessory minerals (thorite, uranothorite and ferrocolumbite) was confirmed by XRD analysis for representative samples of these granites [9,12]. Assessment of U mobilization within the granites is based on the relation of eU/Th ratios with both eU and Th contents, and the calculated U-leaching values. As illustrated in Figure 10(b) there is no any significant correlation for the eU/Th ratios with both eU and Th contents, but there is a very little decrease for the eU/Th ratios with increasing the eU and Th which reflects much limited mobility of the uranium within these granites. The U-leaching values show considerable variation (ranging from negative to positive values) over the studied granites, with an average of +5.2 ppm, which reflects some enrichment of uranium (leaching in). Enrichment of thorium relative to uranium in some site could be attributed to the presence of significant uranothorite and thorite where thorium is enriched relative to uranium. The occurrence of an apparent primary Uand Th-bearing mineral (uranothorite) and at least some U enrichment suggests a hydrotherml character for uranium.
Finally, the mylonitic volcanoclastic rocks are marked by high and rather homogeneous concentrations for eU (averaging 52 ppm) and Th (averaging 106 ppm). The average Th/eU ratio is relatively low, but falls within the range of the equivalent granitic rocks. As illustrated in Figure 10(c), a very strong positive relation exist between eU and Th (r = 0.99), while the eU/Th ratios exhibit negative relation with Th and eU. This behavior suggested that eU is largely associated with Th-rich accessory minerals which are believed to be hydrothermal in origin, in addition to the Th concentration in the primitive phases of magmatic evolution. Based on the calculated average U-leaching value (+19.8), U mobilization was strong and post magmatic. Generally, any rock showing strong U mobilization is expected to host epigenetic U occurrences [18].
In conclusion, the different rock types in south Nusab El Balgum mass complex recorded significant concentrations in terms of the two radioactive elements Th and eU. The rocks as a whole contain about 50 times more eU than their equivalent normal rocks, with considerable variations of the Th range. The hydrothermal processes have clearly altered the rocks, especially the granites and mylonite, and modified the eU and Th concentrations. Accordingly, the area is of considerable significant in view of exploration and still needs more surface and subsurface investigations in order to localize the most promising area for U mineralization.
5. Paleomagnetic Investigations
5.1. Sampling and Laboratory Method
For paleomagnetic investigations, oriented block samples were taken at different sites covering the studied rock types south of Nusab El Balgum mass complex. The samples were oriented in-situ, while still attached to the outcrops, using a magnetic compass and accurately located using GPS instrument. All the samples were subsequently reoriented in the laboratory where three to four 1-inch diameter cylindrical cores were drilled from each block and sliced into standard 0.87-inch length specimens to conform to the optimum length of the paleomagnetic measurements [20].
All the different paleomagnetic measurements were carried out at the Geophysical Laboratory of the Nuclear Materials Authority of Egypt. The bulk magnetic susceptibility was measured using a low-field Minisep (MS9) susceptibility meter while the natural remanent magnetization (NRM) was measured using a Jelinek JR-5A spinner magnetometer, with sensitivity reaching 2.4 mA/m. In order to remove secondary overprints and resolve the primary or characteristic remanent magnetization (ChRM), progressive alternating field (A.F.) and thermal demagnetizations were carried out using a Molspin (MSA2) shielded AF 2-axis tumble demagnetizer with a peak Field of 100 mT and a shielded MMTD-80 type furnace capable of heating to 800˚C, with 4 layers of mu-metal shield and a magnetic induction less than 10 nT, respectively.
The Fe-oxides which carry the NRM were investigated through isothermal remanent magnetization (IRM) acquisition experiments [21], using a Molspin MMPM9 pulse magnetizer, with an amplitude up to 3.0 Tesla (T), followed by subsequent stepwise thermal demagnetization of acquired IRMs and analysis of the unblocking temperature spectrum. In addition, some microscopic investigations of polished sections were also carried out for representative samples, using ore microscope, to identify the different ferromagnetic minerals.
5.2. Paleomagnetic Results and Analyses
5.2.1. Isothermal Remanent Magnetization
Progressive direct magnetic fields up to 1.0 T were applied to representative samples from the different rock types in order to determine the IRM acquisition patterns. The IRM intensity values were normalized to the saturation or the final magnetization value according to the behavior of the samples. Representative sample from the rhyolitic crystal tuffs showed an initial increase in IRM acquisition and acquired ~80% of the maximum IRM at field of 0.2 T, but did not saturate by the maximum field applied (Figure 11(a)). This behavior indicates that both high and low coercivity magnetic minerals are present [21-24]. Subsequent stepwise thermal demagnetization of the acquired IRMs for this sample displayed a maximum unblocking temperature at 680˚C, with an inflection point at ~580˚C (Figure 11(a')). This reflects the presence of significant amount of magnetite (with low coercivity, maximum unblocking of 580˚C) in addition to hematite (with high coercivity, maximum unblocking of 680˚C). Besides, a remarkable inflection point of the IRM demagnetization curve was also displayed at ~320˚C, which indicates the presence of some forms of iron sulfides. Microscopic investigation of polished section for representative sample indicates the coexistence of iron sulfides and magnetite as the main magnetic minerals (Figure 12(a)), while hematite was observed in the thin section as a fractures filling secondary mineral.
For the spherulitic rhyolite sample, the IRM acquisition curve showed an initial rapid acquisition of ~90% of the maximum IRM at fields <0.2 T, followed by gradual acquisition toward saturation up to 0.9 T (Figure 11(b)). This indicates that magnetite is probably the main ferromagnetic mineral present. Subsequent stepwise thermal demagnetization curve of the acquired IRMs displayed a remarkable unblocking temperature at 580˚C, while the maximum unblocking temperature was ~640˚C (Figure 11(b')). This behavior indicates that magnetite is the dominant magnetic mineral, with a slight amount of hematite. This result was confirmed through the microscopic investigation for polished section which indicates the presence of magnetite as the main ferromagnetic mineral (Figure 12(b)).
Representative sample of the alkaline rhyolite dykes exhibits a gradual IRM acquisition to ~69% of the saturation value at field of 0.3 T, followed by a steady acquisition with no saturation up to the maximum available 1.0 T, indicating the presence of both high and low coercivity magnetic minerals (Figure 11(c)). Demagnetization curve of the acquired IRMs displayed remarkable unblocking temperatures at 580˚C and 680˚C (Figure 11(c')), reflecting the presence of both magnetite and hematite. There is also a small kink for the IRM demagnetization curve at ~320˚C, indicating the presence of some forms of iron sulfides. Microscopic investigation of polished section for the same sample indicates that magnetite is the main ferromagnetic mineral coexisting with a significant amount of hematite (Figure 12(c)).
Regarding the peralkaline granites, its representative sample reached ~65% of its total IRM at 0.2 T, then steadily acquired its magnetization with no saturation up to the maximum field applied (Figure 11(d)), suggesting the presence of high and low coercivity magnetic minerals. Visual analysis of the thermal demagnetization curve of the acquired IRMs (Figure 11(d')) and microscopic investigation of polished section for the sample (Figure 12(d)) indicate that although magnetite is dominant, hematite is also present in a considerable quantity.
Finally, the representative sample from the mylonitic volcanoclastic rocks showed an initial rise to ~75% of the saturation value at field of 0.3 T, followed by a continuous slow rate of acquisition with no saturation up to the maximum available 1.0 T (Figure 11(e)). This behavior indicates the presence of both high and low coercivity magnetic minerals. The IRM demagnetization curve (Figure 11(e')) displayed two remarkable inflection points at ~320˚C and 580˚C, with a maximum unblocking temperature at ~660˚C. This reflects the presence of significant amounts of iron sulfides and magnetite, with a slight amount of hematite. Lower unblocking temperature at ~120˚C was also observed as a small kink on the demagnetization curve, suggesting the presence of slight amount of goethite (with high coercivity, maximum unblocking of ~100˚C). Microscopic investigation of the polished section indicates the coexistence of iron sulfides and magnetite as the main ferromagnetic minerals (Figure 12(e)).
5.2.2. The Initial Natural Remanent Magnetization
The initial natural remanent magnetization (NRM) measurements, that are the magnetization intensity and direction before any treatments, exhibited noticeable variations between the different rock types. The highest and lowest NRM intensity values were recorded for the rhyolitic crystal tuffs (averaging 11.81 A/m) and the spherulitic rhyolites (averaging 0.27 A/m) respectively. Within this range, minor variation in the recorded low NRM intensity values were observed between the alkaline rhyolite dykes (averaging 0.73 A/m) and the mylonitic volcanoclastic rocks (averaging 0.68 A/m), while the peralkaline granites gave higher values which averaging 6.88 A/m. On the other hand, the majority of the measured samples within a single site exhibited minor variations in the NRM directions, while the between site directions for each of the different rock types were considerably scattered (α95 range between 26.8˚ and 64.3˚), with shallow to moderate, mostly negative inclinations.
5.2.3. Demagnetization
The stability of NRM was tested for both A.F. and thermal demagnetizations by subjecting two groups of carefully selected representative pilot samples to a full-range of treatment using the two methods. A.F. demagnetization was first applied in increment steps of 2.5 mT up to 30 mT, then in increment of 10 mT up to the maximum field (100 mT). Thermal demagnetization, on the other hand, was applied in increment steps of 50˚C up to 500˚C, followed by increment steps of 20˚C up to 680˚C (the maximum unblocking temperature of the magnetic carrier, hematite). Physic-chemical mineralogical changes were monitored through measurement of the low-field magnetic susceptibility after each thermal demagnetization step >300˚C. Demagnetization data of the pilot samples were then plotted on stereographic projections, or
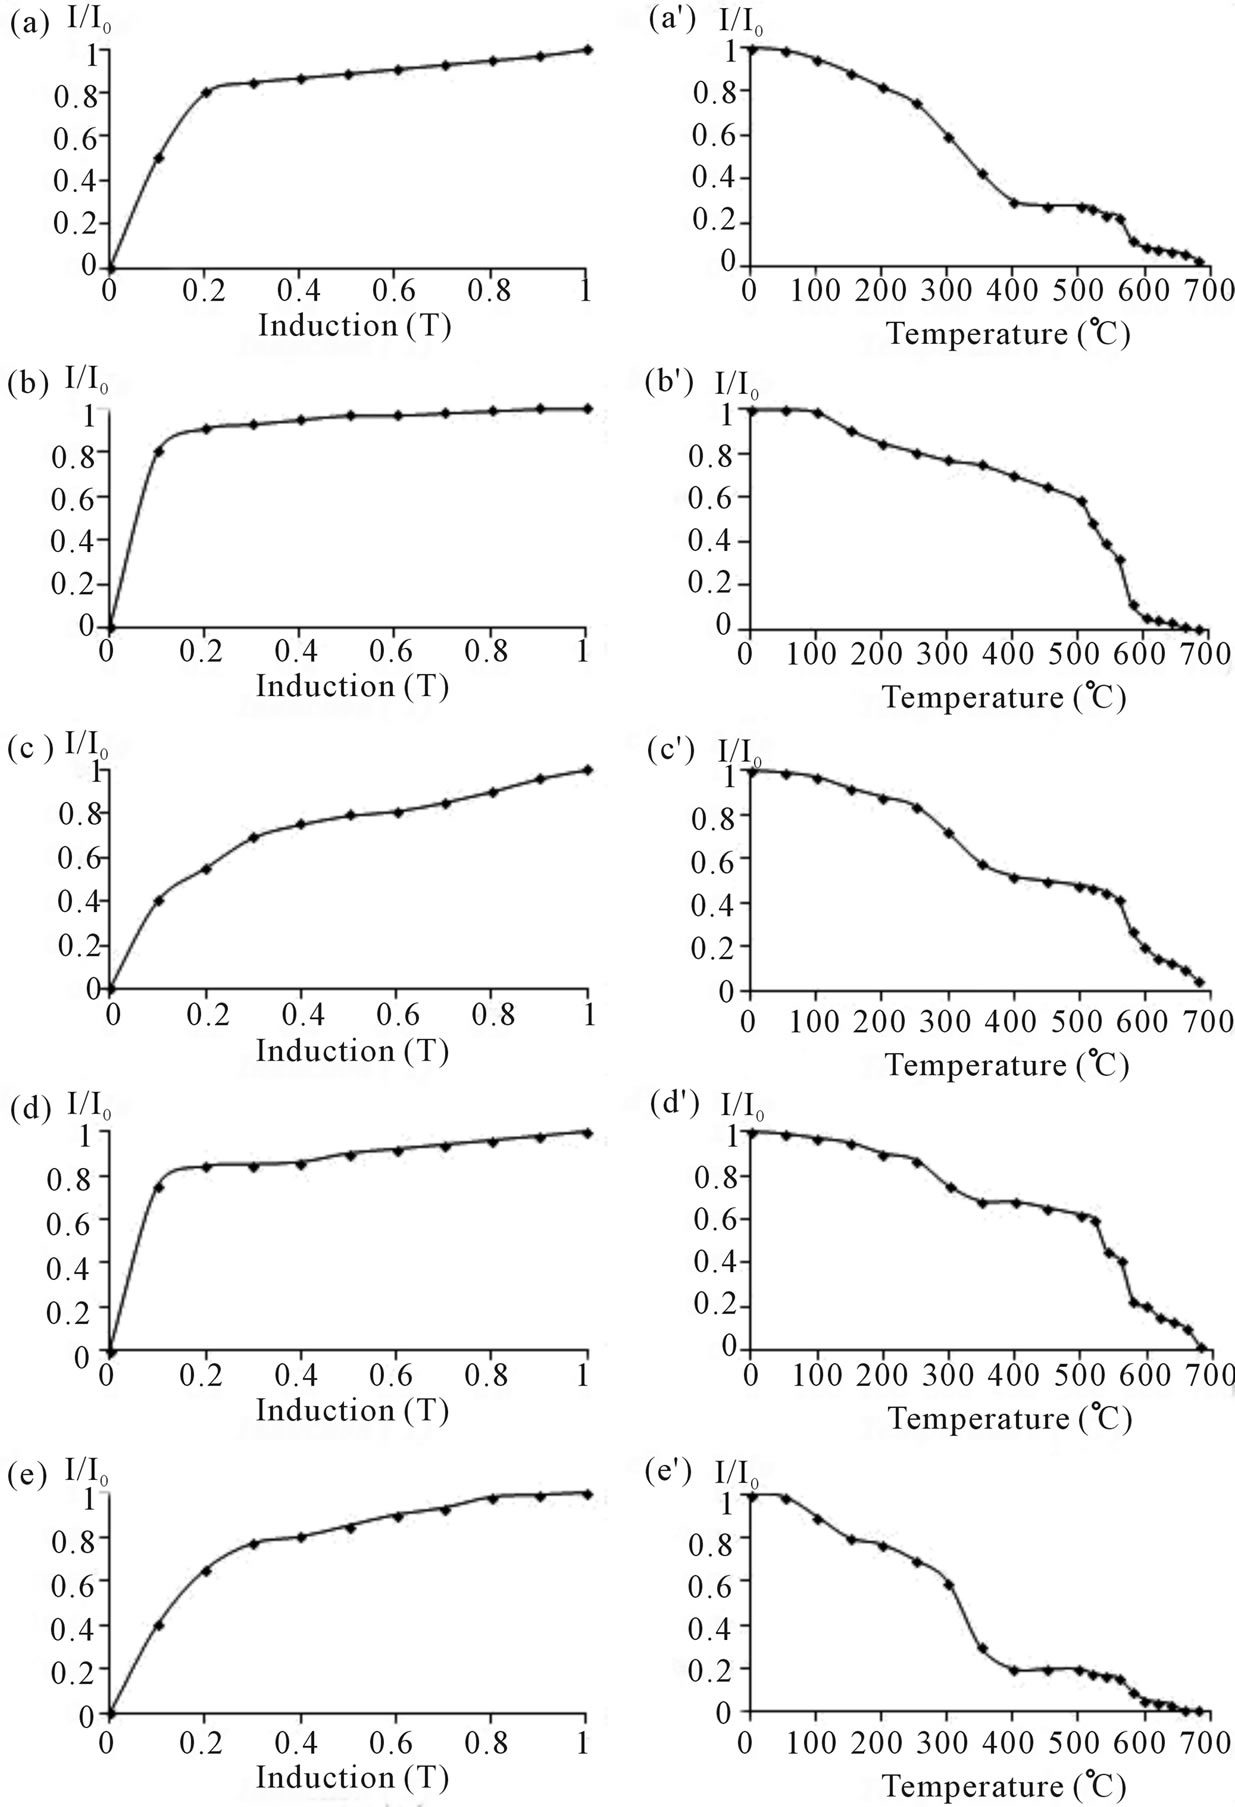
Figure 11. Isothermal remanent magnetization (IRM) acquisition behavior and subsequent thermal demagnetization of IRM for representative samples from south Nusab El Balgum mass complex, south western Desert, Egypt. (a) Rhyolitic crystal tuffs, (b) Spherulitic rhyolites, (c) Alkaline rhyolite dykes, (d) Peralkaline granites and (e) Mylonitic volcanoclastic rocks.
thogonal demagnetization diagrams [25], and normalized intensity decay curves to allow detailed analysis.
Except for the spherulitic rhyolites, the majority of pilot samples did not show any significant response to A.F. demagnetization method. The spherulitic rhyolites samples gave rather similar results for the two demagnetization methods, but with much better defined linear component during thermal treatment. Thermal treatment, on the other hand, was very effective in isolating well-defined stable magnetic components, which reach the origin of the orthogonal plots, from all the pilot samples representing the different rock types (see typical examples in Figure 13).
Most of the pilot samples from the rhyolitic crystal tuffs showed a similar behavior during thermal treatment represented by a little increase in the intensity of magnetization and removal of unstable soft component below 250˚C. The intensity then rapidly decreased and lost about 75% of its original value at ~400˚C, yielding an intermediate magnetization direction between 250˚C and 400˚C. With increasing temperature, the intensity gradually decreased and the direction headed toward the plot origin yielding a well-defined high temperature component between 500˚C and 660˚C (Figure 13(a)).
Pilot samples from the spherulitic rhyolite showed simple behavior which started with isolation of the soft magnetization below 300˚C before the emergence of the stable single component that headed toward the origin of
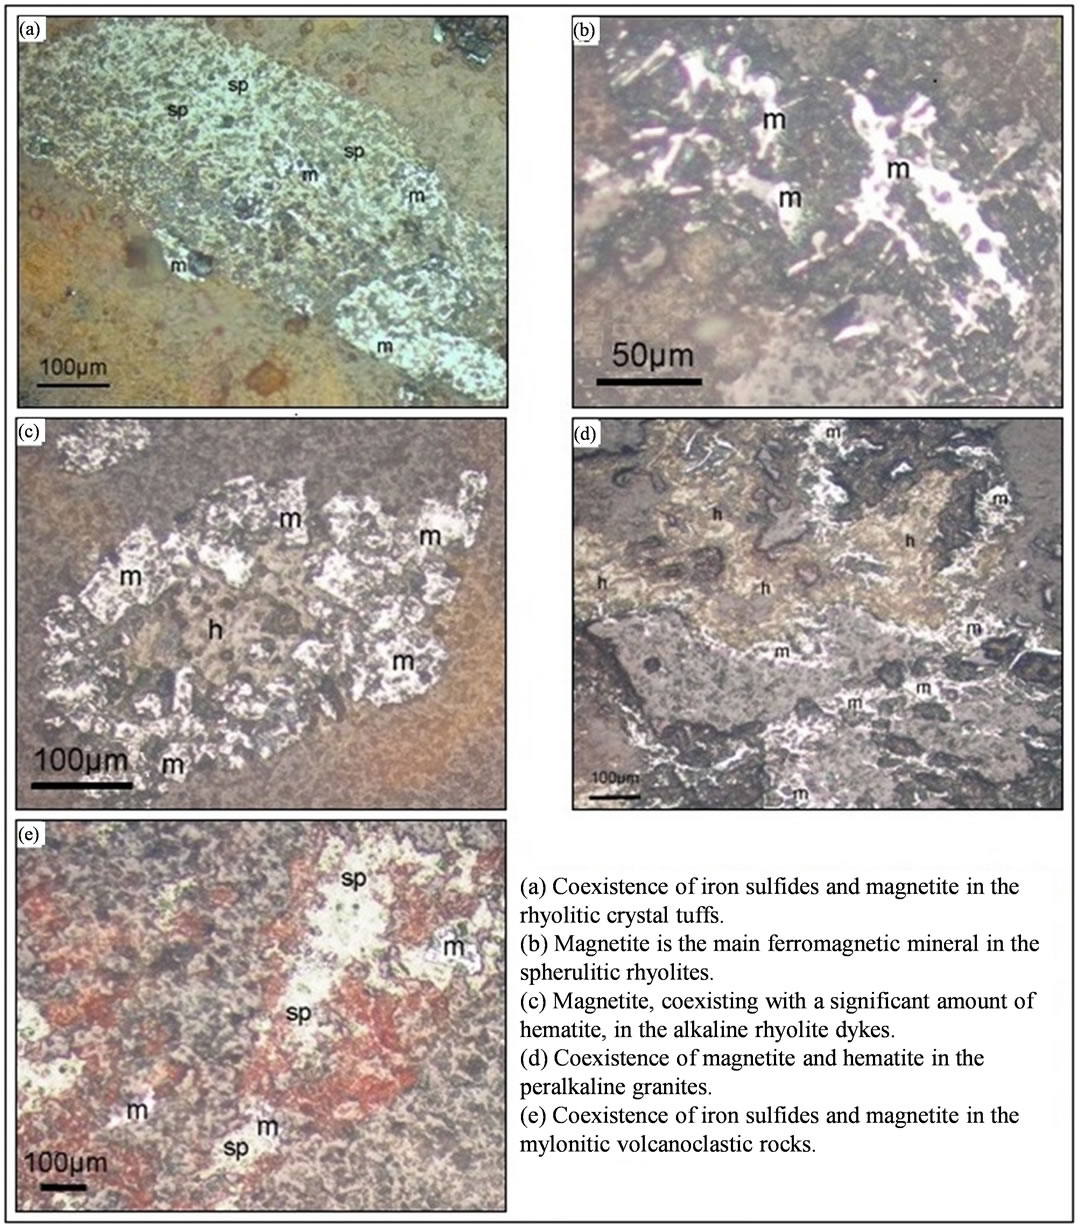
Figure 12. Microphotographs showing the main ferromagnetic minerals of representative samples from south Nusab El Balgum mass complex, south western Desert, Egypt.
orthogonal plot until 580˚C, when magnetization direction become erratic. Also, the intensity of magnetization gradually decreased until 580˚C, when was completely destroyed (Figure 13(b)).
Regarding the alkaline rhyolite dykes, the representative pilot sample initially showed a very little increase in the intensity of magnetization, then, started to gradually decrease up to a temperature of 680˚C. The unstable soft magnetic component was unblocked below 300˚C, where a well-defined linear trend could be obtained during the entire demagnetization course (Figure 13(c)).
The peralkaline granites pilot samples all behaved similarly (example in Figure 13(d)). The intensity of magnetization progressively decreased up to 680˚C. The directions of remanence, on the other hand, revealed unstable soft component below 250˚C, intermediate component from 250˚C to ~520˚C and high temperature component between 520˚C and 660˚C, that headed toward the origin of the orthogonal plot.
Finally, the mylonitic volcanoclastics pilot sample displayed an initial drop of the intensity to about 85% of the initial value at temperatures of 400˚C, with removal of unstable soft component at 250˚C. The sample, then, began to gradually loose the remaining magnetization until about 600˚C, displaying a linear magnetization component that headed toward the origin of the orthogonal plot (Figure 13(e)).
As the A.F. treatment was largely ineffective, and in light of the visual analyses of the thermal demagnetization data of the pilot samples, it was decided that the bulk demagnetization of the remaining samples should be treated thermally. The optimum sequential demagnetiza
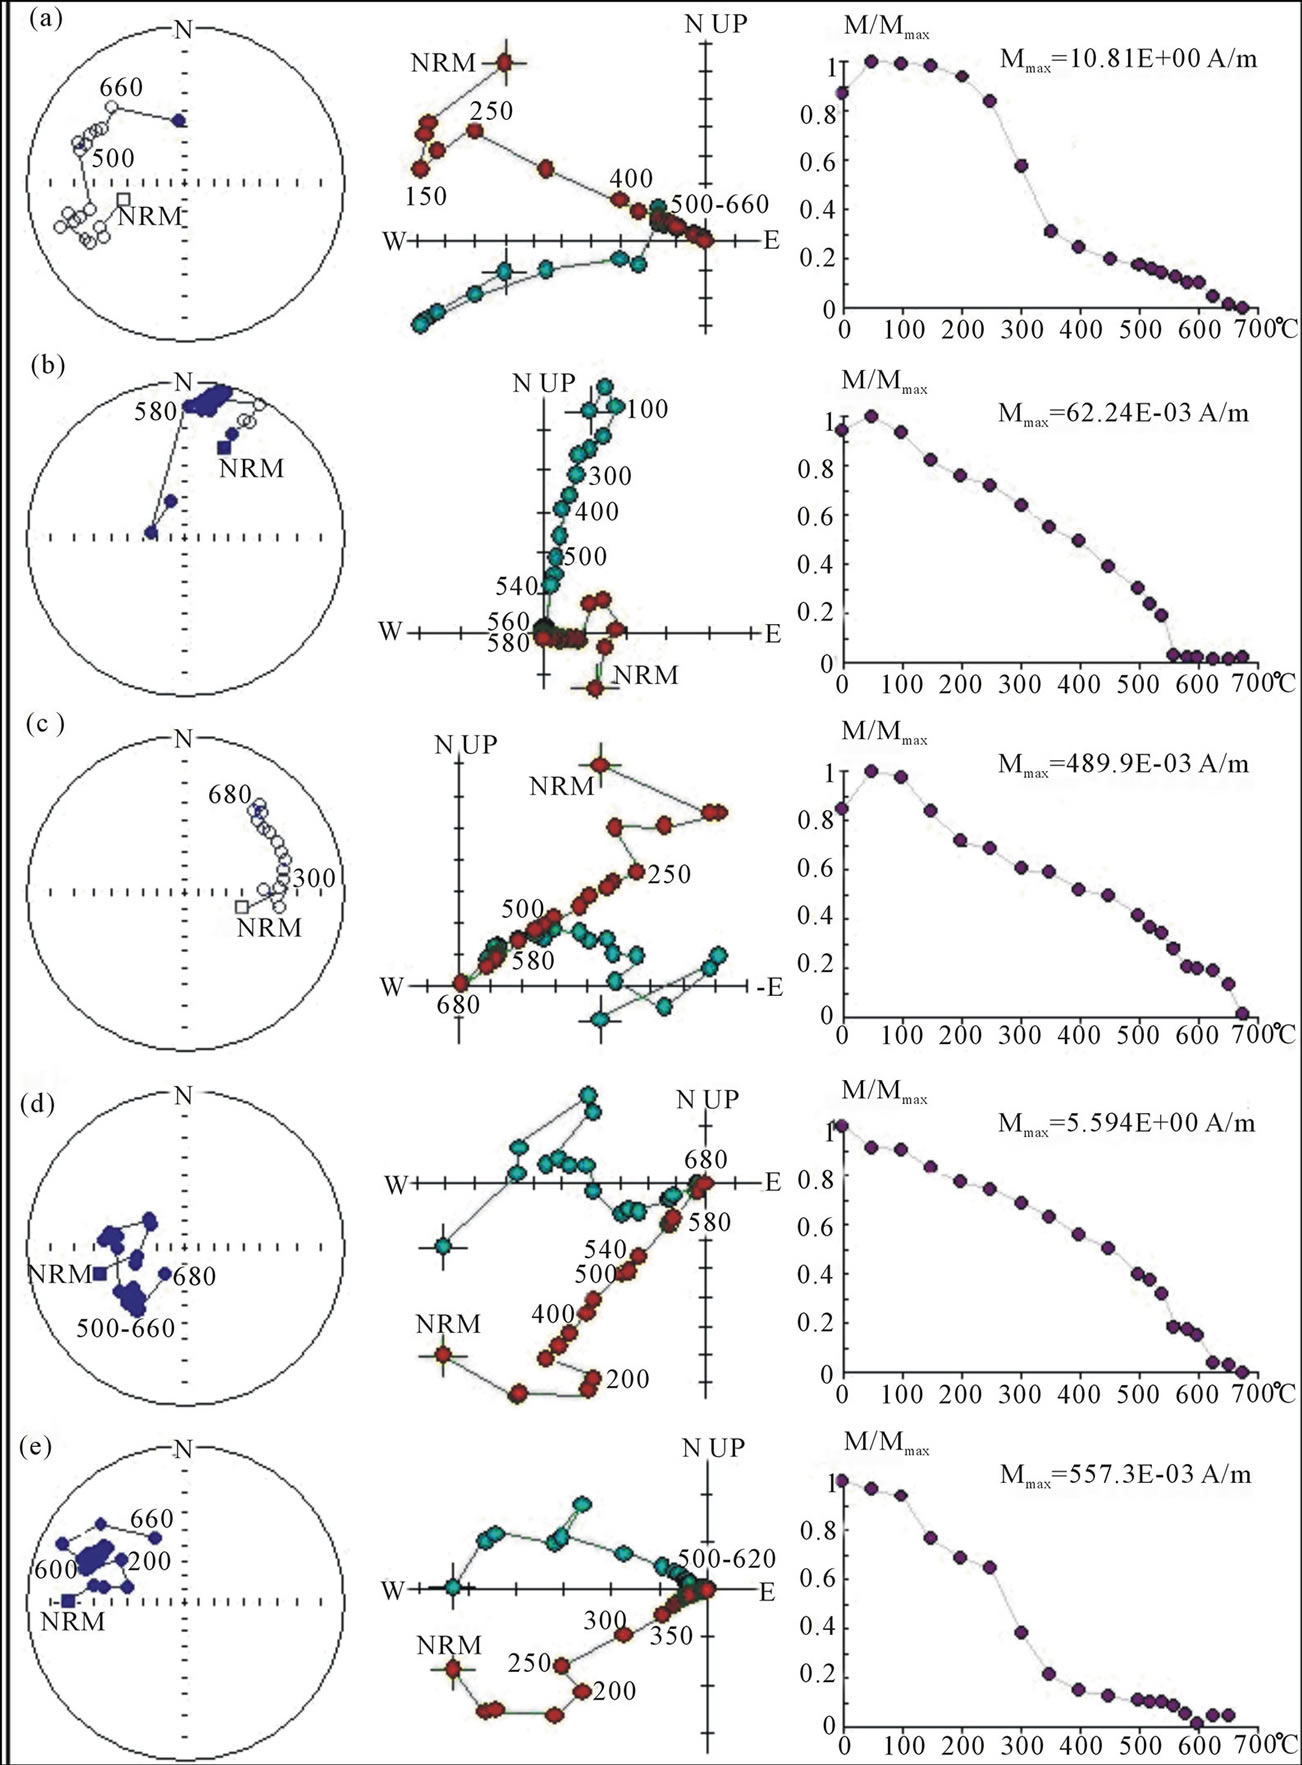
Figure 13. Progressive thermal demagnetization diagrams (equal-area stereographic projections, orthogonal projections and normalized intensity decay curves) for pilot samples representing different rock types of south Nusab El Balgum mass complex, south Western Desert, Egypt, (a) Rhyolitic crystal tuffs, (b) Spherulitic rhyolites, (c) Alkaline rhyolite dykes, (d) Peralkaline granites and (e) Mylonitic volcanoclastic rocks.
tion steps, that define the best linear components of magnetization, were determined and applied on the remaining samples in each site. Statistically, the characteristic remanent magnetization (ChRM) directions, defined by 4 or more collinear points on the vector diagrams, were calculated using methods of the principal component analysis [26] and corrected for the presentday declination. The best estimated site-mean direction of the obtained ChRM was calculated using [27] statistics, then, the corresponding Virtual Geomagnetic Pole (VGP) position was computed for each site. It is worth noting that samples from some sites yielded secondary magnetic components with lower unblocking temperature than the ChRM, nearly between 250˚C and 450˚C. These components, although consistent within the site, were inconsistent between sites and will not be considered further.
To guarantee the quality of the paleomagnetic results and to reliably record the VGPs of the studied rock types, a number of reliability criteria were applied that have caused the exclusion of some datasets from further analysis. Some of these criteria were:
1) Application of carful thermal treatment in the demagnetization processes. Demagnetization resulting in chaotic behavior or reaching no stable endpoint direction were excluded from further analysis.
2) Exclusion of the magnetic components recording ages uncertainties.
3) Datasets that do not reach the minimum number of samples to allow reliable calculation of the site-mean ChRM and VGP [28] were not taken into account. The number of sites used is not less than five per pole and the confidence limit (A95) for calculating the mean pole direction is not less than 15.0˚.
After applying the above mentioned reliability criteria, the remaining paleomagnetic results of the ChRM for the different rock types in this study were listed in Tables 2 and 3. Besides, the calculated site-meam ChRM directions were plotted on an equal-area projection (Figure 14), and the corresponding VGP positions were illustrated through a Lambert equal-area projection (Figure 15).
5.3. Interpretation and Conclusion
5.3.1. Age of the Paleomagnetic Poles
Remanent magnetization from the present Nusab El Balgum mass complex is reasonably well-defined. Within the different rock types of the complex, thermal demagnetization enabled the isolation of five stable well-
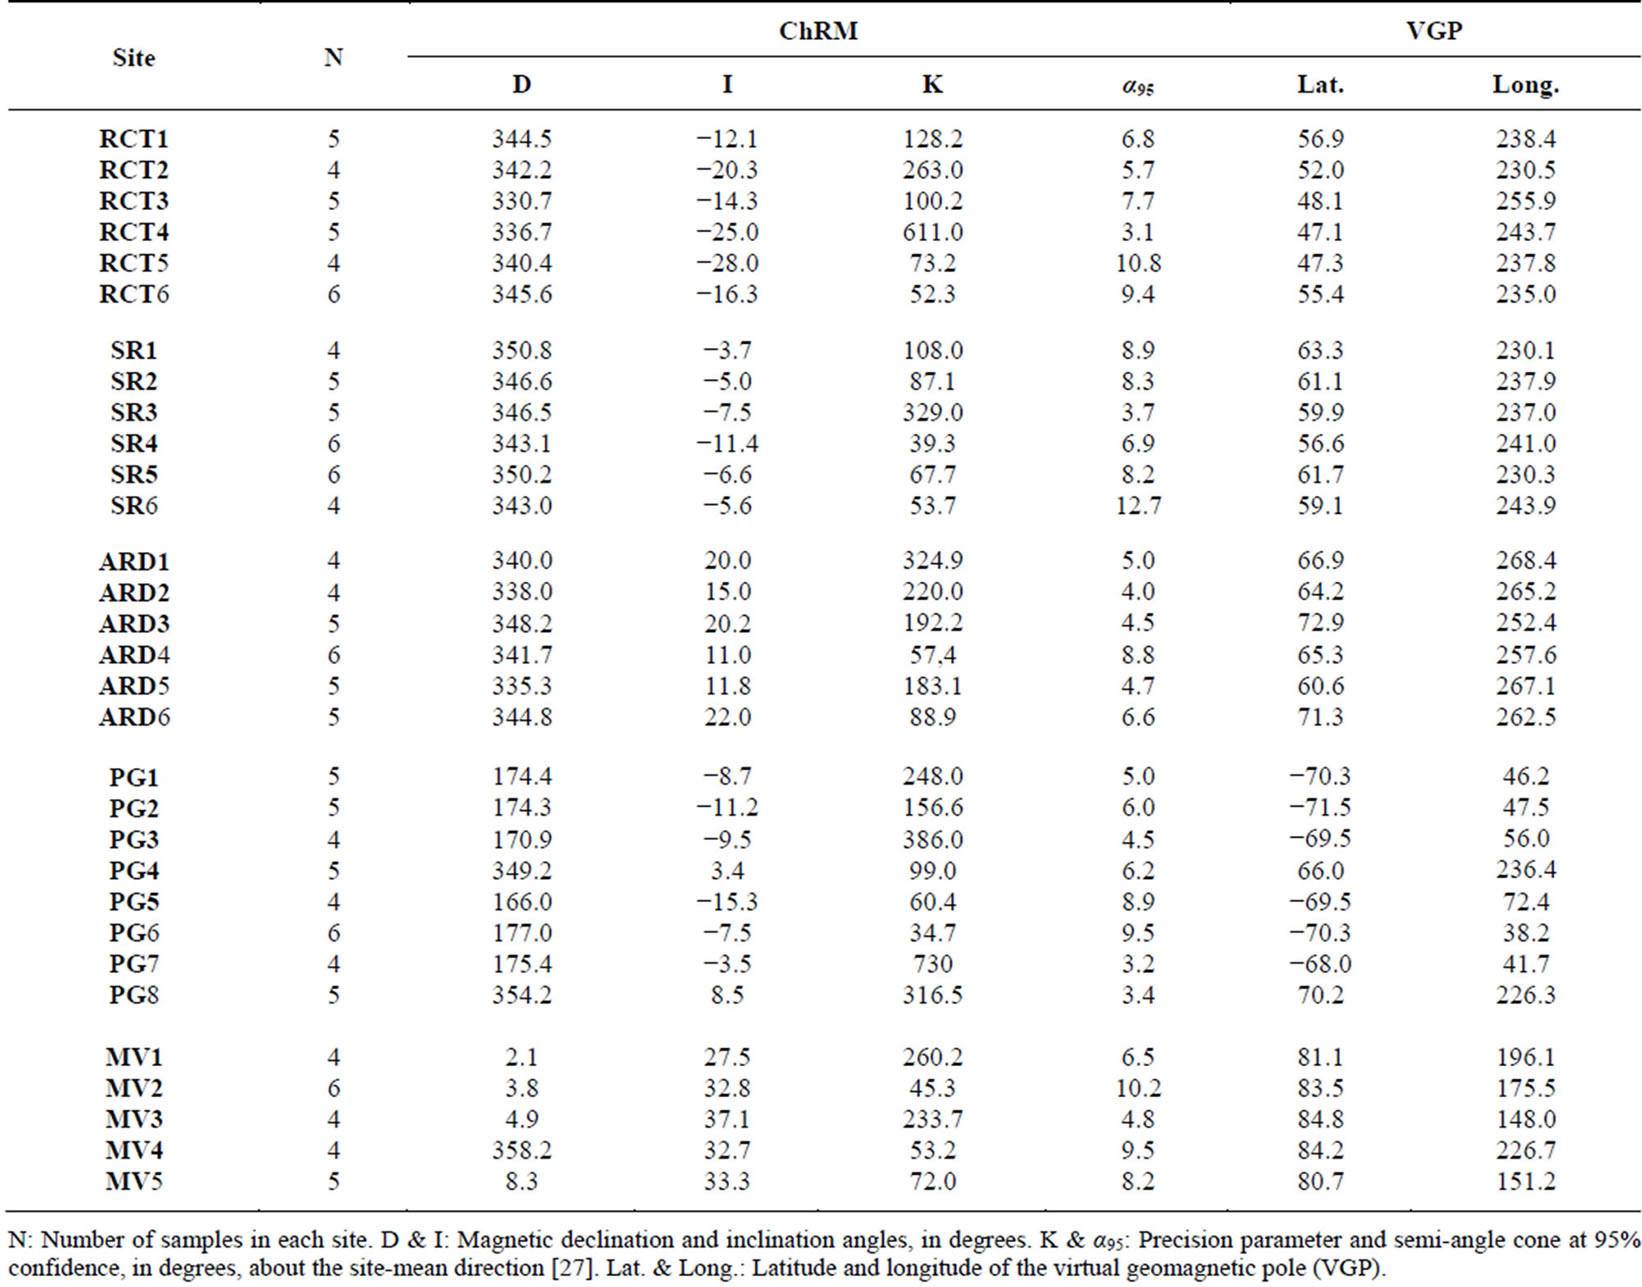
Table 2. ChRM data and Virtual Geomagnetic Poles (VGPs) for sites representing the different rock types of south Nusab El Balgum mass complex, south Western Desert, Egypt. (RCT: rhyolitic crystal tuffs, SR: spherulitic rhyolites, ARD: alkaline rhyolite dykes, PG: peralkaline granites, MV: mylonitic volcanoclastics).
N: Number of samples in each site. D & I: Magnetic declination and inclination angles, in degrees. K & α95: Precision parameter and semi-angle cone at 95% confidence, in degrees, about the site-mean direction [27]. Lat. & Long.: Latitude and longitude of the virtual geomagnetic pole (VGP).
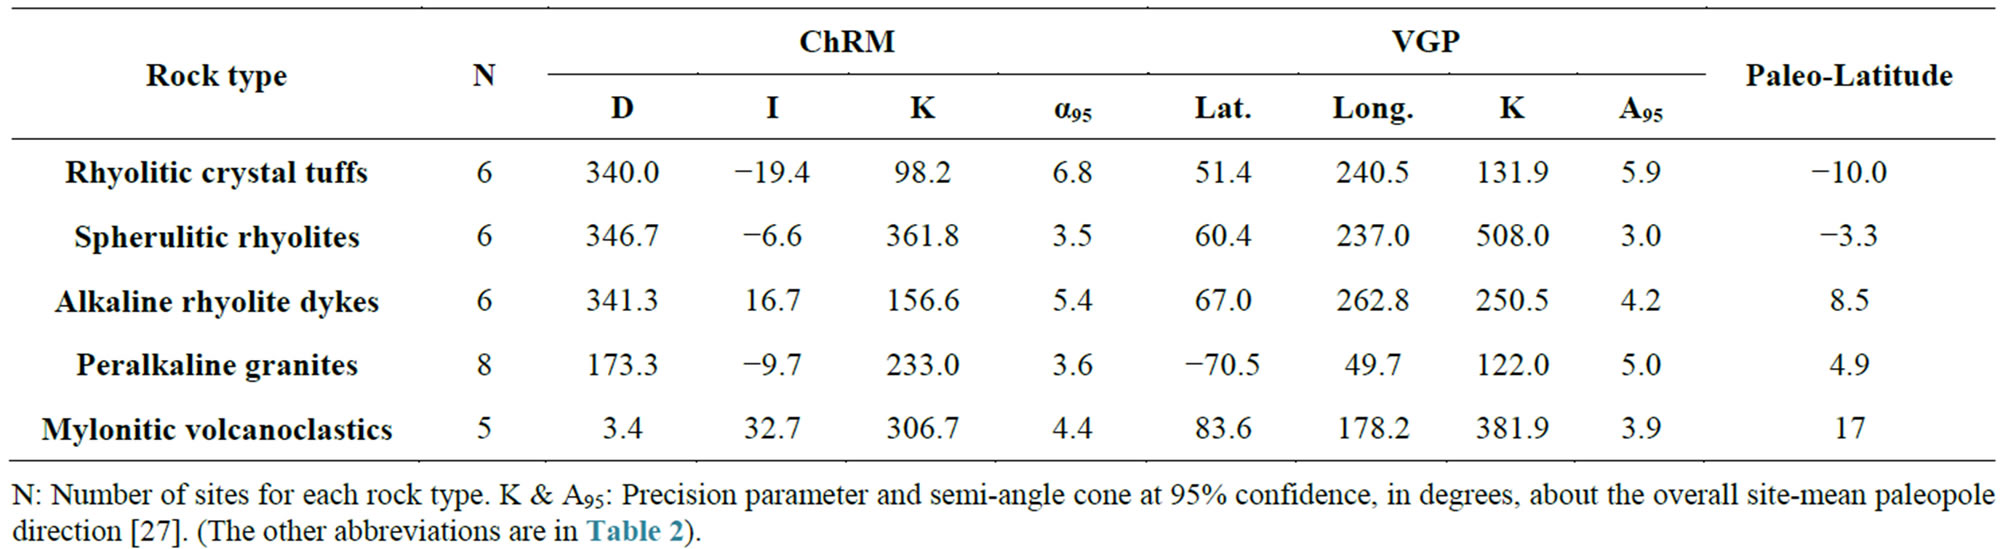
Table 3. Overall site-mean ChRM directions with the corresponding VGPs and paleolatitudes for the different rock types, south Nusab El Balgum mass complex, south Western Desert, Egypt.
N: Number of sites for each rock type. K & A95: Precision parameter and semi-angle cone at 95% confidence, in degrees, about the overall site-mean paleopole direction [27]. (The other abbreviations are in Table 2).
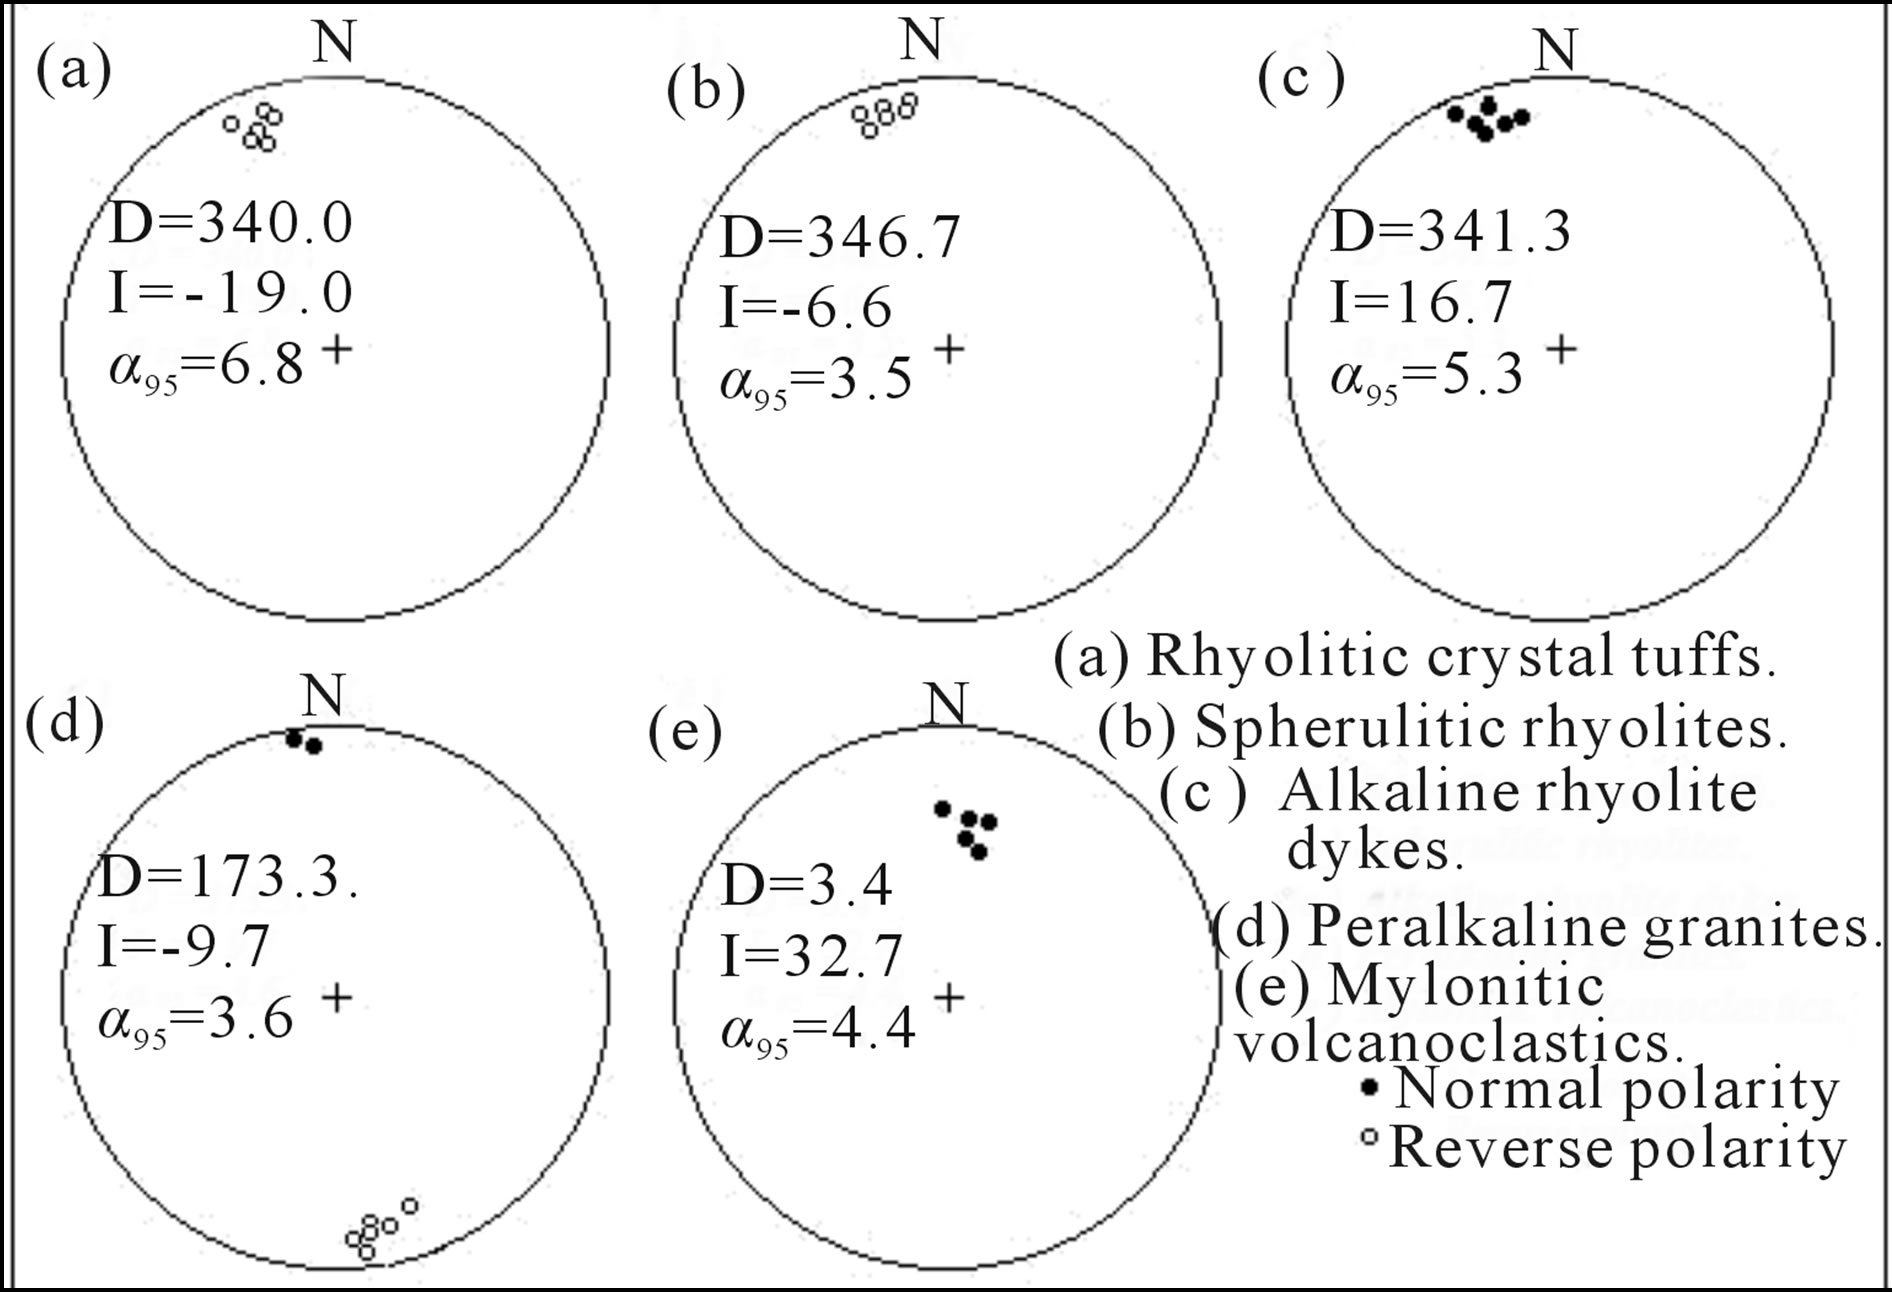
Figure 14. Equal-area stereographic projections of the characteristic remanent magnetization (ChRM) directions for sites from different rock types, south Nusab El Balgum mass complex, south Western Desert, Egypt.
defined ChRM components of clearly different directions.
The first and second ChRM directions were encountered in the rhyolitic crystal tuffs and the spherulitic rhyolites respectively. The two ChRMs showed similar well-defined NNE directed reversed polarities, with a relatively shallow inclination for the rhyolitic crystal tuffs and very shallow inclination for the spherulitic rhyolites (Tables 2 & 3 and Figures 14((a) & (b)). As indicated from the IRM acquisition results (Figures 11((a) & (b)) and the unblocking temperature spectra (Figures 13((a) & (b)), magnetite and hematite were regarded as the principal carriers for the first ChRM (in the rhyolitic crystal tuffs), while magnetite was the dominant carrier for the second ChRM (in the spherulitic rhyolites). Generally, both of the two ChRMs showed a high stability during the demagnetization processes, high unblocking temperatures and consistent directions, within and between sites. Based on these observations, the two ChRMs seem to be of primary origin and could be interpreted as primary thermal remanent magnetizations (TRM), reflecting the palaomagnetic field at the time of extrusion of these rhyolitic rocks. The direction of the first ChRM (D/I = 340.0˚/−19.4˚, with α95 = 6.8˚ and K = 98.2) corresponds to a VGP of Lat./Long. = 51.4˚N/240.5˚E, with A95 = 5.9˚ and K = 131.9. On the other hand, the direction of the second ChRM (D/I = 346.7˚/−6.6˚, with α95 = 3.5˚ and K = 361.8.) corresponds to a VGP of Lat./Long. = 60.4˚N/237.0˚E, with A95 = 3.0˚ and K = 508.0. Comparison of the resultant VGPs of the two ChRM directions with the Phanerozoic global Apparent Polar Wander Path (APWP) in South African co-ordinates [29] suggests magnetization acquisition ages of Late Triassic (~225 Ma) and Late Triassic/Early Jurassic (~215 Ma) for the rhyolitic crystal tuffs and the spherulitic rhyolites respectively.
The third ChRM direction was encountered in the alkaline rhyolite dykes as a NNE directed normal polarity magnetization, with shallow inclination (Tables 2 & 3 and Figure 14(c)). This well-defined magnetization characterized by high stability during demagnetization and very high internal consistency in its respective sites. Magnetite and hematite were regarded as the principal carrier for this magnetization, as indicated from the IRM examination (Figure 11(c)), and unblocking temperature spectra (Figure 13(c)). The calculated direction of this magnetization is D/I = 341.3˚/16.7˚, with α95 = 5.4˚ and K = 156.6, which corresponds to a VGP lying at Lat. 67.0˚N and Long. 262.8˚E, with A95 = 4.2˚ and K = 250.5. By comparison, this pole is consistent with the part of the African APWP [29] for the time period ~195 Ma (Early Jurassic). This age, most likely, corresponds to extrusion of the dykes and the magnetization could also be interpreted as a primary thermal remanent magnetization (TRM) that was acquired during the initial cooling.
The fourth ChRM component was encountered in 8 sites within the peralkaline granites and characterized by very shallow site-mean inclinations with both normal and reverse polarities that were directed to the NNW or SSE (Tables 2 & 3 and Figure 14(d)). Judging from the IRM examination (Figure 11(d)) and unblocking temperature spectra (Figure 13(d)), it seems that magnetite and hematite are the magnetic carriers for this magnetization.
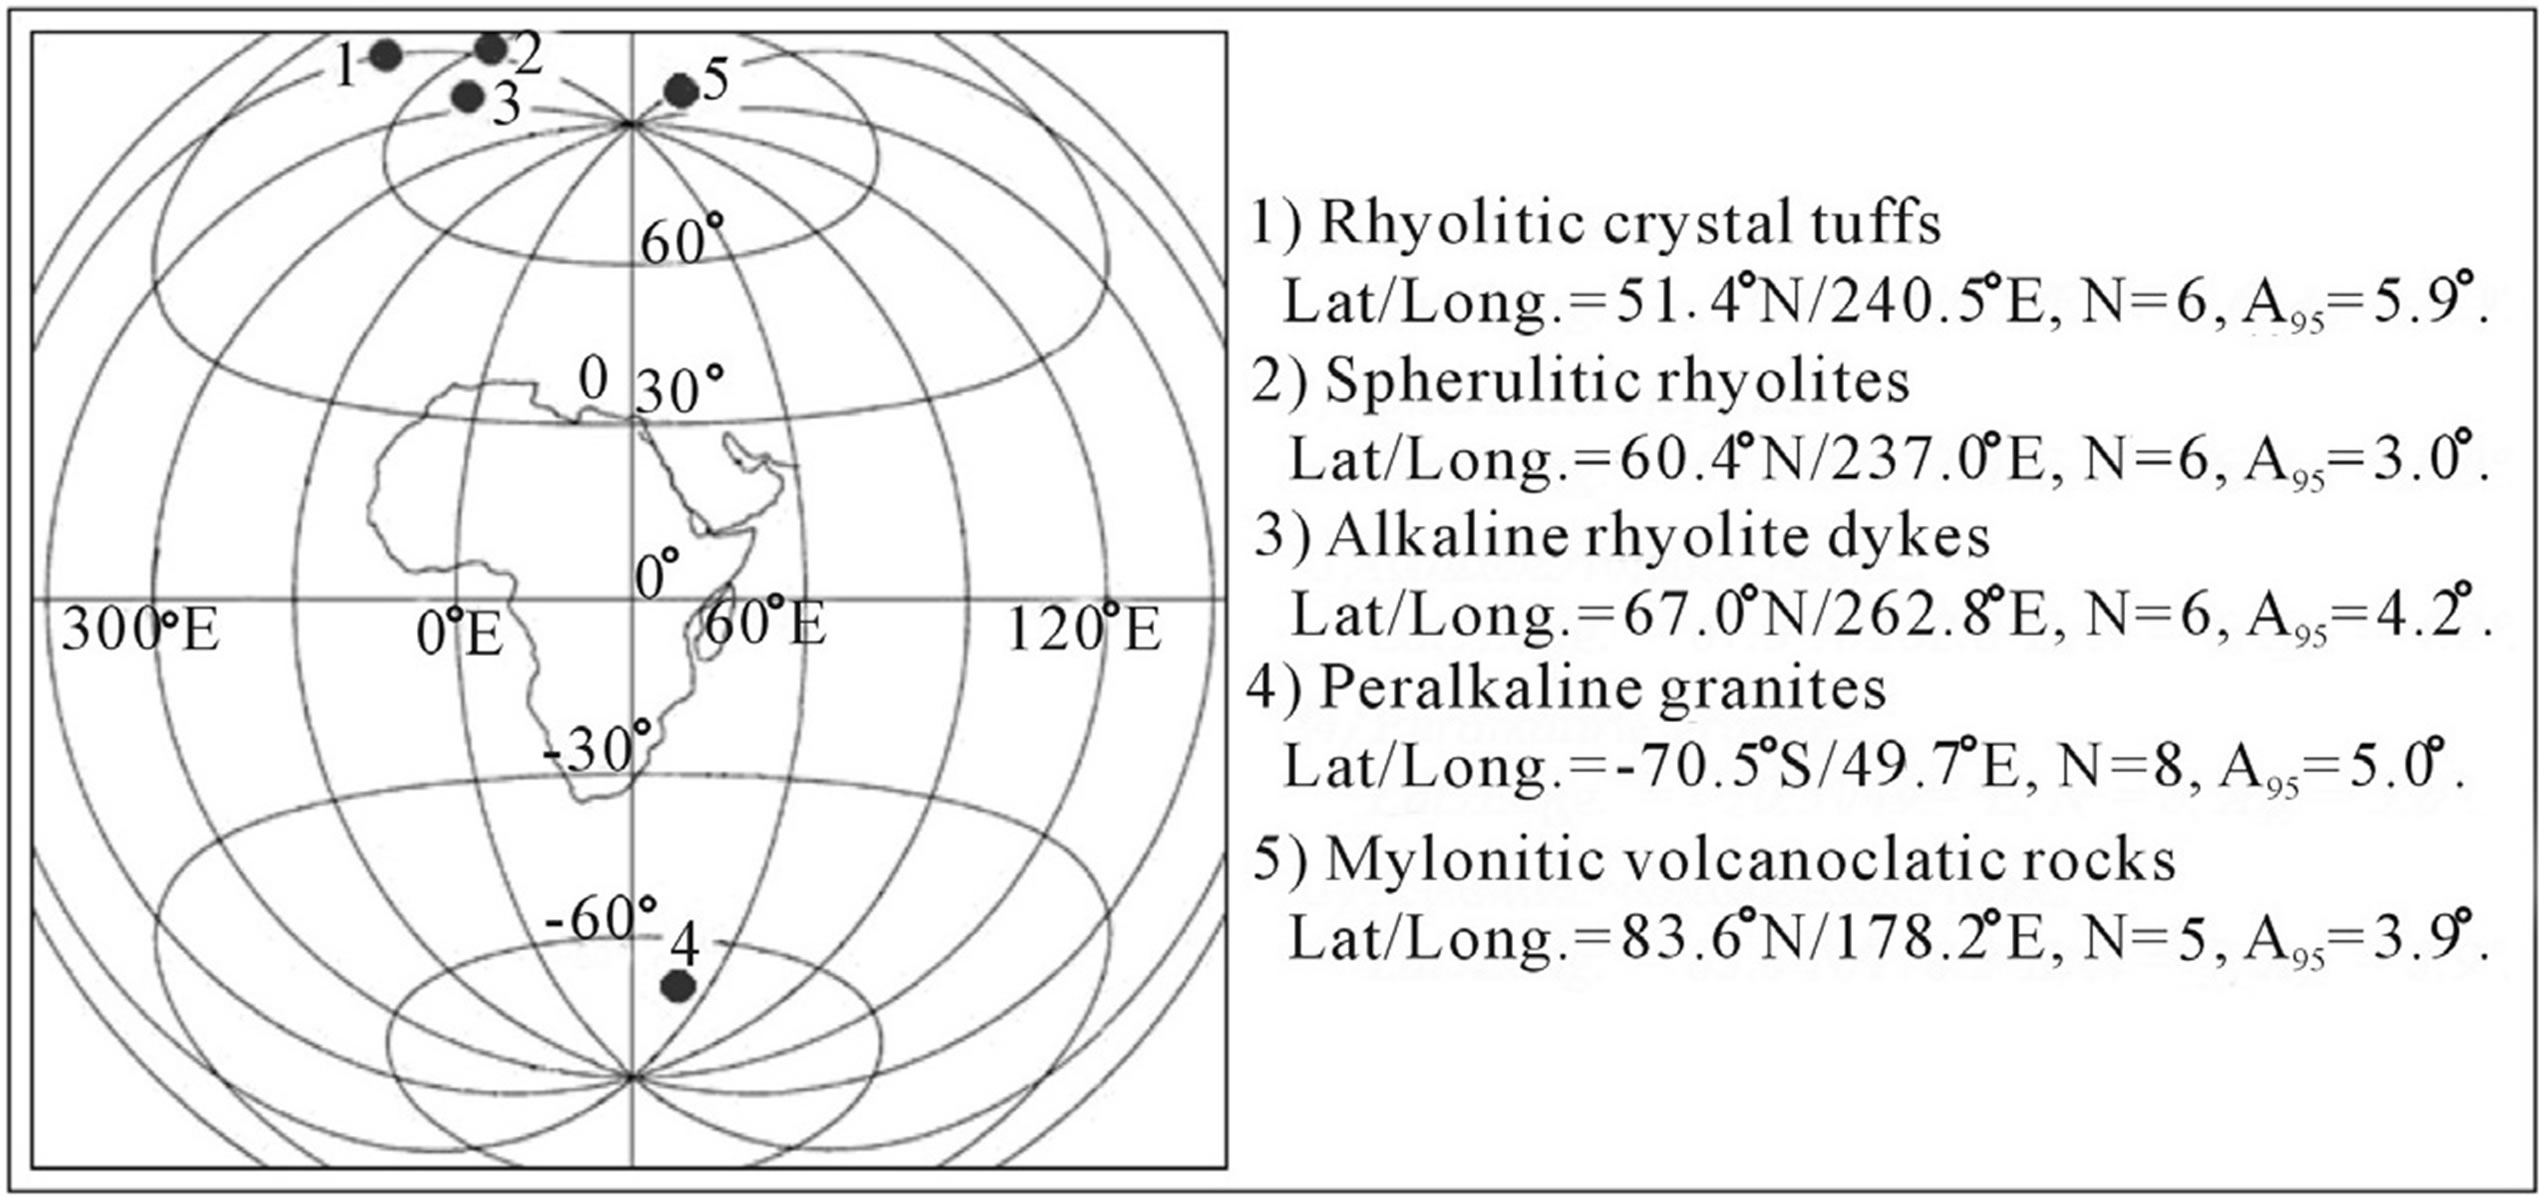
Figure 15. Lambert equal-area projection of Virtual Geomagnetic Pole positions for different rock types, south Nusab El Balgum mass complex, south Western Desert, Egypt.
Application of the reversal test [30] confirmed that the normal and reversed polarities of this magnetization are antiparallel and drawn from the same population. Accordingly, the normal polarities were flipped to reverse polarities, resulting in a mean ChRM direction of D/I = 173.3˚/−9.7˚, with α95= 3.6˚ and K = 233.0. This direction corresponds to a VGP lying at Lat. −70.5˚S and Long. 49.7˚E, with A95 = 5.0˚ and K = 122.0. According to the before mentioned petrographic investigations, different degrees of alterations were identified within the present peralkaline granites. The probability that the magnetization of these granites may have acquired as a result of these alterations or related to overprint due any geological event is unlikely. This is simply because the high stability during the thermal treatment, the high unblocking temperatures, the consistent directions within and between sites and finally the presence of antipodal magnetization directions, which signify its primary origin. Accordingly, the magnetization of the peralkaline granites could be interpreted as a primary thermal remanent magnetization (TRM) that was acquired during initial cooling of the rocks. By comparison of the corresponding paleomagnetic pole with the African Phanerozoic APWP [29], the age of this magnetization, which limits the age of the granite intrusion, is found to be of Late Cretaceous (~80 Ma).
Finally, the fifth ChRM direction was encountered in the mylonitic volcanoclastic rocks as a north directed normal polarity magnetization, with intermediate inclination (Tables 2 & 3 and Figure 14(e)). This well-defined magnetization characterized by high stability during demagnetization and high internal consistency in its respective sites. Magnetite was regarded as the principal carrier for this magnetization, as indicated from the IRM examination (Figure 11(d)), and unblocking temperature spectra (Figure 13(d)). The calculated direction of this magnetization is D/I = 3.4˚/32.7˚, with α95= 4.4˚ and K = 306.7, which corresponds to VGP lies at Lat. 83.6˚N and Long. 178.2˚E, with A95 = 3.9˚. By comparison, this pole is consistent with the part of the African APWP [29] for the time period ~25 Ma (Oligo-miocene).
5.3.2. Tectonic Implications and Paleolatitudes
From the available geological and radiometric age data, the northern part of the African plate was uplifted over a large area as a result of its collision with the northern continents during Carboniferous. The collision initiated the east-north-east trending structures by re-opening of pre-existing zones of structural weakness which had been more or less inactive since Precambrian time. In the south Western Desert of Egypt, the area between Gabal Uweinat and Bir Safsaf, was uplifted along zones of pre-existing structural weakness and ultimately gave rise to the east-west structure of Gabal Uweinat-Bir SafsafAswan uplift during the Late Permian/Early Triassic time [31]. This uplift was accompanied by extensive reactivated faults, striking more or less east-west, which gave ways to different igneous activities such as extrusion of alkaline volcanics of 235 ± 5 Ma at Gabal Uweinat [32], trachytic-phonolithic rocks of 233 ± 9 Ma and 240 ± 7 Ma respectively at Gabal Kamel [33] and alkali-rhyolitic volcanics of ~216 ± 5 Ma at the present Nusab El Balgum mass complex, north of Bir Safsaf [34].
Guriaud et al. [35] reported that the opening of the Central Atlantic Ocean led to reactivation of many fracture in North Africa from Late Triassic time. In the present study, the different volcanic rocks and the peralkaline granites of Nusab El Balgum mass complex define four different reliable paleomagnetic ages which fit closely to the African APWP [29] ages of Late Triassic (~225 Ma), Late Triassic/Early Jurassic (~215 Ma), Early Jurassic (~195 Ma) and Late Cretaceous (~80 Ma). These paleomagnetic ages are interpreted as the times of characteristic remanent magnetization acquisition during extrusion and initial cooling of these rocks. This range of time could be represents pervasive event or events predate any tectonic activity connected with rifting of the Red Sea. The formation event or events of the studied volcanic rocks (rhyolitic crystal tuffs, spherulitic rhyolites and alkaline rhyolite dykes) are constrained between ~225 Ma and ~195 Ma. This rang of time is coincident with the most dynamic phases of Pangaea break-up (manifested as the separation of Laurasia and Gondwana) which occurred during (and shortly after) the emplacement of the Central Atlantic Magmatic Province (200 Ma, e.g. [36]) and the subsequent opening of the Central Atlantic Ocean at ~195 Ma [37]. On the other hand, the peralkaline granite of Late Cretaceous age (~80 Ma) seems to be coeval with anorogenic alkaline rocks in the south Eastern Desert [38] and south Western Desert [39] of Egypt. Correlative magmatic rocks have also been found elsewhere in Africa (e.g. [40,41]). El Gaby et al. [42] concluded that, from the end of the Pan-African orogeny until the Tertiary, the basement was intermittently intruded by a number of subalkaline to peralkaline granite bodies. The peralkaline granites occurred mostly as shallow Caldron complexes or as small discordant intrusions having almost circular outlines. Although the timings of the Cretaceous magmatic cycles are well constrained, the geodynamic processes are less well-known. According to [4], all the Egyptian alkaline complexes had a similar origin but not directly related to rifting and/ or doming. They proposed that these complexes formed due to alkaline melts formed in the asthenosphere by shear heating due to acceleration in plate motion. These melts were emplaced along reactivated Pan-African fractures or preexisting weakness zones.
Returning to the mylonitic volcanoclastic rocks, the computed paleomagnetic pole suggests a Tertiary (OligoMiocen) age for the magnetization acquisition. This magnetization seems to correspond to local tectonic event, including alteration, where the rocks are genetically related to the fault system in the area. Accordingly, this magnetization could be interpreted as secondary chemical or thermochemical remanent which may have completely obliterated the primary magnetization of the rocks.
Finally, the calculated paleolatitudes for the different rock types at the sampling sites in the study Nusab El Balgum complex provide a quantified estimate for the latitudinal change of south Egypt, as a part of the African plate. As illustrated in Table 3, palaeolatitudes of the different rock types, arranged in a chronological sequence from the oldest, were found to be at −10.0˚, −3.3˚, 8.5˚, 4.9˚ and 17˚ Lat. Generally, these paleolatitudes identified northward movement, which coincides with the known northward drift of the African plate, where the latitudinal continental mean mass-center was located in tropical latitudes throughout the Mesozoic [29]. On the other hand, a close look of the calculated paleolatitudes shows that the period from Late Triassic to Early Jurassic is subject to northward movement, which followed by a southward movement in the Late Cretaceous. These results coincide with the paleomagnetic results from the African and Eurasian plates in the eastern Mediterranean realm, which suggest a rapid motion to southerly latitudes from the Late Jurassic to Earliest Cretaceous, followed by a northward movement [43,44]. Meijers et al. [44] concluded that True Polar Wander (movement of the entire crust and mantle with respect to the Earth’s core) rather than plate tectonics is the cause of low Late Jurassic to Early Cretaceous African and Eurasian paleolatitudes in the eastern Mediterranean area.
6. Conclusions
The following conclusions can be drawn from the present study:
1) Nusab El Balgum mass complex represents one of the alkaline igneous activities in the south Western Desert of Egypt, which were initiated by reactivation of deep-seated lineaments with the peaks of activities during the Mesozoic.
2) Some rock types in south of the complex were represented by volcanics (pyroclastics [rhyolitic crystal tuffs], spherulitic rhyolites, alkaline rhyolite dykes), subvolcanic peralkaline granites and structurally controlled mylonitic volcanoclastic rocks.
3) Radioactive elements Th and eU displayed considerable concentrations within the studied rock types of the complex. These rocks, as a whole, contain about 5 times more eU than their equivalent normal rocks, with considerable variations of the Th range especially within the peralkaline granites. Th and eU abundances were independent of differentiation processes, but related to favorable combination of structural and pos-magmatic hydrothermal conditions. These features are of considerable significance in view of the exploration and extraction of the radioactive elements in the area.
4) Careful stepwise thermal demagnetization for oriented paleomagnetic samples has made it possible to isolate well-defined stable characteristic remanent magnetization directions for the studied rock types of the complex. Except for the mylonitic volcanoclastic rocks, these magnetizations are of primary origin and reflect the ages of the rocks. Their corresponding VGPs fit closely to the African APWP ages of Late Triassic (~225 Ma), Late Triassic/Early Jurassic (~215 Ma), Early Jurassic (~195 Ma) and Late Cretaceous (~80 Ma).
5) The formation events of the volcanic rocks (rhyolitic crystal tuffs, spherulitic rhyolites and alkaline rhyolite dykes) are constrained between ~225 Ma and ~195 Ma. This range of time is coincident with the most dynamic phases of Pangaea break-up which occurred during (and shortly after) the emplacement of the Central Atlantic Magmatic Province and the subsequent opening of the Central Atlantic Ocean at ~195 Ma. On the other hand, the peralkaline granite of Late Cretaceous (~80 Ma) seems to be coeval with some anorogenic alkaline rocks in the south Eastern Desert and south Western Desert of Egypt. These rocks formed due to alkaline melts formed in the asthenosphere by shear heating due to acceleration in plate motion. These melts were emplaced along reactivated Pan-African fractures or preexisting weakness zones.
6) The calculated VGP for the mylonitic volcanoclastic rocks suggests a Tertiary (Oligo-Miocen) age for secondary magnetization acquisition. This magnetization seems to correspond to local tectonic event, where the rocks are genetically related to the fault system in the area.
7) Paleolatitudes for the different rock types of south Nusab El Balgum mass complex provide a quantified estimate for the latitudinal change of south Egypt, as a part of the African plate.
8) Finally, the paleomagnetic results from this study are considered reliable and represent a good contribution to the Egyptian and African paleomagnetic database and should help in further refining of the Mesozoic APWP of Africa.
Acknowledgement
The authors are deeply grateful to Prof. Dr. Abouelhoda M. Elsirafy, Exploration Division, Nuclear Materials Authority, Egypt, for fruitful comments and critical review of the manuscript.
REFERENCES
- J. T. Nash, “Volcanogenic Uranium Deposits: Geology, Geochemical Processes and Criteria for Resource Assessment,” US Geological Survey, Open-File Report 2010-1001, 2010, 110 p.
- International Atomic Energy Agency (IAEA), “World Distribution of Uranium Deposits (UDEPO) with Uranium Deposit Classification,” Vienna, Austria, International Atomic Energy Agency, IAEA-TECDOC-1629, 2009, 117 p.
- M. Cuney and K. Kyser, “Recent and Not-So-Recent Developments in Uranium Deposits and Implications for Exploration,” Mineralogical Association of Canada, Short Course Series, Vol. 39, 2009, 257 p.
- P. De Gruyter and T. A. Vogel, “A Model for the Origin of the Alkaline Complexes of Egypt,” Nature, Vol. 291, No. 5816, 1981, pp. 571-574. http://dx.doi.org/10.1038/291571a0
- M. Y. Meneisy, “Volcanicity,” In: R. Said, Ed., The Geology of Egypt, A. A. Balkema, Rotterdam, 1990, pp. 157-174.
- R. Black, J. Lameyer and B. Bonin, “The Structural Setting of Alkaline Complexes,” Journal of African Earth Sciences, Vol. 3, No. 1-2, 1985, pp. 5-16.
- P. Bowden, “The Geochemistry and Mineralization of Alkaline Ring Complexes in Africa (a Review),” Journal of African Earth Sciences, Vol. 3, No. 1-2, 1985, pp. 17- 39.
- N. L. El Agami and H. M. Abdalla, “Geochemistry of Garra El Hamra Y, Th, REE-Mineralized Peralkaline Granite-Syenite Complex, Southwestern Desert, Egypt,” A Metallogenetic Constraint Egypt Min, Vol. 15, 2006, pp. 43-77.
- S. A. Abu Elatta, H. M. Assran and A. A. Ahmed, “Preliminary Study on HFSE Mineralization in the Peralkaline Granites of Nusab El Balgum Area, South Western Desert, Egypt,” Geomaterials, 2013, Vol. 3, No. 3, pp. 90-101. http://dx.doi.org/10.4236/gm.2013.33012
- B. Issawi, “The Geology of Kurkur-Dungul Area,” Egyptian Geological Survey, Paper 46, 1969, 102 p.
- H. Schandelmeier, A. Rich and G. Franz, “Outline of the Geology of Magmatic Units Between Gabal Uweinat and Bir Safsaf (SW Egypt/NW Sudan),” Journal of African Earth Sciences, Vol. 1, No. 3-4, 1983, pp. 275-283.
- H. M. Assran, A. A. Hamed, A. A. Arbab, A. A. Ahmed, N. M. Moghazy and S. A. Abu Elatta, “Reconnaissance Radiometric Survey in Bir Safsaf-Nusab El Balgum Area, South Western Desert, Egypt,” Nuclear Materials Authority of Egypt, Internal Report, 2012.
- L. T. D. Conoco-Corporation, “Geological Map of South Western Desert Egypt, Scale 1:500.000. Sheet No. NF 53 NV, Gilf Kabeir Plateau,” Egyptian General Petroleum Corporation, Cairo, 1987.
- D. Marsal, “Statistics for Geoscientists,” University of Stuttgart, Stuttgart, 1987.
- S. R. Taylor, “The Application of Trace Element Data to Problem in Petrology,” Physics and Chemistry of the Earth, Progress Series, Vol. 6, 1965, pp. 133-213. http://dx.doi.org/10.1016/B978-0-08-010426-3.50004-6
- J. J. W. Rogers, M. A. Ghuma, R. M. Nagy, J. K. Greenberg and P. D. Fullagar, “Plutonism in Pan-African Belts and Geologic Evolution of Northeastern Africa,” Earth and Planetary Science Letters, Vol. 39, No. 1, 1978, pp. 109-117.
- H. H. Bostock, “A General Diaper of Batholithic Dimensions at the West Margin of the Churchill Province,” Current Research, Part B, Geological Survey of Canada, Paper 81, 1981, pp. 73-82.
- B. W. Charbonneau, “Radiometric Study of Three Radioactive Granites in the Canada Shield: Elliot Lake, Ontario; Fort Smith; and Fury and Hecla, N.W.T,” In: Y. T. Maurice, Ed., Uranium in Granites, Geological Survey of Canada, 1982, pp. 91-99.
- W. Yanting, F. Mingyue and S. Zhuyong, “Uranium Geochemistry of the Granites in Eastern Guangdon Provence,” International Symposium on the Geology of Granites and Their Metallogenetic Relations, Nanjing University, Nanjing, 1982, pp. 637-649.
- D. T. Tarling, “Palaeomagnetism: Principles and Applications in Geology, Geophysics and Archaeology,” Chapman and Hall, London, New York, 1983, 379 p. http://dx.doi.org/10.1007/978-94-009-5955-2
- D. J. Dunlop, “Magnetic Mineralogy of Heated and Unheated Red Sediments by Coercivity Spectrum Analysis,” Geophysical Journal of the Royal Astronomical Society, Vol. 27, No. 1, 1972, pp. 37-55.
- D. J. Dunlop, “Magnetic Properties of Fine-Particle Heamatite,” Annals of Geophysics, Vol. 27, 1971, pp. 269- 293.
- D. W. Collinson, “Methods in Rock Magnetism and Palaeomagnetism,” Techniques and Instrumentation, Chapman & Hall, London, 1983, 503 p. http://dx.doi.org/10.1007/978-94-015-3979-1
- W. O’Reilly, “Rock and Mineral Magnetism,” Blackie, Chapman & Hall, New York, 1984, 220 p.
- J. D. A. Zijderveld, “A. C. Demagnetization of Rocks: Analysis of Results,” In: D. W. Collinson, K. M. Creer and S. K. Runcorn, Eds., Methods in Palaeomagnetism, Elsevier, Amsterdam, New York, 1967, pp. 254-286.
- J. L. Kirschvink, “The Least-Squares Line and Plane and the Analysis of Palaeomagnetic Data,” Geophysical Journal International, Vol. 62, No. 3, 1980, pp. 699-718. http://dx.doi.org/10.1111/j.1365-246X.1980.tb02601.x
- R. A. Fisher, “Dispersion on a Sphere,” Proceedings of the Royal Society, Vol. 217, No. 1130, 1953, pp. 295-305. http://dx.doi.org/10.1098/rspa.1953.0064
- R. Van der Voo, “The Reliability of Paleomagnetic Data,” Tectonophysics, Vol. 184, No. 1, 1990, pp. 1-9. http://dx.doi.org/10.1016/0040-1951(90)90116-P
- T. H. Torsvik, R. Van der Voo, U. Preeden, C. M. Niocaill, B. Steinberger, P. V. Doubrovine, D. J. J. van Hinsbergen, M. Domeier, C. Gaina, E. Tohver, J. G. Meert, P. J. A. McCausland and L. R. M. Cocks, “Phanerozoic Polar Wander, Palaeogeography and Dynamics,” EarthScience Reviews, Vol. 114, No. 1-3, 2012, pp. 325-368. http://dx.doi.org/10.1016/j.earscirev.2012.06.007
- P. L. McFadden and M. W. McElhinny, “Classification of the Reversals Test in Palaeomagnetism,” Geophysical Journal International, Vol. 103, No. 3, 1990, pp. 725-729. http://dx.doi.org/10.1111/j.1365-246X.1990.tb05683.x
- H. Schandelmeier, E. Klitzsch, F. Hendriks and P. Wycisk, “Structural Development of North-East Africa since Precambrian Time,” Berliner Geowissenschaft Abhandlung, Vol. 75, 1987, pp. 5-24.
- J. Klerkx and C. C. Rundle, “Preliminary K/Ar Ages of Different Igneous Rock Formations from Jebel Uweinat Region (S.E. Libya),” Rapp. Ann. (1975), Mus. Roy. Afrique Centrale, Dep. Geol. Min., 1976, pp. 105-111.
- G. Franz, H. Puchelt and P. Pasteels, “Petrology, GeoChemistry and Age Relation of Triassic and Tertiary Volcanic Rocks from SW-Egypt and NW-Sudan,” Journal of African Earth Sciences, Vol. 6, No. 3, 1987, pp. 335-352.
- H. Schandelmeier and F. Darbyshire, “Metamorphic and Magmatic Events in the Uweinat Bir Safsaf Uplift (Western Desert, Egypt),” Geologische Rundschau, Vol. 73, No. 2, 1984, pp. 819-831. http://dx.doi.org/10.1007/BF01824984
- R. Y. Guiraud, J. Bellion, Benkhelil and C. Moreeau, “Post-Hercynian Tectonics in Northern and Western Africa,” African Geology Review, Geological Journal, Vol. 22, Suppl. 2, 1987, pp. 433-466.
- M. H. L. Deenen, M. Ruhl, N. R. Bonis, W. Krijgsman, W. Kuerschner, M. Reitsma and M. J. van Bergen, “A New Chronology for the End-Triassic Mass Extinction,” Earth and Planetary Science Letters, Vol. 291, No. 1-4, 2010, pp. 113-125. http://dx.doi.org/10.1016/j.epsl.2010.01.003
- C. Labails, J. L. Olivet, D. Aslanian and W. R. Roest, “An Alternative Early Opening Scenario for the Central Atlantic Ocean,” Earth and Planetary Science Letters, Vol. 297, No. 3-4, 2010, pp. 355-368. http://dx.doi.org/10.1016/j.epsl.2010.06.024
- A. Hashad and M. W. El Reedy, “Geochronology of the Anorogenic Alkaline Rocks, South Eastern Desert, Egypt,” Ann. Geol. Egypt, Vol. 9, 1979, pp. 81-101.
- M. E. H. Abdelrahman, “Geochemical and Mineralogical studies of Rare Metal Mineralization in Garra El Hamra Granite Syenite Complex and the Surrounding Environ, South Western Desert, Egypt”, M.Sc. Thesis, Mansoura University, Damietta, 2009, 155 p.
- C. M. C. Serencsits, M. F. El Ramly, K. A. Foland and A. A. Hussein, “Alkaline Ring Complexes in Egypt, There Ages and Relationship to Tectonic Development of Red Sea,” Ann. Geol. Surv. Egypt, Vol. 9, 1979, pp. 102-116.
- T. H. Torsvik, R. D. Tucker, L. D. Ashwal, E. A. Eide, N. A. Rakotosolofo and M. J. de Wit, “Late Cretaceous Magmatism in Madagascar: Palaeomagnetic Evidence for a Stationary Marion Hotspot,” Earth and Planetary Science Letters, Vol. 164, No. 1-2,1998, pp. 221-232. http://dx.doi.org/10.1016/S0012-821X(98)00206-4
- S. El Gaby, F. K. List and R. Tehrani, “Geology, Evolution and Metallogenesis of the Pan-African Belt in Egypt,” In: S. El Gaby and R. O. Greiling, Eds., The Pan-African Belt of Northeast Africa and Adjacent Areas, Friedrich Vieweg, Berlin,1988, pp. 17-68.
- G. Muttoni, E. Erba, D. V. Kent and V. Bachtadse, “Mesozoic Alpine Facies Deposition As a Result of Past Latitudinal Plate Motion,” Nature, Vol. 434, No. 7029, 2005, pp. 59-63. http://dx.doi.org/10.1038/nature03378
- M. J. M. Meijers, C. G. Langereis, D. J. J. van Hinsbergen, N. Kaymakcı, R. A. Stephenson and D. Altıner, “Jurassic-Cretaceous Low Paleolatitudes From the CircumBlack Sea Region (Crimea and Pontides) Due to True Polar Wander,” Earth and Planetary Science Letters, Vol. 296, No. 3-4, 2010, pp. 210-226. http://dx.doi.org/10.1016/j.epsl.2010.04.052