World Journal of Nuclear Science and Technology
Vol.4 No.2(2014), Article ID:44751,8 pages DOI:10.4236/wjnst.2014.42012
Theoretical Determination and Experimental Verification of Transport Index of Rectangular Shaped Radioactive Containers
Khalid Jamil1, Muhammad Asim2, Majid Irfat2, Shahid Manzoor1
1Radiation Physics Laboratory, Physics Department, COMSATS Institute of Information Technology, Islamabad, Pakistan
2Department of Physics and Applied Mathematics, Pakistan Institute of Engineering and Applied Sciences, Islamabad, Pakistan
Email: kjamil@comsats.edu.pk
Copyright © 2014 by authors and Scientific Research Publishing Inc.
This work is licensed under the Creative Commons Attribution International License (CC BY).
http://creativecommons.org/licenses/by/4.0/


Received 2 January 2014; revised 6 February 2014; accepted 22 February 2014
ABSTRACT
Ionizing radiations are widely used to sustain and enhance our quality of life in the areas such as medical diagnosis, therapy, scientific research and industry etc. Ionizing radiations are available from radioactive sources which are made of radioactive materials. The radioactive materials are produced in either nuclear power or research reactors or nuclear accelerators or extracted from the naturally found radioactive ores. These radioactive sources and radioactive materials need to be transported from their places of production to the places of applications and finally to waste repositories. The radioactive materials are transported in well designed packages having various shapes and sizes. In the field of radioactive transport, it is a mandatory to find the Transport Index (TI) to be mentioned on each package for transportation. This research is focused on the determination of the maximum γ-ray radiation dose at one meter from the surface of cubic and rectangular shaped package or containers. A computer code “Solid Angle for Transport Index” (SAFTI) has been developed using MATLAB to determine the location of maximum value of the radiation dose rate from the surface of a rectangular or square container. This maximum dose rate is used to determine the transport index. Some of the results of the code have been compared with the experimental results. The results of this research are useful not only to determine TI for individual packages but also to find the TI of the vehicles carrying the transport packages.
Keywords
Ionization Radiations, Radioactivity, Industry, Therapy, Nuclear Waste, Transport Index

1. Introduction
The worldwide use of radioactive materials and radiation sources in the fields of industry, energy production, medicine, agricultural sciences, scientific and technological research are very rewarding for sustaining and enhancing our quality of life [1] -[3] . While these radiations are useful their detrimental effects cannot be ignored. All radioactive materials emit radiations which are very harmful for the surrounded people if exposed. So, a great care is required to handle radioactive materials. Transport of radioactive sources and materials is often required but transportation of these radioactive materials and sources through public domain may cause hazards to the general public. Some 800,000 shipments of hazardous material are carried out on daily basis in USA that also includes radioactive materials [4] -[7] . It is the responsibility of the agencies transporting the radioactive materials to guarantee the safety of the general public.
Safety is defined, in one way, as taking all measures to minimize the occurrence of the accidents and if accident does take place then taking all measures to minimize the consequence of the accidents. To minimize the consequences of the accident the Transport Index (TI), just a number, helps the rescue team while taking actions after the accidents [8] . Transport Index (TI) is a number that is written on each package or container of radioactive material. The transport index is related to the maximum dose equivalent rate measured in mSv/h at one meter from the surface of a package containing radioactive material. The radiation dose determined in this way is multiplied by 100 and after rounding a whole number (without any unit) is used as Transport Index. Radioactive transportation packages are divided into different categories for shipment according to the “TI” that range generally from 0 to 10.
The maximum dose equivalent rate can be located only by a radiation detector scanning all surface of the package of container. In this research, we have developed a computer code to locate the position on the surface of a package or container where maximum dose may occur. In this research two types of popular geometry have been considered, i.e. square and rectangular. Some of the points of our theoretical model have been experimentally verified.
2. Theoretical Model
In this research, we have employed the basic concept of radiation dose from a point isotropic γ-ray source to a rectangular surface detector.
The radiation dose rate is given by
 (1)
(1)
where,
 = Photons flux (#/cm2-sec)
 = Energy of photons (MeV)
 = Linear mass absorption co-efficient (cm2/g)
dΩ = Solid angle that the point source subtend with the rectangular area 0.57 = the conversion factor It was further assumed for simplicity that
 = One photon/cm2 sec
 = 1 MeV
 = 1 cm2/g Then Equation (1) is reduced to
 (2)
(2)
where k is taken as 0.57. One can find the dose rate in real cases, just simply, by multiplying Equation (2) with the known flux (#/cm2-sec), γ-ray energy, E (MeV) and linear mass absorption coefficient  (cm2/g) of the dose receiving material.
Equation (2) shows that the maxima in the dose rate can occur only when the solid angle subtended by the rectangular surface of the package with point isotropic source has the maxima. The solid angle subtended by any area at a distance r from a point isotropic source can be given by [9]
 (3)
(3)
where da is a small area of any shape, and  is the unit normal vector to the surface and r is distance from the origin to observing point on the differential surface area. Now, consider an isotropic rectangular source and a point detector at height “h” as shown in Figure 1. Thus the solid angle dΩ subtended by the rectangle OABC at the point detector
  can be determined as [10]
 (4)
(4)
The solid angle subtended by the shaded area as shown in Figure 2 can be determined as
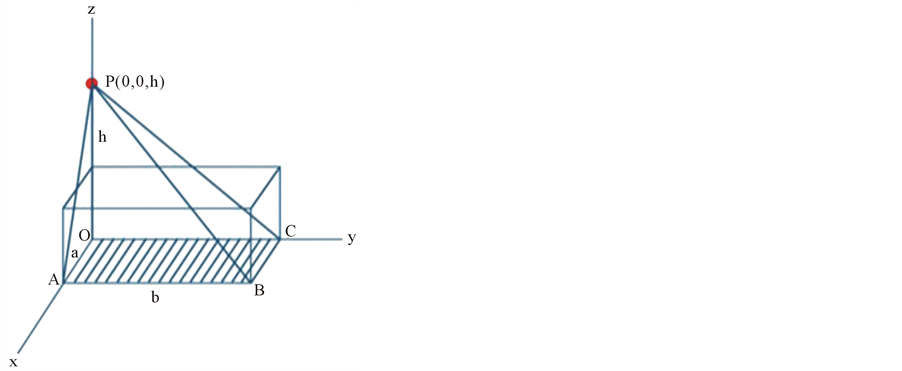
Figure 1. The solid angle subtended by the rectangle surface OABC at point P.
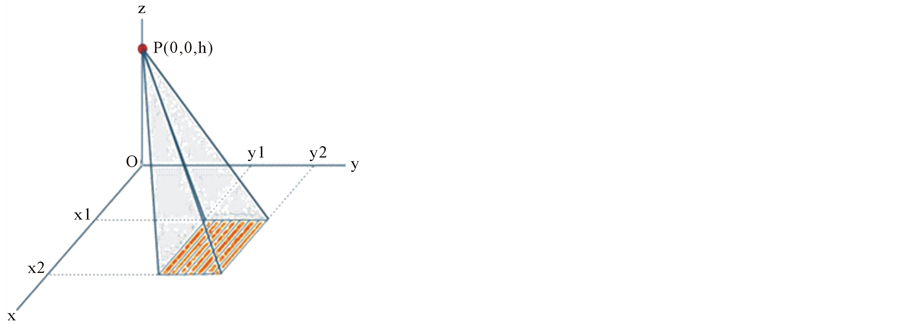
Figure 2. Solid angle subtended by the shaded area at point P(0, 0, h).
 (5)
(5)
Figure 3 depicts even a very general case where point detector is placed at a point . The solid angle is then given by
 (6)
(6)
Equation (6) covers the general situation for all square and rectangular packages or containers where the detector positions can vary as shown in Figure 3. One can move the detector position on the surface of the detector and determine the value of the solid angle. A computer code “Solid Angle For Transport Index” (SAFTI) has been developed using MATLAB to determine the location of maximum value of the radiation dose rate from the surface of a rectangular or square container. The SAFTI code is appended at the end of this paper to be used by the readers for required rectangular dimensions.
3. Experimental Verification
A sheet of paper of size 100 × 100 cm2 was placed on the table with a grid of 10 × 10 cm2. The experimental setup is shown in Figure 4. A 1.08 mCi, Co-60 gamma-ray source was placed at heights 50 cm, 75 cm and 100 cm
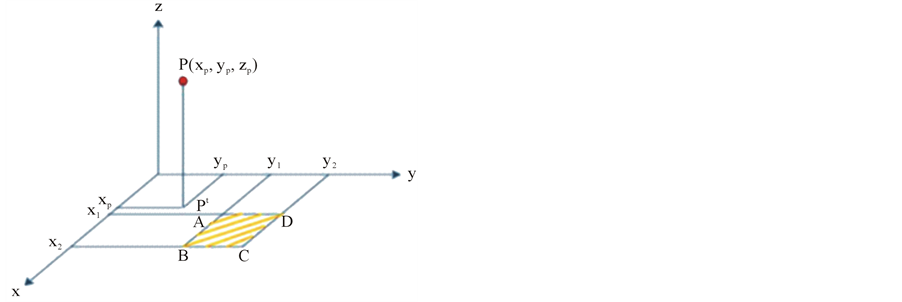
Figure 3. Solid angle subtended by the shaded rectangle ABCD at the general point P.
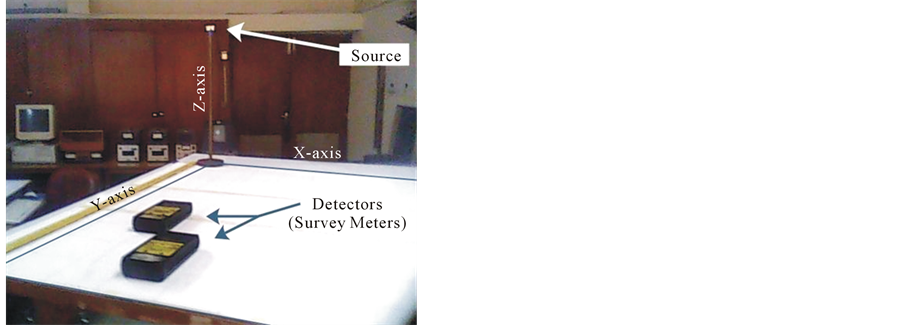
Figure 4. Experimental set up to measure the dose rate received by the detectors from a point source at different heights along z-axis.
along the z-axis in one set of experiment whereas the survey meter (PRM 300, Sr. No, 00528, 00529) were placed in different squares of dimension 10 cm × 10 cm. The survey meters were exposed for 72 hours.
4. Results and Discussion
We assumed a surface area of 1 m × 1 m. Making a grid of 10 × 10 cm2, solid angles were computed for different grids located on the plane. For this purpose a self developed code Solid Angle For Transport Index (SAFTI) was written in MATLAB. The computed dose rates are shown in the Tables 1-3 in the third column along with the computed solid angle in the forth column with respect to the positions of the source along z-axis. The experimental and theoretical results are in concordance. The small difference in experimental and computed results might be due to approximation of a point source as can be more pronounced at close distance such as the grid (2, 2) at 50 cm. However, the result shows that in air the maximum of the dose occurs if solid angle at the point detector has the maxima. For a square region 100 cm × 100 cm and 100 cm normal to the surface the maximum solid angle has been computed to be 0.805 steradian at the center of the square. These results are valid for all square shaped containers irrespective of the dimensions of the square. The minimum solid angle has been determined theoretically as 0.524 steradian on all corners of the square. Figure 5 shows the graphical representation of solid angles and thus the locations from where the transport Index may be determined.
Table 4 shows the computed values of solid angles with different surface size of the containers. The results

Table 1. It shows the experimental and theoretical values of dose rates and computed values of solid angles at different height (h) of the point detector along z-axis.
Table 2. It shows the experimental and theoretical values of dose rates and computed values of solid angles at different height (h) of the point detector along z-axis.
Table 3. It shows the experimental and theoretical values of dose rates and computed values of solid angles at different height (h) of the point detector along z-axis.
Table 4. It shows the minimum and maximum value of the solid angle with reference to the rectangular surface area of the radioactive source package.
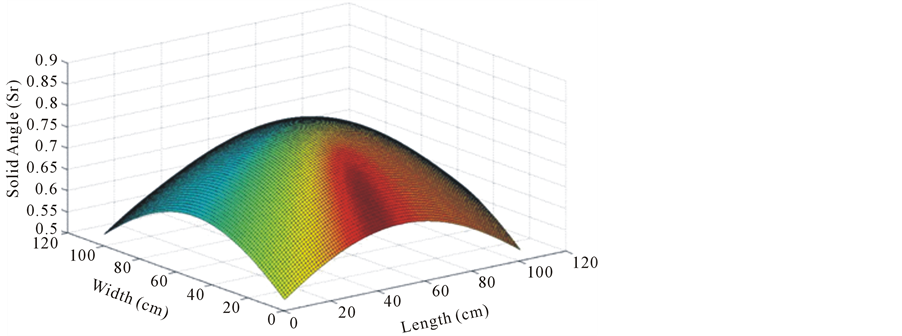
Figure 5. Variation of solid angles with detector positions normal to the surface on a square radioactive container (120 cm × 120 cm).
show that the maxima of dose rate occur at the point where the solid angle is maximum provided uniform radiation are emitted from the surface of the container. As the size of the radioactive container increases the solid angle approaches the maximum value of 2π steradian.
In this research, both the experiment and theory were conducted for a point source and a planer detector surface whereas determination of TI requires a planer source and a point detector. As a matter of fact, the two cases are related with a constant and the positions of the maximum radiation dose depend up on the maxima of the solid angle. The position of the maximum radiation dose lies of the intersection of the diagonal of the square or rectangular surface of the radioactive source package.
5. Conclusion
The result of this research shows that the maxima of the dose at one meter above the surface can be located with maxima of the solid angle. Since there is no instrument that can find the solid angle with a given plane, therefore, computational values can be employed to find the location of maximum dose rate and thus maximum value of the transport index can be found otherwise underestimated TI value will be quoted. The results show that the locations for the maximum dose rate are independent of the size of square. The location for maximum value of the solid angle remains the same for rectangular shaped surfaces as long as the ratio of the length to width is constant.
References
- Kuana, Y.-H., Bhata, R., Patrasb, A. and Karima, A.A. (2013) Radiation Processing of Food Proteins: A Review on the Recent Developments. Trends in Food Science and Technology, XX, 1-16.
- Rivera-Montalvo, T. (2014) Radiation Therapy Dosimetry System. Applied Radiation and Isotopes, 83, 204-209. http://dx.doi.org/10.1016/j.apradiso.2013.07.011
- Charlton, J.S. and Wellman, E.F. (1990) Quality Improvement in Industrial Process Plants—The Role of Radioisotopes. Applied Radiation and Isotopes, 41, 1067-1077. http://dx.doi.org/10.1016/0883-2889(90)90175-G
- Bolat, P. and Jin, Y.X. (2013) Risk Assessment of Potential Catastrophic Accidents for Transportation of Special Nuclear Materials through Turkish Straits. Energy Policy, 56, 126-135. http://dx.doi.org/10.1016/j.enpol.2012.12.010
- Reilly, A., Nozick, L., Xu, N.X. and Jones, D. (2012) Game Theory-Based Identification of Facility Use Restrictions for the Movement of Hazardous Materials under Terrorist Threat. Transportation Research Part E, 48, 115-131. http://dx.doi.org/10.1016/j.tre.2011.06.002
- Orphan, V.J., Muenchau, E., Gormley, J. and Richardson, R. (2005) Advanced γ Ray Technology for Scanning Cargo Containers. Applied Radiation and Isotopes, 63, 723-732.
- An, J., Xiang, X., Wu, Z., Zhou, L., Wang, L. and Wu, H. (2003) Progress on Developing 60Co Containers Inspection Systems. Applied Radiation and Isotopes, 58, 315-320. http://dx.doi.org/10.1016/S0969-8043(02)00319-6
- IAEA Safety Standard (2009) Regulations for Safe Transport of Radioactive Materials. Safety Requirements: No. TS-R-1. IAEA, Vienna. http://www-pub.iaea.org/MTCD/publications/PDF/Pub1384_web.pdf
- Tsoulfanidis, N. (1995) Measurement and Detection of Radiation. Taylor and Francis, New York.
- Oner, F. (2007) On the Evaluation of Rectangular Plane-Extended Sources and Their Associated Radiation Fields. Applied Radiation and Isotopes, 65, 1121-1124. http://dx.doi.org/10.1016/j.apradiso.2007.04.016
SAFTI-Computer Code (MATLAB)
% Solid Angle For Transport Index (SAFTI)
% Detector position can be selected by selecting xp, yp, zp.
% Program uses trapezoidal rule of integration clc;
format long g % Select position of the point detector xp=input('enter the value of xp=');
yp=input('enter the value of yp=');
zp=input('enter the height of the detector = ');
% Select the area by choosing the lower and upper limits in the xy-plane x1=input('enter the value of x1=');
x2=input('enter the value of x2=');
y1=input('enter the value of y1=');
y2=input('enter the value of y2=');
n=input ('number of mesh=');
sum=0.0;
x1p=x1-xp;
x2p=x2-xp;
h=(y2-y1)/n;
f=@(y)((x2p*zp)/((y-yp)^2+zp^2)*((y-yp)^2+x2p^2+zp^2)^-0.5-...
(x1p*zp)/((y-yp)^2+zp^2)*((y-yp)^2+x1p^2+zp^2)^-0.5); % Define your function fa=f(y1);
fb=f(y2);
for j=1:n-1;
sum=sum+f(y1+j*h);
solid_angle=sum*h+(h/2)*(fa+fb);
end
[solid_angle]