American Journal of Operations Research
Vol. 3 No. 3 (2013) , Article ID: 31674 , 13 pages DOI:10.4236/ajor.2013.33032
Dynamic Promotional Resource Allocation for Segment Specific and Spectrum Effect of Promotion for a Product Line Incorporating Repeat Purchase Behavior
1Department of Operational Research, University of Delhi, Delhi, India
2SBPPSE, Dr. B.R. Ambedkar University, Delhi, India
Email: jhapc@yahoo.com, prernamanik@gmail.com, anshu@aud.ac.in
Copyright © 2013 Prakash Chandra Jha et al. This is an open access article distributed under the Creative Commons Attribution License, which permits unrestricted use, distribution, and reproduction in any medium, provided the original work is properly cited.
Received January 21, 2013; revised February 23, 2013; accepted March 5, 2013
Keywords: Market Segmentation; Differentiated Market Promotion; Mass Market Promotion; Spectrum Effect; Promotional Effort Allocation; Repeat Purchase; Product Line; Non Linear Programming Problem; Differential Evolution
ABSTRACT
Promotion is an essential element in the marketing mix. It is used by businesses to inform, influence and persuade customers to adopt the products and services they offer. Without promotion, business would be stagnant and lack substantial growth because the brands would have low visibility in the market. Moreover, today’s vast and assorted markets comprise of customers with different needs and varied behavior. So it is rarely possible for companies to satisfy all customers by treating them alike. Thus there arises a need to divide the market into segments having customers with similar traits/characteristics. After identifying appropriate market segments, firms can design differentiated promotional campaigns for each segment. At the same time there can be a mass market promotional campaign that reaches different segments with a fixed spectrum. Also since promotional effort resources are limited, one must use them judiciously. In this paper, we formulate mathematical programming problem under repeat purchase scenario, which optimally allocates mass promotional effort resources and differentiated promotional effort resources across the segments dynamically in order to maximize the overall sales obtained from multiple products of a product line under budgetary and minimum sales aspiration level constraint on each product under consideration in each segment. The planning horizon is divided into multi periods, the adoption pattern of each product in each segment is observed in every subinterval and accordingly promotional effort allocations are determined for the next period till we reach the end of planning period. The optimization model has been further extended to incorporate minimum aspiration level constraints on total sales for each product under consideration from all the segments taken together. The non linear programming problem so formulated is solved using differential evolution approach. A numerical example has been discussed to illustrate applicability of the model.
1. Introduction
In the present marketplace, every customer has distinctive needs, expectations and choices and as a result, firms find it difficult to satisfy every customer. Furthermore, mass market approach has declined since past few years due to increasingly growing competition. Attributable to this, firms segregate markets into distinct segments consisting of customers with analogous traits/characteristics and thereby develop a standardized market mix for all the custommers in that segment. Market segmentation helps firms to understand and satisfy their customers better. Markets can be segmented on the basis of geographicaldemographical, psychographical and behavioral characteristics of the customers. After segmentation, firms can design an independent promotional campaign (also known as a differentiated market promotional campaign) for each segment. Such promotional campaigns directly influence the customers in that segment. Promoting the product through regional TV channels, local events, etc. are some examples of differentiated promotion where markets have been segmented geographically. Also, firms design promotional campaign for the complete market (also known as mass market promotional campaign). Promotion through TV commercials on national channels, radio, newspaper, etc., is major media of mass promotion. The idea behind such types of promotion is to communicate a message that will reach large masses. Mass promotion focuses on the average behavior of the entire population of potential customers. The potential customers in one segment have some eminent characteristics that differentiate them from the other segment. The impact of mass market promotion varies in different segments of the market and accordingly influences each segment with a fixed spectrum. Thus, in order to persuade larger customer base and also cater to distinct segment-wise customers’ needs, thereby increasing sales of their products, firms carry out both differentiated market as well as mass market promotion.
These days most of the firms offer product lines in order to cater to varying customers’ needs. A product line is a set of related products offered for sale by a firm. A product line is described in terms of line depth, consistency and vulnerability. Promotion plays an indispensable role for the firms with product lines, in efficiently positioning each product based on market segmentation and creating awareness amongst potential consumers for each product. In case of the promotion of a product line, resources are shared by the complete range of products in the line. So the available promotional effort resources must be allocated across market segments in such a manner that the total sale from all the products under consideration is maximized. Also different products in the product line have different product life cycle, consumeradopter parameters and the relative time of adoption based on individual’s readiness to try the products as proposed by Rogers [1]. Therefore, it is important to divide the total planning horizon, for which promotion is to be carried out, into distinct time periods. Once, the total planning horizon is divided into distinct time periods, model parameters can be estimated at the beginning of each period and accordingly the promotional decisions can be made attuned to the current market behavior for each product in each market segment. Also as the promotional resources are progressively spent in the market, consumer-adoption process and the repurchasing rates may vary significantly for each product in each segment. This in turn will impact the differentiated and mass market promotion strategies developed in each period and, therefore, promotional effort resources must be allocated systematically at the beginning of each period to maximize overall sales in each period and hence throughout the total planning period under system constraints.
In this paper, we formulate a promotional allocation problem for multi products of a product line under the combined effect of differentiated market and mass market promotion to maximize the total sales from all the products incorporating repeat purchase behavior under budgetary and minimum sales aspiration level constraint on each product in each segment. Further, the problem is extended to incorporate constraint pertaining to minimum aspiration level on total sales to be achieved for each product from all the segments taken together. The optimization problem divides the planning horizon into small intervals and dynamically allocates the promotional resources to each product in the product line for mass market promotion as well as differentiated market promotion in each segment in every time interval after re-estimating the adoption parameters using all the available sales data at the beginning of each period.
The problem formulated here is a non linear programming problem (NLPP). We use differential evolution (DE) approach to solve this problem. DE is a population based optimizer that generates new points that are perturbations of existing points using the scaled difference of two randomly selected population vectors. There is no particular requirement on the problem before using DE, so it can be applied to solve any kind of problem.
Rest of the paper is organized as follows. In Section 2, we discuss a brief literature review in the problem area. In Section 3, we discuss the mathematical model formulation and also develop its solution methodology. In Section 4, differential evolution algorithm is presented for solving the discussed problem. Numerical illustration has been discussed in Section 5. Section 6 concludes the paper.
2. Literature Review
Several innovation diffusion models exist in literature that describe the relationship between time and sales growth that have helped researchers to take important decisions regarding product life cycles, product modifications, promotion mix, resource allocation, price differentiation etc. The most well known and widely accepted model in diffusion theory is due to Bass [2]. Since the landmark work of Bass, many researchers have modified the model to overcome its limitations such as constant market size, absence of repeat purchasers etc. Bass, Krishnan and Jain [3] also developed a Generalized Bass Model (GBM) to describe the growth in adoption with respect to current marketing effort. Jha, Gupta and Kapur [4] proposed an alternative formulation of GBM, where the promotional effort intensity function represents current effect of dynamic marketing variables. Recently Jha, Aggarwal, Gupta and Kumar [5] developed a sales growth model for a segmented market in which the sales are assumed to be evolved through a combination of differentiated promotion done exclusively for each segment and the spectrum effect of mass promotion in each segment. This model is developed under the assumptions of constant market size and absence of repeat purchasers. The model is further extended by Jha, Aggarwal and Gupta [6] to incorporate repeat purchase behavior of the adopters and dynamic market size scenario.
Quite a few researchers have worked in the area of promotional resource allocation [7-23]. Davis and Taylor III [7] formulated a goal programming problem for allocating a state’s promotional effort to specific regions of the country based on the tourism potential of those regions. The model offered guidelines for states to allocate their promotional effort where allocation was based on several variables which reflect tourism potential. Berger and Bechwati [8] offered a general approach of promotion budget allocation, where the objective was to maximize customer equity. They used decision calculus in which managers’ judgments and/or estimates served as some of the inputs to formal modeling. A series of applications of their approach to promotion budget allocation were offered under different market conditions.
Izvercianu and Buciuman [9] developed a decision model concerning the resource allocation process for communication activities. The model described how the market should respond to different levels of budget. Managers can use such a decision model before taking a decision, to explore the consequences of different budget levels on sales and profit.
The main contributions in the area of promotional effort allocation in segmented market are by Kapur, Jha, Bardhan and Singh [10], Jha, Mittal, Singh and Kapur [11] and Jha, Gupta and Kapur [12]. They formulated optimization problems for marketing single product and multi products respectively in segmented market using Bass model of innovation diffusion to describe the adoption and proposed solution methods based on dynamic programming, goal programming and multi-objective programming approach. Further, Jha, Aggarwal and Gupta [13] and Jha, Aggarwal, Gupta and Kapur [14] formulated promotional effort allocation problem for single product and multi products respectively in segmented market where the market is subject to dynamic potential adopter population and repeat purchasing. These problems aimed to maximize the total sales of the products subject to the budget and technical constraints imposed by the management. Multicriteria optimization and goal programming approaches were used to solve the problems. Manik, Gupta and Jha [15,16] formulated optimal promotional effort allocation problems for a single product and multi products in a segmented subject to system constraints. The planning horizon was divided into multi time periods and the adoption pattern was observed in each period. They dynamically allocated the promotional efforts in each time period. The problem was solved using multi-objective programming approach.
However, when the system is too complex these mathematical programming approaches may not be very effective. In such cases evolutionary algorithms are employed to solve complex problems. Herrera, López and Rodríguez [17] devised a model for promotion mix management problem in conditions of uncertainty, supplying a linguistic decision model for evaluating the satisfaction of the objectives by the potential solutions. The process used genetic algorithm (GA) to find a good solution in promotion selection, such that it would both accomplish the communication objectives of the company and minimize the invested amount. Fam and Yang [18] investigated the effect of small retailers’ perception of environmental uncertainty on preference for in-store versus outdoor promotional tools and allocation of promotional budgets. They also studied the impact of promotional budget allocation on retailers’ market performance and the moderating role of environmental uncertainty in the relationships between promotional budget allocation and market performance. Hsu, Tsai and Chiang [19] integrated a fuzzy linguistic decision model with GA to extract the optimum promotion mix of a variety of tools under satisfying expected marketing performance and budget limitations.
Kapur, Aggarwal, Kaur and Basirzadeh [20] formulated an optimal promotional effort allocation problem of a single product in a segmented market using innovation diffusion model with consumer balking and repeat purchasing and solved it using GA. Manik, Gupta and Jha [21,22] developed a dynamic promotional resource allocation problem for a single product and multiple products respectively among distinctive market segments under budgetary and minimum aspiration level constraints where the market is subject to repeat purchasing. The non-linear programming problem so formulated was solved using DE algorithm. Further, Manik, Gupta and Jha [23] formulated a dynamic promotional allocation problem for a single product of a firm under the combined effect of differentiated and mass promotional campaigns to maximize the effectiveness of promotion measured through sales incorporating repeat purchase behavior for the product under budgetary and minimum sales aspiration level constraint on each segment. Problem was also extended to incorporate minimum aspiration level constraint on total sales to be achieved from all the segments taken together. The formulated NLPP was solved using DE algorithm.
Most of the literature in the area of promotional effort allocation allocates resources to single or multi products statically, i.e. once during the planning horizon. One of the major limitations of this approach is that it assumes that the parameters of the sales growth model remain unchanged throughout the planning horizon. However in practice as the diffusion and adoption process grows the model parameters change. Thus, there is a need to make allocation dynamically which can be accomplished by dividing the planning horizon into smaller time periods, re-estimating the sales growth model parameters at the beginning of each interval and thereby allocating the promotional resources period by period for each product in every segment.
In this paper, we formulate optimization problem based on Jha, Aggarwal and Gupta [6] model to optimally allocate differentiated and mass market promotional resources for multiple products across market segments under repeat purchase scenario for multi period promotional strategies by re-estimating the repeat purchase sales growth model parameters for each product in each segment in each time period.
3. Model Formulation
3.1. Notations
L: number of products Ml: number of market segments for product l, 
 : expected number of potential adopters of product l in segment i at the beginning of jth time period,
 ;
; ;
;
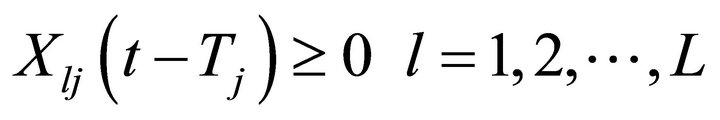
xlij(t): rate of differentiated market promotional effort expenditure for product l in segme-nt i in jth time period by time t,
xlj(t): rate of mass market promotional effort expenditure for product l in jth time period by time t,
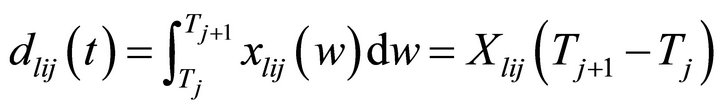
dlij(t) (dlij): total amount of differentiated market promotional effort resources to be allocated for product l to segment i in jth time period,
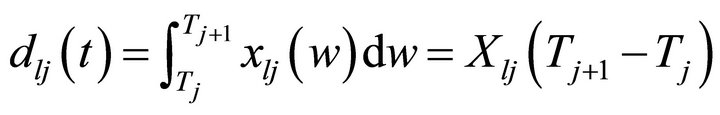
dlj(t) (dlj): total amount of mass market promotional effort resources to be allocated for produ-ct l to jth time period,
Dj: total amount of promotional effort resou-rces available in jth time period, 
m1/m2: lower/upper bound on mass market pro-motional effort resources to be allocated to the product Nlij(t): expected number of adopters of product l for segment i in jth time period by time t
αlij : spectrum effect of mass market promoti-onal campaign on lth product in ith market segment in jth time period blij(t): rate of adoption per remaining adopters f-or product l in segment i in jth time period glij : rate of repeat purchasing per unit adopti-on of product l in segment i in jth time period, 0 < glij < 1 rlj: minimum proportion of total market share to be achieved for product l in jth time period
 : minimum proportion of achievable market share for product l in segment i in jth time period T: length of the planning horizon Tj: time period j,
3.2. Marketing Model
Formulation of the optimization model requires a mathematical relation to describe the market growth of the product under consideration with respect to time, differentiated and mass promotion. Here we use the model due to Jha, Aggarwal and Gupta [6], to describe the relationship between time and sales growth. The model describes the cumulative adoption of a product with respect to combined effect of differentiated and mass market promotion.
The diffusion model is based on the following assumptions 1) The market for the product is segmented;
2) The consumer decision process is binary (adopt or not adopt);
3) The potential consumer population for the product in each segment is finite and remains constant during the promotional campaign;
4) In each segment buyers can be categorized into two groups: Innovators and Imitators. Innovators make their purchase decisions independently, whereas imitators buy the product through the word of mouth influence;
5) The consumer behavior of segments is independent of each other and promotional effort in one segment has no impact on others;
6) The parameters of external and internal influence are fixed over the diffusion process of the innovation in each segment;
7) The rate of purchase with respect to promotional effort intensity is proportional to the number of non-purchasers of the product;
8) The successive increase in the number of adopters may consist of first time buyers as well as repeat buyers of an innovation;
9) At any given time, g (0 < g < 1) proportion of total adoption is susceptible to repeat purchasing;
10) Repeat purchasing is influenced by all factors (both internal and external) influencing first purchase.
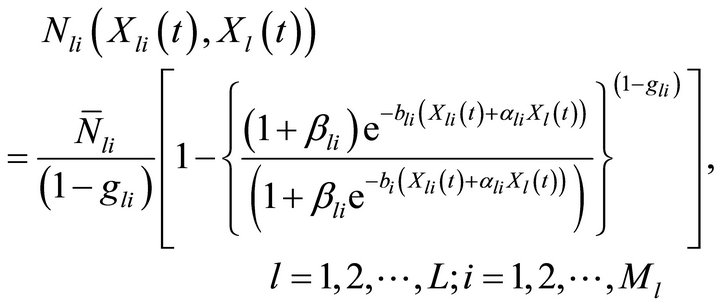
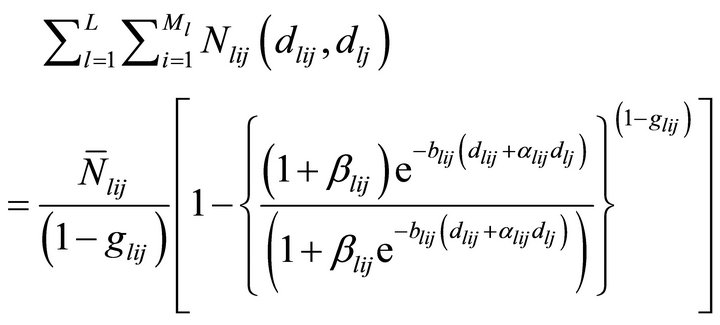
Model due to Jha, Aggarwal and Gupta [6] for the lth product is mathematically defined as
 (1)
(1)
The model in Equation (1) describes cumulative number of adopters of the products under the combined effect of differentiated market and mass market promotional effort intensity where the market is subject to repeat purchasing. The model is modified to suite the formulation of optimization model under consideration.
The developed optimization model allocates promotional resources dynamically among the products and segments. This is done by dividing the total planning horizon into smaller time intervals and allocating resources based on the current diffusion behavior. Let us assume here that the total planning horizon is divided into K (say, ) small time intervals. Further assume that the jth time period starts at time Tj and end at Tj+1 (refer to Figure 1). The unsaturated market size for product l in segment i in the jth time period (Tj< t ≤ Tj+1) is equal to
 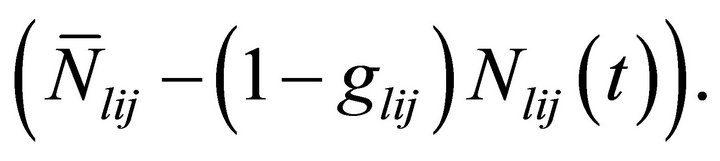 Based on the assumptions given above,
  satisfies the following differential equation
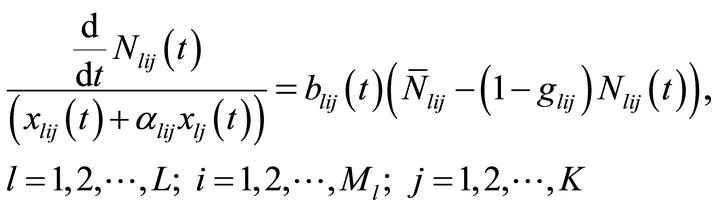 (2)
(2)
where 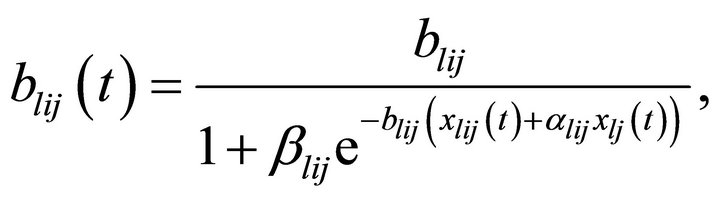 (3)
(3)
Consequently, the diffusion model takes the following form
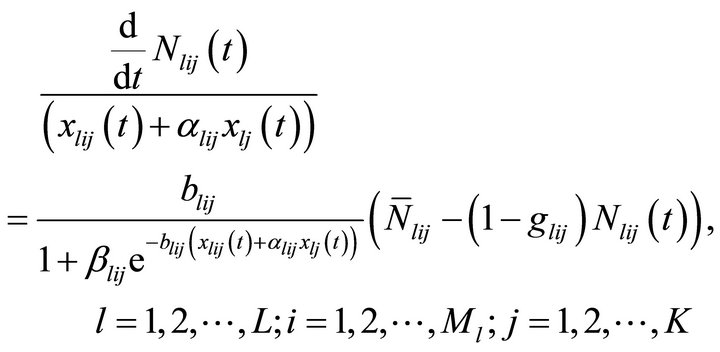 (4)
(4)
Solving this differential equation under the initial condition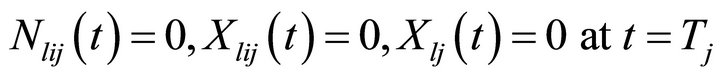 , we get
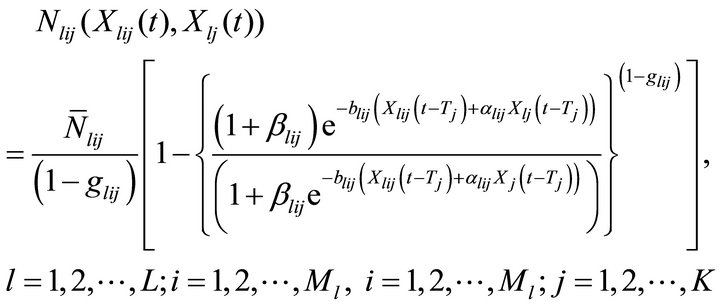 (5)
(5)
where, blij and βlij are the parameters in blij(t), ;
; ;
; . Equation (5) describes the expected number of adopters of product l with respect to the combined effect of differentiated and
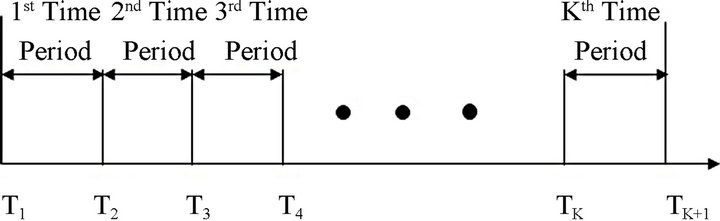
Figure 1. Time periods.
mass market promotional effort intensity in segment i in jth time period by time t. The parameters of model (5) can be estimated statistically after observing the market for certain duration.
3.3. The Optimization Problem
The diffusion model (5) is used here to formulate the optimization problem under budgetary and minimum sales aspiration level constraint on each product under consideration in each segment.
Time period for which promotional campaign is planned is fixed and the resources available to generate the awareness about the products are also limited. Therefore, promotional efforts must be allocated judiciously in each segment for every product in order to maximize the overall sales. We assume that the total time horizon for promotional campaign is divided into K time periods. In each period, the expected cumulative number of adopters is recorded for each product segment wise and the resources are allocated to each segment following the optimization model formulated in the paper depending upon the sales growth, available budget and the minimum aspiration level on sales as desired by the firm. At the end of each time period, the unsaturated market size in each segment is observed and the model parameters based on all the recorded sales growth data are re-estimated and allocations are re-determined for the next period. Reestimation of parameters in each time interval help in having a tight control over the diffusion process and allocating the promotional resources attuned to the current sales growth behavior in the previous period.
3.3.1. Optimization Model under Budget and Minimum Aspiration Level Constraint for Each Product in Each Segment
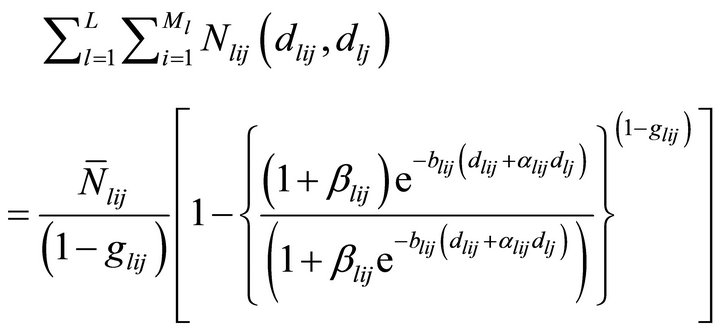
The problem for finding the optimal amount of promotional resources to be allocated to product l in segment i in jth time period that would maximize the total sales is formulated as
Maximize
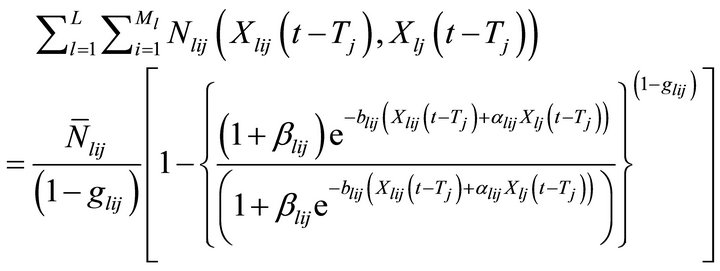
Subject to
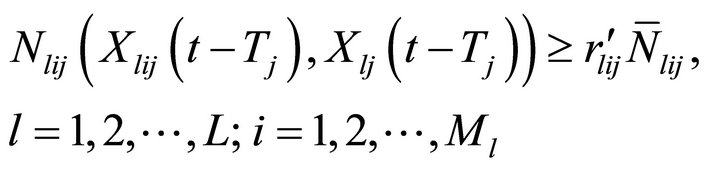
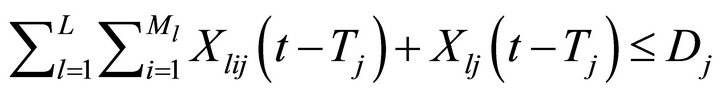
![]() (A)
(A)
![]()
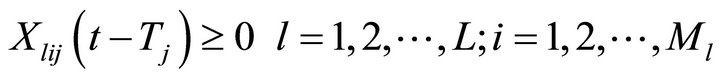
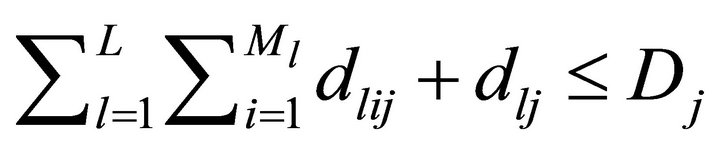
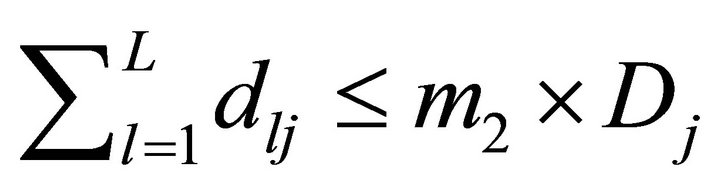
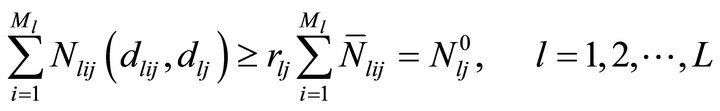
The objective function maximizes the cumulative number of adopters for all the l products in every market segment at the end of jth time period with respect to combined effect of differentiated and mass market promotional effort intensity where the market is subject to repeat purchasing. First constraint ensures that the firm fetches certain minimum proportion of market share for each product in each market segment by doing some promotional activities exclusively in those segments along with the mass promotion. Second constraint guarantees that the total amount of resources allocated to the market segments in jth time period to promote the L products does not exceed the total amount of promotional effort resources available for the jth time period, i.e. Dj. Third and fourth constraint is to allocate some proportion of total promotional resources between a lower bound m1 and an upper bound m2 to the mass market promotion of all the L products. These constraints are the system requirement as in the absence of these constraints, solution may provide very minimum or very large amount of resources for mass promotion. However such a solution may not be acceptable to the management as the mass promotion not only influence the adoption of products in the potential segment but also provides for the expansion of the market potential for the firm and building a competitive edge for the firm. These bounds are set by the management on the basis of experience from the past products behavior. Last two constraints guarantees that only a non-negative quantity of resource is allocated.
According to the definitions given above
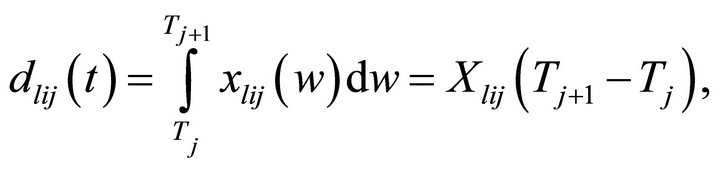
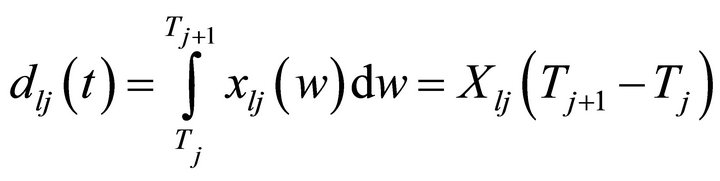 and since cumulative adoption is a function of promotional efforts and promotional resources are continuously spent in the market and sales of the product increases. Also the planning period for the product promotion is fixed. Therefore, without loss of generality the number of purchasers are assumed to be a function of promotional effort explicitly in the above equations. Hence the problem for the jth time period can be rewritten as
Maximize
Subject to


 (B)
(B)
Since, our aim is to determine differentiated market and mass market promotional effort allocation, dlij’s and dlj’s are the decision variables of the problem. Further these allocations are used to determine cumulative sales by time t denoted by Nlij(t) and % of captured market size. , blij, βlij, αlij and glij are the model parameters.
In the above formulation, if we take
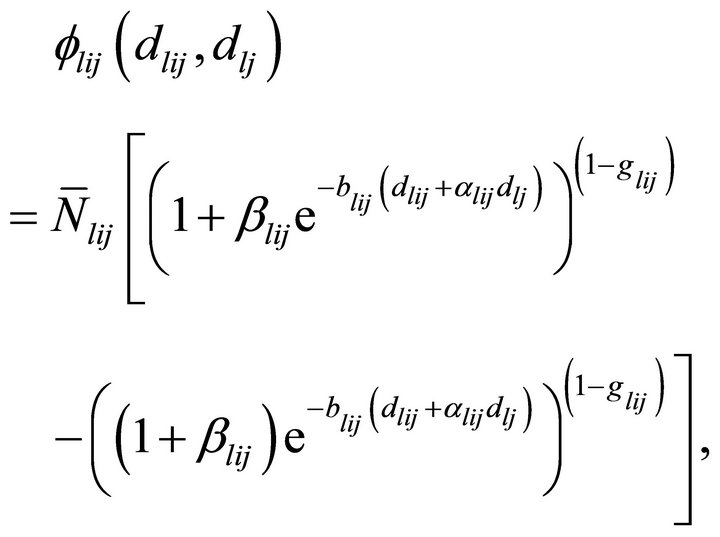
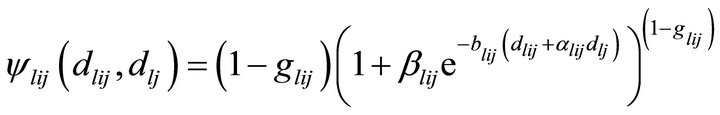
and
 ;
;
 ;
; , then resulting problem becomes maximization of a sum of ratios (fractional functions) under specified promotional effort expenditure in each time period which is again a fractional function.
The Hessian matrices 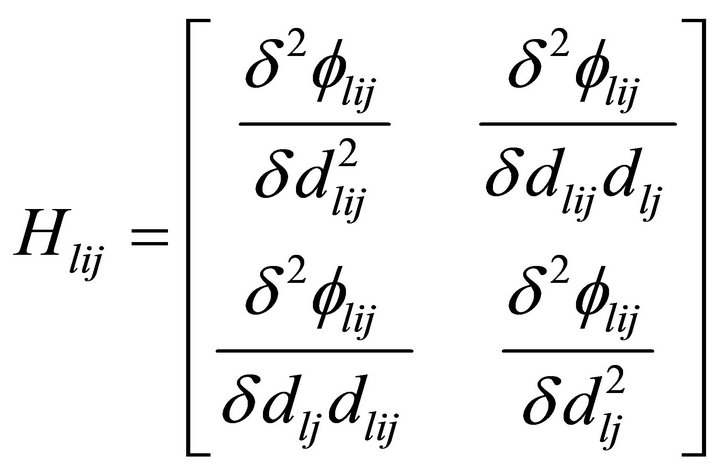 and
and
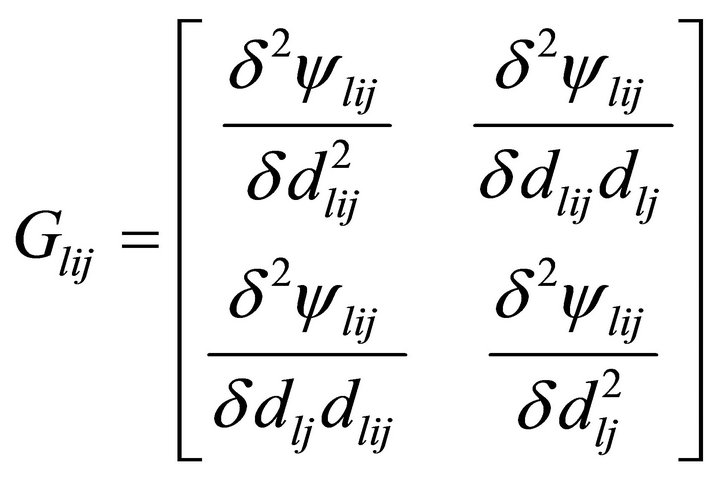 are negative semi-definite and positive semi-definite respectively, therefore, functions
  and
and  are concave and convex respectively. The ratio of concave and convex functions is a pseudo-concave function and the sum of pseudo-concave functions is not necessarily a pseudoconcave function. There does not exist any direct method to obtain an optimal solution for such class of problems. Further, the presence of power term (1 – glij) in the objective function of problem (B) adds to the complexity of the problem and requires use of some new optimization techniques based on natural evolution and natural genetics. Therefore, to handle such difficulties we have used DE for solving our formulated complex NLPP. The efficiency of DE lies in its ability of working with population of solutions and not an individual point. Therefore, DE can find the global optimum quickly and avoid falling into a local optimum.
3.3.2. Incorporating Minimum Total Market Potential Aspiration Constraint on Each Product from All the Segments Taken Together
In some realistic situations it is not judicious to set a minimum level of market share for each product in each market segment. Since diffusion rate varies from segment to segment, some products in one or more segments may show higher adoptability and adoptability for some products in some market segments might be hard, i.e., promotional efforts required to fetch an additional adopter may be very high for some products in some of the segments. The optimization model developed in the previous section imposes the constraint that promotion allocation should be made in such a way that some minimum proportion of adoption should be observed from each product in each segment. So the products with lower adoptability in some segments may lead to large proportion of promotional resource allocation as compared to the products that follow the trend of hard adoptability in some segments and consequently products which have higher propensity to be adopted in some segments may be allotted less resources. Thus, the total market share of the product decreases. This situation is not desirable by the management and hence it imposes a constraint to get hold of certain minimum proportion of total market share for each product collectively from all the segments in addition to the constraints of sales aspiration on each product in each segment. As a result problem (B) can be redefined as problem (C) given below
Maximize
Subject to

 (C)
(C)


However, if minimum level of target product adoption to be obtained in each segment is very high and also if the management aims to fetch certain minimum proportion of total market share for each product from all the segments taken together, it may lead to infeasibility in the problem. Infeasibility suggests either to increase the level of promotional resources or to obtain a compromised solution. In most situations a compromised solution is obtained as it gives a better decision making capability to the management as to what needs to be compromised and by how much. In order to incorporate such aspirations in the problem formulation, DE algorithm can be used to obtain the best possible solution. Procedure for applying DE is presented in Section 4.
Optimization model developed here serves as a generic model and may also be used in a marketing environment different from the one under consideration. Assuming the rate of repeat purchase for the products to be negligible, as a special case, the model may be used with value of the repeat purchase parameter as 0. In other situation if the resources are to be allocated only once in the planning period then problem (C) can be suitably modified for the scenario by removing the index j which accounts for the time periods in the optimization problem. These problems can be solved using the same technique as discussed above.
4. Differential Evolution Algorithm
Differential evolution is an evolutionary algorithm [24- 28], which is rapidly growing field of artificial intelligence. This class also includes genetic algorithms, evolutionary strategies and evolutionary programming. DE was proposed by Price and Storn [24]. Since then it has earned a reputation as a very powerful and effective global optimizer. The basic steps of DE are as follows Start Step 1: Generate an initial population of random individuals Step 2: Create a new population by repeating following steps until the stopping criterion is achieved
• [Selection] Select the random individuals for reproduction
• [Reproduction] Create new individuals from selected ones by mutation and crossover
• [Evolution] Compute the fitness values of the individuals
• [Advanced Population] Select the new generation from target individual and trial individuals
• End steps
4.1. Initialization
Suppose we want to optimize a function of D number of real parameters. We must select a population of size NP. NP parameter vectors have the form
where, D is dimension, i is an individual index and G represents the number of generations.
First, all the solution vectors in a population are randomly initialized. The initial solution vectors are generated between lower and upper bounds  and
and  using the equation
where, i is an individual index, j is component index and randi,j[0,1] is a uniformly distributed random number lying between 0 and 1. This randomly generated population of vectors  is known as target vectors.
4.2. Mutation
Each of the NP parameter vectors undergo mutation, recombination and selection. Mutation expands the search space. For a given parameter vector Xi,G, three vectors  are randomly selected such that the indices i, r1, r2, r3 are distinct. The ith perturbed individual, Vi,G, is therefore generated based on the three chosen individuals as follows
where,  are randomly selected, such that r1≠r2≠r3≠i, FÎ(0, 1.2] and Vi,G is called the mutation vector.
4.3. Crossover
The perturbed individual, 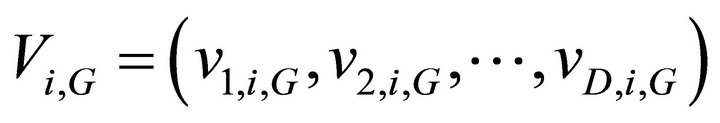 and the current population member,
  are then subject to the crossover operation, that finally generates the population of candidates, or “trial” vectors,
 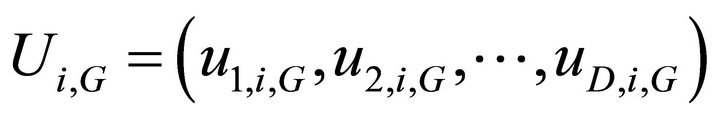 , as follows
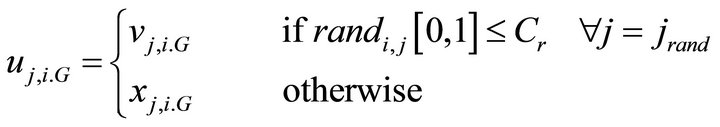
where,  is a crossover probability,
  is a random parameter’s index, chosen once for each i.
4.4. Selection
The population for the next generation is selected from the individuals in current population and its corresponding trial vector according to the following rule
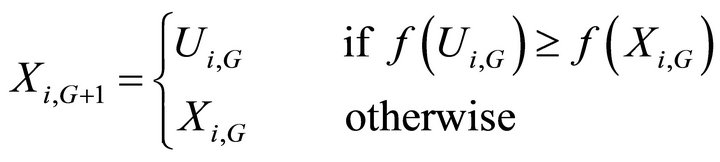
where, f(∙) is the objective function value. Each individual of the temporary population is compared with its counterpart in the current population. Mutation, recombination and selection continue until stopping criterion is reached.
4.5. Constraint Handling in DE
Pareto ranking method is used to handle constraints in DE. The value of constraints is calculated at target and trial vectors. The method is based on the following three rules:
1) Between two feasible vectors (target and trial), the one with the best value of the objective function is preferred;
2) If out of target and trial vectors, one vector is feasible and the other is infeasible, the one which is feasible is preferred;
3) Between two infeasible vectors, the one with the lowest sum of constraint violation is preferred.
4.6. Stopping Criterion
DE algorithm stops when either 1) Maximum number of generations are reached or 2) Desired accuracy is achieved i.e.

5. Numerical Illustration
Earlier firms were only concerned with promoting their products in the mass market. But of late due to increasingly diverse and broad market scenario, firms have been progressively using both differentiated market and mass market promotion strategies to appeal to the large customer base as well as assorted customer segments, primarily in pluralist, multilingual and multicultural countries like India, which poses a challenge in terms of catering to diversity. For e.g. companies like Maruti Suzuki India Limited, Samsung, Chevrolet to name a few use a multitude of national and regional promotional vehicles and media for designing their differentiated and mass promotional strategies to effectively influence a larger customer base. Hence, in such a scenario it is very important to allocate atleast 30% - 40% of the total budget to mass market promotion.
For practical application of the formulated model, we consider three products of a firm’s product line of an ABC automobile company. The company name and data has not been disclosed for the confidentiality reasons. Initial sales data is available for adoption of products under the influence of mass and differentiated promotion, for all the products under consideration, in four geographic segments in the country. We assume that the planning horizon is divided into three equal time periods and model parameters have already been estimated for the 1st time period, as listed in columns 2, 3, 4, 5 and 6 of Table 1. Further, we assume that firm promotes its three products (i.e. L = 3), each in four market segments (i.e. Ml = 4). The total promotional budget is assumed to be 177 units in time period T1 where cost per unit promotional effort is 25,000,000. It is assumed that the firm desires to fetch sales of at least 25% from each product in each segment. In practice, these estimates are obtained either from the test marketing/launch period data or from data pertaining to existing analogous products. Accordingly, problem (B) is solved using DE. Parameters of DE are listed in Table 2. A desired accuracy of 0.001 between maximum and minimum values of fitness function was taken as terminating criteria of the algorithm. Results for the 1st time period are tabulated in columns 7, 8, 9 and 10 of Table 1. In case, the firm also requires to acquire atleast 40% of the total market share for each product from all the segments taken together, the resulting problem (C) has no feasible solution and hence in this case DE gives a compromise solution which is given in columns 11, 12, 13 and 14 of Table 1.
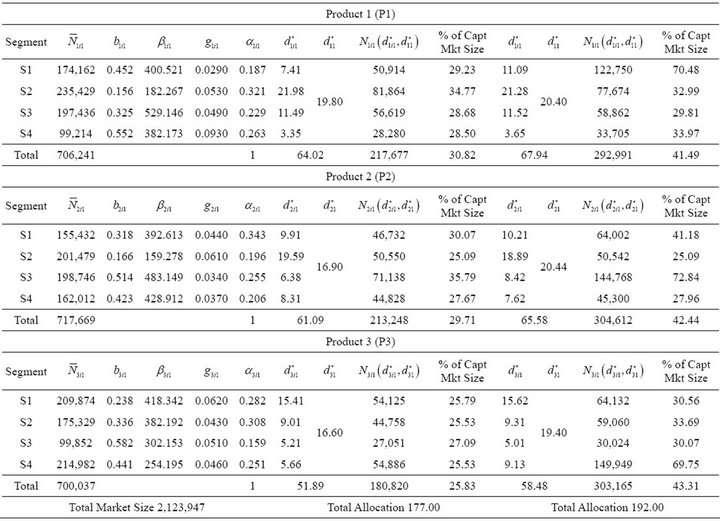
Table 1. Results of time period 1 (T1).
On solving problem (B), it can be seen that, cumulative sales at the end of 1st time period are 30.82%, 29.71% and 25.83% of the total market potential for products 1, 2 and 3 respectively. When the firm imposes the constraint of fetching atleast 40% of the total market share for each product from all the segments taken together, the total market potential covered shows an increment to 41.49%, 42.44% and 43.31% for products 1, 2 and 3 respectively. However, due to infeasibility in the problem DE gave compromised values of promotional resources utilized. The solution suggests increasing the promotional resources limit to 192 units. In case promotional resources can’t be increased the management must decrease the aspiration on total sales. Also it can be seen from Table 1 that product P1 in segment S1 show decrease in % of captured market size after addition of the constraint of fetching at least 40% of the total market share for each product from all the segments taken together. % of captured market size for P1 in S1 decreased from 34.77% to 32.99% after addition of the constraint.
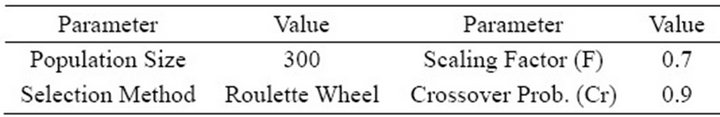
Table 2. Parameters of differential evolution.
For the 2nd time period, all model parameters are reestimated based on complete sales growth data before the beginning of 2nd time period and the resources are dynamically allocated across the market segments. Total budget allocated in this time period is 179 units. For time periods T2 and T3, we solve problem (C) only assuming that the firm desires to fetch minimum 25% sales from each product in each segment and atleast 40% of the total market share for each product from all the segments taken together in each time period. Note that in every period the market potential is re-estimated for each product segment-wise. Here it is observed that the total potential at the end of any period shows an increment over the previous period as remaining potential shows a change (generally increase) in the initial planning periods. For example the market potential for product 1 in segment S1 in first period (P1, S1, T1) is 174,162, out of which 70.48% is captured in the first period. The remaining potential based on first period estimates is 54,972 (= 174,162 − (1 − 0.0290) × 122,750), but the estimates of 2nd period gives remaining potential as 58,105, an increase of 3133. Thus total potential for (P1, S1, T2) is 177,295 (= 58,105 + (1 − 0.0290) × 122,750 i.e. 174,162 + 3133). Results for 2nd time period are tabulated in Table 3.
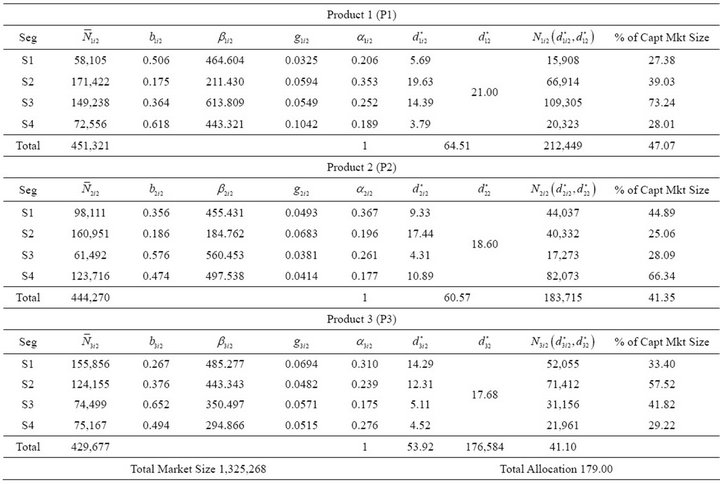
Table 3. Results of time period 2 (T2).
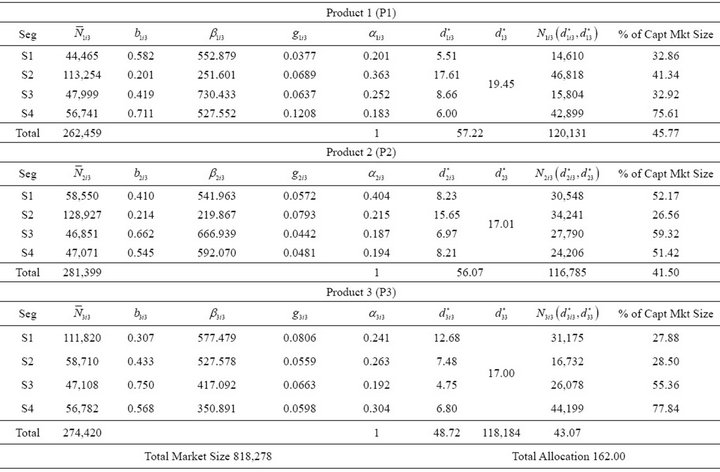
Table 4. Results of time period 3 (T3).
Cumulative sales for each product are calculated at the end of time period T2 considering sum of cumulative sales for each product across segments over T1 and T2 as % of total market potential in the time period T2. Hence cumulative sales for product P1 at the end of T2 are  Similarly cumulative sales for product P2 and P3 at the end of time period T2 are 65.21% and 65.46% respectively. At the beginning of 3rd time period the model parameters are again re-estimated based on the sales growth data. Total budget allocated in this time period is 162 units. Table 4 gives results of 3rd time period.
Cumulative sales for each product are calculated at the end of time period T3 considering sum of cumulative sales for each product across segments over T1, T2 and T3 as % of total market potential by T3. Hence cumulative sales for product P1 at the end of T3 are {(292,991 + 212,449 + 120,131) × 100/(292,991 + 212,449 + 262,459)} = 81.47%. Similarly cumulative sales for product P2 and P3 at the end of time period T3 are 78.61% and 79.28% respectively.
As can be seen from above, cumulative sales as percentage of total market potential for product 1 at the end of T1, T2 and T3 is 41.49%, 67.91% and 81.47%. We observe similar trend for products 2 and 3 as well as shown in Table 5.
In case of each of the three products under consideration, at the outset when the product is launched, it is promoted expansively to create awareness among potential customers. As a result, the total resource allocation for the 1st time period is comparatively higher. This leads to immediate adoption of product largely by innovators and early adaptors, who then act as opinion leaders. With the passage of time, there is an increase in adoption of the product by word of mouth and the market size increases due to effective promotional efforts. Also, for each of the three products under consideration, the sales during a given time period is more than the corresponding increase in the market size which leads to decrease in unsaturated market size at the start of subsequent time periods. While cumulative sales as percentage of total market potential for product 1 at the end of 1st, 2nd and 3rd time periods are 41.49%, 67.91% and 81.47% respectively, there is a decrease in % increase in cumulative sales for P1 at the end of subsequent time periods, which is 26.42% and 13.56% respectively. Thus, the cost effectiveness of the promotional effort has reduced over subsequent time periods. This reinforces the need for dynamic allocation of available promotional effort judiciously and objectively across market segments under repeat purchase scenario incorporating multi-period promotion strategies to maximize overall sales of the prod-
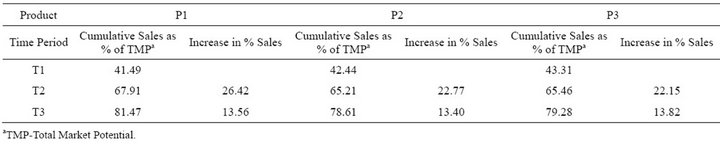
Table 5. Product-wise percentage of adoption from total market potential & corresponding increase in percentage adoption.
ucts under consideration subject to budgetary and minimum sales aspiration constraints.
6. Conclusion
In this paper, we have formulated a dynamic promotional effort resource allocation problem with respect to combined effect of differentiated market and mass market promotional effort intensity in order to maximize the sales of multiple products of a firm’s product line under budgetary and minimum aspiration level constraint on each product in each segment where the market is subject to repeat purchasing. The problem has been further extended to incorporate the constraint on minimum proportion of market share to be achieved for each product from all the segments taken together. Solution methodology for the problem has also been discussed. Applicability of the model has been shown using a numerical example. The approach followed in the paper gives several useful results for the promotional strategies designed for each segment as well as for the mass market. Division of the planning horizon into smaller periods allows re-estimation of the sales growth parameters using all available data and re-allocation of promotional resources. It provides dual advantage, first, promotional decisions can be made attuned to the current market behavior for each product in each market segment and allowing judicious use of the firm’s resources; second, the approach gives realistic values of the saturated and unsaturated market potential as compared to the optimistic/pessimistic values obtained from other approaches discussed in the literature. The paper offers a scope for further research such as explicit consideration for dynamic increasing market size, multiple purchases etc.
REFERENCES
- E. M. Rogers, “Diffusion of Innovations,” The Free Press, New York, 1962.
- F. M. Bass, “A New Product Growth Model for Consumer Durables,” Management Science, Vol. 15, No. 5, 1969, pp. 215-227. doi:10.1287/mnsc.15.5.215
- F. M. Bass, T. V. Krishnan and D. C. Jain, “Why the Bass Model Fits without Decision Variables,” Marketing Science, Vol. 13, No. 3, 1994, pp. 203-223. doi:10.1287/mksc.13.3.203
- P. C. Jha, A. Gupta and P. K. Kapur, “Bass Model Revisited,” Journal of Statistics and Management Systems, Vol. 11, No. 3, 2006, pp. 413-437.
- P. C. Jha, S. Aggarwal, A. Gupta and U. D. Kumar, “Innovation Diffusion Model for a Product Incorporating Segment-Specific Strategy and the Spectrum Effect of Promotion,” Communicated Paper, 2012.
- P. C. Jha, S. Aggarwal and A. Gupta, “A Repeat Purchase and Dynamic Adopter Innovation Diffusion Model for a Product Incorporating Segment-Specific Strategy and the Spectrum Effect of Promotion,” Communicated Paper, 2012.
- K. R. Davis and B. W. Taylor III, “A Goal Programming Model for Allocating State Promotional Effort to Regional Markets in Accordance with Tourism Potential,” Journal of Travel Research, Vol. 18, No. 4, 1980, pp. 24-30. doi:10.1177/004728758001800404
- P. D. Berger and N. N. Bechwati, “The Allocation of Promotion Budget to Maximize Customer Equity,” Omega, Vol. 29, No. 1, 2001, pp. 49-61. doi:10.1016/S0305-0483(00)00023-2
- M. Izvercianu and C. F. Buciuman, “A Response Model to Optimize Resource Allocation for the Marketing Communication Mix,” Annals of the Ordea University, Fascicle of Management and Technological Engineering, XI (XXI), 2012.
- P. K. Kapur, P. C. Jha, A. K. Bardhan and O. Singh, “Allocation of Promotional Resource for a New Product in a Segmented Market,” In: V. K. Kapoor, Ed., Mathematics and Information Theory: Recent Topics and Applications, Anamaya Publishers, New Delhi, 2004, pp. 52-61.
- P. C. Jha, R. Mittal, O. Singh and P. K. Kapur, “Allocation of Promotional Resource for Multi-Products in a Segmented Market,” Presented in ICORAID-2005-ORSI and Published in Proceedings, 2005.
- P. C. Jha, A. Gupta and P. K. Kapur, “On Maximizing the Adoption of Multi-Products in Multiple Market Segments,” Journal of Information and Optimization Sciences, Vol. 28, No. 2, 2007, pp. 219-245.
- P. C. Jha, R. Aggarwal and A. Gupta, “Optimal Allocation of Promotional Resource under Dynamic Market Size for Single Product in Segmented Market,” Presented at the International Conference on Development & Applications of Statistics in Emerging Areas of Science & Technology, Jammu, 2010.
- P. C. Jha, R. Aggarwal, A. Gupta and P. K. Kapur, “Optimal Allocation of Promotional Resource for Multi-Product in Segmented Market for Dynamic Potential Adopter and Repeat Purchasing Diffusion Models,” International Journal of Advanced Operations Management, Vol. 3, No. 3-4, 2011, pp. 257-270. doi:10.1504/IJAOM.2011.045458
- P. Manik, A. Gupta and P. C. Jha, “Promotional Effort Allocation in Segmented Market Incorporating Multi-Period Promotion Strategies in a Planning Horizon,” In: B. K. Mishra, Ed., Proceedings of the National Conference on Mathematical and Statistical Modeling in Innovative Areas, Ranchi, 19-20 October 2011, pp. 32-41.
- P. Manik, A. Gupta and P. C. Jha, “Dynamic Promotional Resource Allocation for Multi-Products in a Segmented Market,” In: S. Kumar, et al., Eds., Handbook of Management and Behavioural Science, Wisdom Publications, Delhi, Vol. 7, 2012, pp. 585-602.
- F. Herrera, E. López and M. A. Rodríguez, “A Linguistic Decision Model for Promotion Mix Management Solved with Genetic Algorithms,” Fuzzy Sets and Systems, Vol. 131, No. 1, 2002, pp. 47-61. doi:10.1016/S0165-0114(01)00254-8
- K. S. Fam and Z. Yang, “Primary Influences of Environmental Uncertainty on Promotions Budget Allocation and Performance: A Cross-Country Study of Retail Advertiser,” Journal of Business Research, Vol. 59, No. 2, 2006, pp. 259-267. doi:10.1016/j.jbusres.2005.03.010
- T. H. Hsu., T. N. Tsai and P. L. Chiang, “Selection of the Optimum Promotion Mix by Integrating a Fuzzy Linguistic Decision Model with Genetic Algorithms,” Information Sciences, Vol. 179, No. 1-2, 2009, pp. 41-52. doi:10.1016/j.ins.2008.09.013
- P. K. Kapur, A. G. Aggarwal, G. Kaur and M. Basirzadeh, “Optimising Adoption of a Single Product in MultiSegmented Market Using Innovation Diffusion Model with Consumer Balking,” International Journal of Technology Marketing, Vol. 5, No. 3, 2010, pp. 234-249. doi:10.1504/IJTMKT.2010.039035
- P. Manik, A. Gupta and P. C. Jha, “Differential Evolution Approach to Promotional Effort Allocation in Segmented Market for Multi-Period Promotion Strategies in a Planning Horizon Incorporating Repeat Purchase,” In: K. Deep, et al., Eds., Advances in Intelligent and Soft Computing, Vol. 131, Springer, New Delhi, 2012, pp. 979- 991.
- P. Manik, A. Gupta and P. C. Jha, “Dynamic Promotional Allocation for Multi-Products in Segmented Market under First and Repeat Purchase Behaviour,” Communicated Paper, 2012.
- P. Manik, A. Gupta and P. C. Jha, “Multi Stage Promotional Resource Allocation for Segment Specific and Spectrum Effect of Promotion for a Product Incorporating Repeat Purchase Behavior,” Communicated Paper, 2013.
- K. V. Price and R. M. Storn, “Differential Evolution: A Simple and Efficient Adaptive Scheme for Global Optimization over Continuous Space,” Technical Report No. TR-95-012, ICSI, 1995.
- K. V. Price and R. M. Storn, “Differential Evolution: A Simple and Efficient Heuristic for Global Optimization Over Continuous Spaces,” Journal of Global Optimization, Vol. 11, No. 4, 1997, pp. 341-359.
- K. V. Price, “An Introduction to Differential Evolution,” In: D. Corne, D. Marco and F. Glover, Eds., New Ideas in Optimization, McGraw-Hill, London, 1999, pp. 78-108.
- K. V. Price, R. M. Storn and J. A. Lampinen, “Differential Evolution: A Practical Approach to Global Optimization,” Springer, Berlin, 2005.
- V. Feoktistov, “Differential Evolution: In Search of Solutions,” Springer, Berlin, 2006.