American Journal of Operations Research
Vol. 2 No. 1 (2012) , Article ID: 17827 , 7 pages DOI:10.4236/ajor.2012.21004
Empirical Analysis for High Quality Software Development
1IT Software Operations Unit, NEC Corporation, Tokyo, Japan
2Department of Social Management Engineering, Graduate School of Engineering, Tottori University, Tottori, Japan
Email: n-honda@ay.jp.nec.com, yamada@sse.tottori-u.ac.jp
Received January 18, 2012; revised February 20, 2012; accepted February 29, 2012
Keywords: Software Process; Review; Quantitative Management; Process Quality; Product Quality
ABSTRACT
It remains important for a development organization to configure a software process that enables it to develop software products with the least possible number of defects after shipment. A development organization of CMMI level 5 has, over three years, been strived to improve those software projects that had been noted as having many defects after shipment. In this paper, we discuss our organization’s improvement (Kaizen) activities, to analyze the important matters of software process to be considered when developing a software product with the least possible number of defects after shipment. Our results are identified by three important points: 1) early ensured quality by defect detection during design or code review; 2) quality assurance for both process quality and product one; and 3) quantitative management by which data of the appropriate resolution can be collected at an appropriate timing.
1. Introduction
Software must take on the role of managing the systems that support the infrastructures on which society depends. Given this degree of dependence, society has the right to demand the development of software products that are shipped with as few defects after shipment as possible. The venders that supply software products have difficulty in satisfying this requirement, however [1].
In response to the above, several different development and management techniques for improving the quality of software have been proposed. Among them, CMMI is widely applied worldwide. Unfortunately, even though a high level of CMMI is attained, satisfactory quality of software cannot always be obtained [2]. In fact, some development organizations with CMMI level 5 exhibit many defects after shipment.
The CMMI level 5 organization has spent three years working on improving software products that had exhibited many defects after shipment, based on the results of benchmarking other organizations with the same level, as part of its activities to reduce the number of defects after shipment. This paper describes the results. Based on the results, this paper discusses the software process conditions required to develop software products that have few defects after shipment. In this paper, a CMMI level 5 organization was selected as a case study because the loss of process areas itself has little effect on the number of defects after shipment, due to well-established software process of the organization.
2. Overview of Organization
This paper presents two CMMI level 5 organizations as a case study. These are called Organizations A and B. Organization A’s product exhibits a smaller number of defects after shipment than that produced by Organization B. Organization B planned improvement (Kaizen) measures by benchmarking A, and conducted Kaizen activeties. This paper outlines organizations A and B, and discusses the number of defects after shipment of the products produced by the organizations.
2.1. Organizations Characteristic
Organizations A and B belong to the same company and develop general-purpose IT-related software products in their different business areas. These organizations’ customer groups are basically in the same enterprise area. Organization A has almost the same shipment volume, development amount, and number of engineers as B. The two organizations applied almost the same software process and accomplished CMMI level of 5 in the early 2000s. Usually, they would apply V-shaped model and implement V&V. Their development techniques, such as those for design and testing, are almost the same. Both adopt the “Quality accounting” internally created and developed as a quality management method [3].
2.2. Number of Defects after Shipment
Figure 1 shows the number of defects after shipment in the products produced by Organization A and those of Organization B (see Organizations A and B before Kaizen). On the basis of the mean number of defects after shipment, assuming that the number of defects in the products of Organization A is 100, the number of defects in those of Organization B will reach 283. It can be shown that the number of defects after shipment by B is almost three times bigger than that appearing in the products of A. Organization B clearly had a problem with the number of defects after shipment in its products. This triggered Kaizen activities in Organization B.
3. Kaizen Measures in Organization B
Organization B analyzed significant differences between itself and Organization A by applying benchmarking to A. The main differences were found to be:
• Effectiveness of defect detection during design or code review;
• Quality assurance activities performed by Quality Assurance group (hereafter, called QA group);
• Quantitative management method;
These are detailed in the following.
3.1. Effectiveness of Defect Detection during Design or Code Review
The metrics used in this paper are listed in Table 1. Data on Organizations A and B (before Kaizen) are listed in Table 2. Table 2 lists the relative values when each mean index in Organization A is 100. When comparisons are made between the averages for the two organizations, the number of total efforts in Organization A is 100, while in Organization B, it is 73.24 (see Data item No. 1 in Table 2). In Organization B, review efforts, test efforts and test items are given as 47.56, 54.69 and 57.82, respectively. The values in B are about half of those in A (see Data item Nos. 3, 4, and 8 in Table 2). In a comparison of the total number of defects that are detected, the average for Organization A is 100, but 80.84 for Organization B (see Data item No. 5 in Table 2). Organization B is characterized by the fact that the number of defects detected by review is small, at 63.07, while the number of defects detected by testing is large, at 187.77 (see Data item Nos. 6 and 7 in Table 2).
Both of the organizations promoted defect detection by review in the design process. Organization B detected 1.8 times more defects in testing than Organization A, using about half the number of test items as A. This is considered to be due to there being insufficient defect detection by review. The index that represents this is the defect detection rate by review. When the average defect detection rate by review in Organization A is 100, that in Organization B is 77.61, less than in A (see Data item No. 9 in Table 2).
Based on the above analysis, it became clear that Organization B should reinforce its defect detection during design or code review.
3.2. Quality Assurance Activities Performed by QA Group
Organizations A and B both have QA groups that are independent of the development group. The QA groups
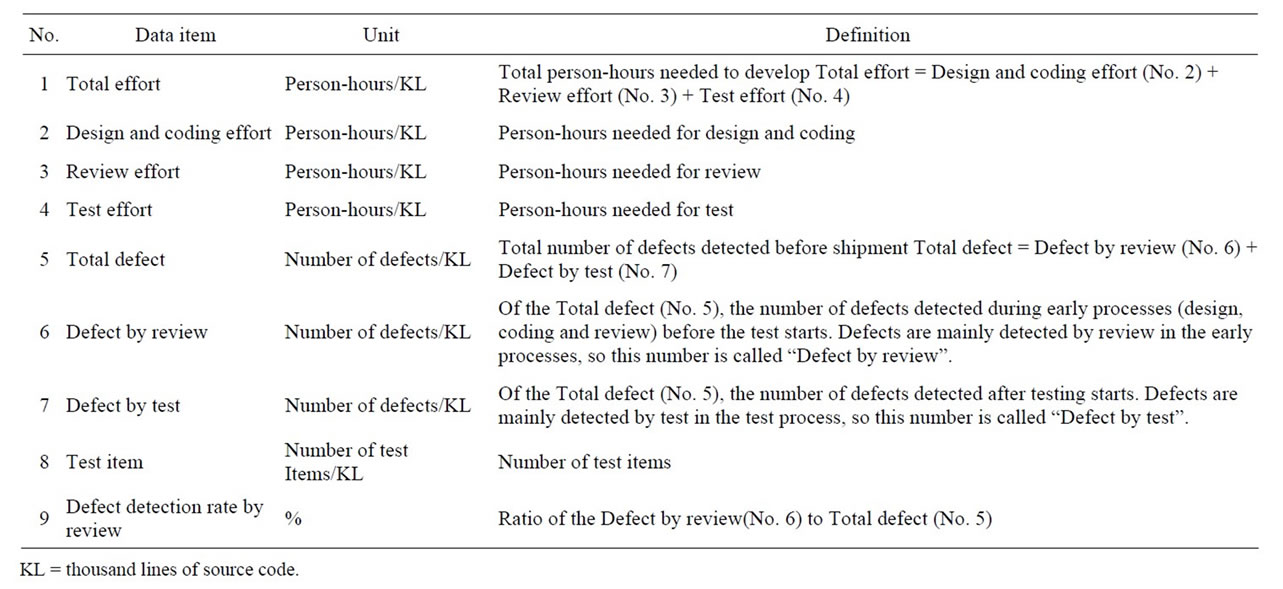
Table 1. Data items.
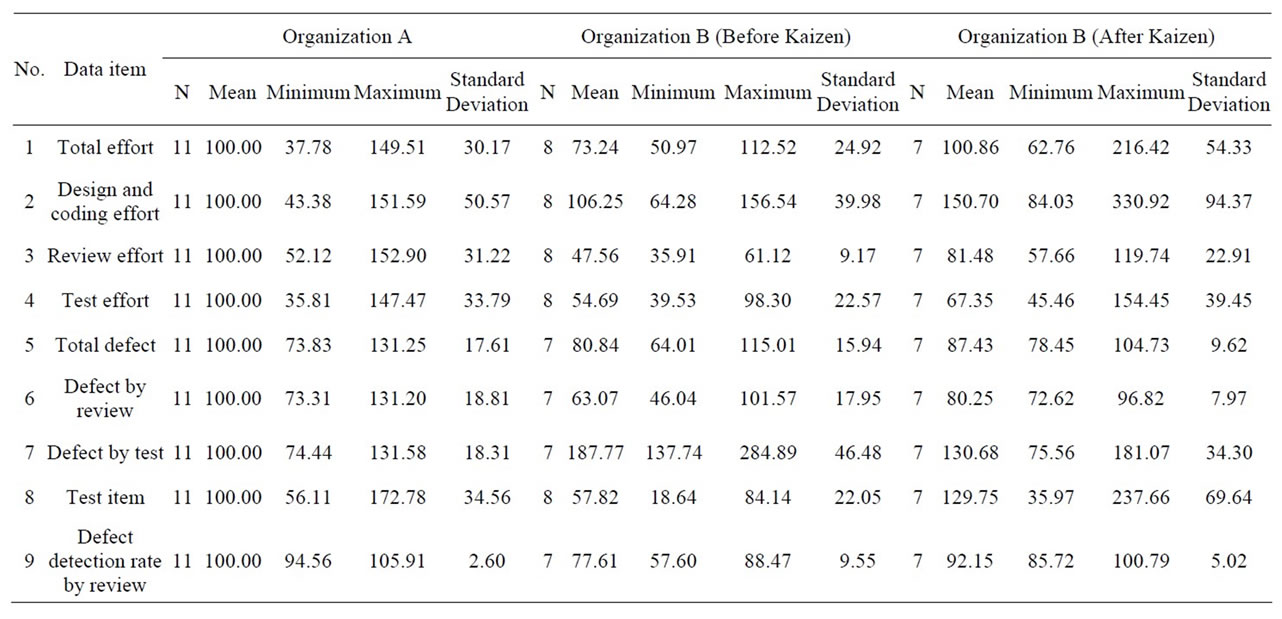
Table 2. Descriptive statistics on the data.
in both organizations monitor quality problems through the start of software development to shipment and urge the development group to take corrective action for any problems as needed. There is a difference, however, in the details of the monitoring and actions in the two organizations.
Organization A checks product quality on a weekly basis, using data obtained in the course of software development, while conducting an evaluation of the final products based on customer perspectives (hereafter, called independent QA testing), which is independent of the testing performed by the development groups. The organization holds a weekly project management meeting that is attended by the managers of the development groups and the QA group. In this meeting, they identify development problems and solve them based on the results of analyzing the data obtained during the course of the development. At the end of the development, they determine whether a final product can be shipped. If independent QA testing reveals a great number of defects with the product, then the product would likely lead to frequent defects once in the hands of a customer, such that it would be classed as unacceptable for shipment and shipments would be delayed. The managers of the QA group and the development groups both have the right to determine whether a product can be shipped.
On the other hand, the QA group in Organization B presents the following points that differ from those of Organization A.
• Organization B does not conduct independent QA testing.
• The QA group of the organization B checks the quality of the product during the course of its development only upon the completion of each process.
• The organization B holds a project management meeting, but the QA group does not participate.
Of the above points, the most significant difference between the two organizations is that independent QA testing is not implemented by B. The purpose of independent QA testing is to actually run the final software product that will be delivered to customers and evaluate it from the customers’ perspectives. Consequently, this test enables us to actually detect any defects in the software that cannot be identified by quality monitoring based on data obtained during the development process.
Based on the results of the above analysis, it was decided that the following Kaizen measures should be implemented to reinforce the QA group’s quality assurance activities.
• Implementation of independent QA testing of the final product;
• QA group’s participation in project management weekly meeting and quality monitoring.
3.3. Quantitative Management Method
Both of the organizations collect the data such as listed in the Table 1. They design projects to be undertaken by several development bases in Japan, China, and other countries with the development being done in a dispersed fashion.
Organization A collects data on products as they are being developed, at each of the dispersed development bases, on a weekly basis. Consequently, the progress of the development and the status of the quality at each dispersed development base can be analyzed based on this data.
On the other hand, Organization B collects and compiles data for the whole project upon the completion of each process. It has no data resolution for each of dispersed development bases. Additionally, it does not collect weekly data for either the design or coding process. For this reason, even if a problem occurs during the design process, noticing that problem may be delayed. Even if the organization identifies the occurrence of a problem, it cannot analyze the data for each dispersed development base because it owns only data of the whole project.
The cost for correcting a defect during software development increases sharply during the later processes such as testing and operation [4]. One important key to the success of a project is to reduce the number of back tracks needed to correct a defect where possible. It is important that an issue to be resolved in the design or coding processes should not be postponed to the testing process. When only data is collected for each process during the design and coding processes, as is done in the case of B, there is a high possibility of overlooking issues to be solved.
Based on the above analysis, it was judged that Kaizen measures should be to collect weekly data at each dispersed development base.
4. Results of Kaizen
4.1. Reduction of Defects after Shipment
Figure 1 (see Organization B after Kaizen) shows the quality of a product after shipment, three years after the start of Kaizen. When we assume that the number of defects after shipment in Organization A is 100, the number in Organization B before Kaizen was 283 but fell to 199 after Kaizen. Although the drop in Organization B was not sufficient to reach the same level as Organization A, the implementation of Kaizen did produce a significant reduction.
4.2. Results of Reinforced Review Activity
The post-Kaizen data for Organization B is listed in Table 2 (see Organization B (after Kaizen)). In Organization B, the number of review efforts was 47.56 before Kaizen, but increased to 81.48 after Kaizen under a review enforcement campaign (see Data item No. 3 in Table 2). With these increased efforts, the number of defects detected by review, which was 63.07 before Kaizen, increased to 80.25 after Kaizen (see Data item No. 6 in Table 2). The number of test items was 57.82 before Kaizen, but increased to 129.75 after Kaizen. In addition, the number of test efforts, which was 54.69 before Kaizen, increased to 67.35 (see Data items Nos. 8 and 4 in Table 2). The number of defects detected by testing, which was 187.77 before Kaizen, fell to 130.68 after Kaizen, but the total number of defects detected increased from 80.84 before Kaizen to 87.43 after Kaizen (see Data items Nos. 7 and 5 in Table 2). According to our analysis, as a result of improving review and testing, most defects were successfully detected by review, with fewer defects remaining in the software at the start of testing. For this reason, improved testing detected fewer defects than before Kaizen.
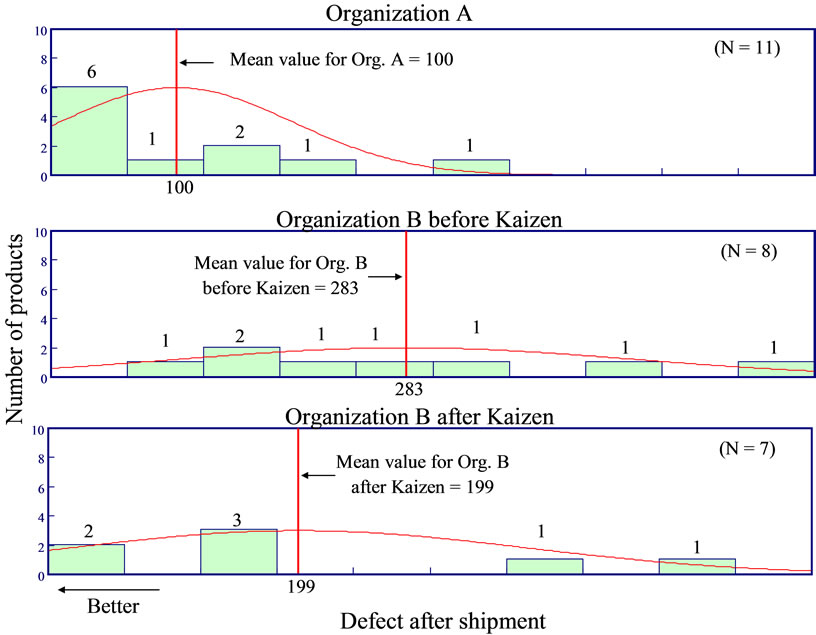
Figure 1. Comparison of the number of defects after shipment.
4.3. Results of Independent QA Testing
Independent QA testing for all developed products was implemented by the QA group. As a result, about 3% of the defects detected by testing (see Data item No. 7 in Table 2) were detected before shipment. With the start of independent QA testing, a degree of defect extraction by the testing was added to the shipment acceptance criteria for revision, such that the shipment of products for which testing has revealed many defects are rejected. For this reason, the development group whose product defect was detected by independent QA testing conducted additional testing for shipment acceptance and detected 1% of the defects detected by testing. Consequently, it can be said that independent QA testing enabled the extraction of 4 % of the defects before shipment, in comparison with the detection rate before Kaizen.
Among others, an important point is that the implementation of independent QA testing enabled the group to reasonably postpone the shipment of a software product that is defective in quality. The analysis of data for a software product under development only points out that the software has a potential quality problem, and does not provide proof that the shipment can be delayed.
5. Discussions
Based on the Kaizen and its results in Organization B, this chapter discusses the software process conditions for developing a software product with few defects after shipment.
5.1. Effect of Reinforced Review on the Number of Defects after Shipment
In general, review is important and an efficient means of ensuring the quality of a software product during its development [5]. As shown in Table 2, the defect detection rate by review in Organization B increased from 77.61 before Kaizen to 92.15 after Kaizen, and came very close to 100 in Organization A (see Data item No. 9 in Table 2). The value for that in organization A is over 80% in absolute value. Organization A has a successful experience that the number of post-release defects was decreased to one twentieth (see Figure 2) by increasing the value of defect detection rate by review (see Figure 3) over twenty years ago.
Organization A started to reinforce review from 1989 and its effects were showed in Figures 2 and 3. Moreover, the increase in the number of defect detection rate by review is considered to have a significant influence on reducing the number of post-release defects in Organization B.
Hence, the increase in the number of defect detection rate by reviews is effective in reducing the number of post-release defects.
5.2. Effect of Quality Assurance Mechanism
An input for quality management is the importance of quality assurance for both the process quality and product one [6]. Organization A monitors the implementation of a development process based on data for a software product that is under development, and performs quality assurance for the final product through independent QA testing.
On the other hand, before Kaizen, Organization B only conducted process quality assurance and lacked any kind of product quality assurance. The adoption of independent QA testing allowed for the functions of product quality assurance. More importantly, due to the fact that independent QA testing actually detected defects in a software product, an excellent understanding about Kaizen
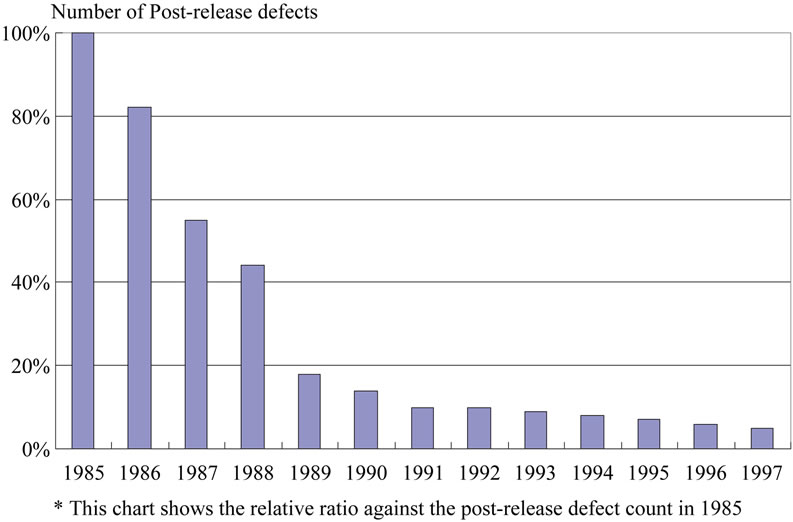
Figure 2. Trend chart showing decrease in post-release defect count in Organization A.
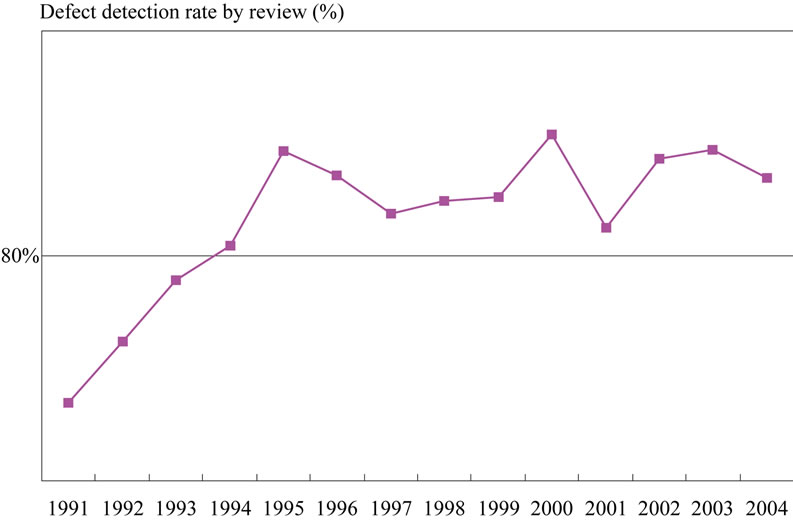
Figure 3. Trend chart showing the improvement of defect detection rate by review in Organization A.
was gained by those engineers who were originally skeptical about the activity. This suggests the importance of demonstrating any issue and must have acted as a spur to instigating the Kaizen activities in Organization B.
These results seem to show that a proper combination of process and product quality assurance methods is a key to the development of a software product with few defects after shipment.
5.3. Effect of Quantitative Management
Twelve Japanese organizations that had accomplished CMMI level 5 were surveyed [7]. According to the results of a questionnaire survey, the greatest advantage of accomplishing this level is the establishment of quantitative management. Based on the results of the survey, quantitative management is considered to be an essential condition for improving the quality of software development.
In Organization B, Kaizen was implemented to collect weekly data from each dispersed development base. This improvement enabled timely and careful analysis and follow-ups during development.
For instance, the organization began to set detailed standard values for the review time and the number of items to be covered by unit testing, and checked the degree to which these are achieved during the software development process. This improvement enabled it to identify the dispersed development base when it has varied from the standard values, and to eliminate the need for follow-up measures that would otherwise be required if any unsatisfied conditions were found after a project. In addition, it allowed the organization to analyze the advantages and disadvantages of each dispersed development base, thereby identifying the characteristics of each base and promoting Kaizen measures appropriate for that base.
Hence, quality improvement demands the collection of data of an appropriate resolution during software development. Since Organization B had attained CMMI level 5, it can be said that it was capable of realizing quantitative management. Consequently, this result suggests that the quality of a software product to be developed depends on the achievement of quantitative management.
6. Conclusions
Focusing on the reduction of defects after shipment, this paper analyzed the application of Kaizen in organizations of the CMMI level 5, to discuss the characteristics of the software process for developing a software product with few defects after shipment. The fact that there is a significant difference in the number of defects after shipment among the CMMI level 5 software processes indicates that a factor not contained in the requirements of the CMMI or an ambiguous factor greatly affects the number of defects after shipment.
According to the findings given in this paper, the following three points should be taken into account when developing a software product with few defects after shipment. All of these points are fundamental to software development.
• Early ensured quality by defect detection during design or code review;
• Quality assurance for both process quality and product one;
• Quantitative management by which data of the appropriate resolution can be collected at an appropriate timing.
There are many organizations that try to improve their software processes to improve the quality of their software products. The points mentioned above for the reduction of defects after shipment are grasped to construct a software process. This can be effective for realizing a reduction in the number of the defects after shipment.
In the future, we will continue to study the software processes needed for the development of high-quality software.
7. Acknowledgements
We would like to express our deep gratitude to Mr. Yamamoto, Operating Officer, NEC Corporation for his great cooperation.
REFERENCES
- W. S. Humphrey, “Winning with Software: An Executive Strategy,” Pearson Education, Inc., New Jersey, 2002.
- N. Honda, “Beyond CMMI Level 5—Comparative Analysis of Two CMMI Level 5 Organizations,” Software Quality Professional, Vol. 11, No. 4, 2009, pp. 4- 12.
- N. Honda, “Software Quality Accounting—Quality Assurance Technology That Supports High Quality Software Development at NEC,” JUSE Press, Tokyo, 2010.
- B. Boehm, “Software Engineering Economics,” PrenticeHall, Englewood Cliffs, 1981.
- T. Gilb and D. Graham, “Software Inspection,” AddisonWesley, Reading, 1993.
- SQuBOK Study Team, “SQuBOK Guide—Software Quality Body of Knowledge (in Japanese),” Ohmsya, Tokyo, 1997.
- JUSE, “Research Report for CMMI Level 5 Organizations,” Tokyo, 2009. http://www.juse.or.jp/software/86/attachs/kikaku_1.pdf