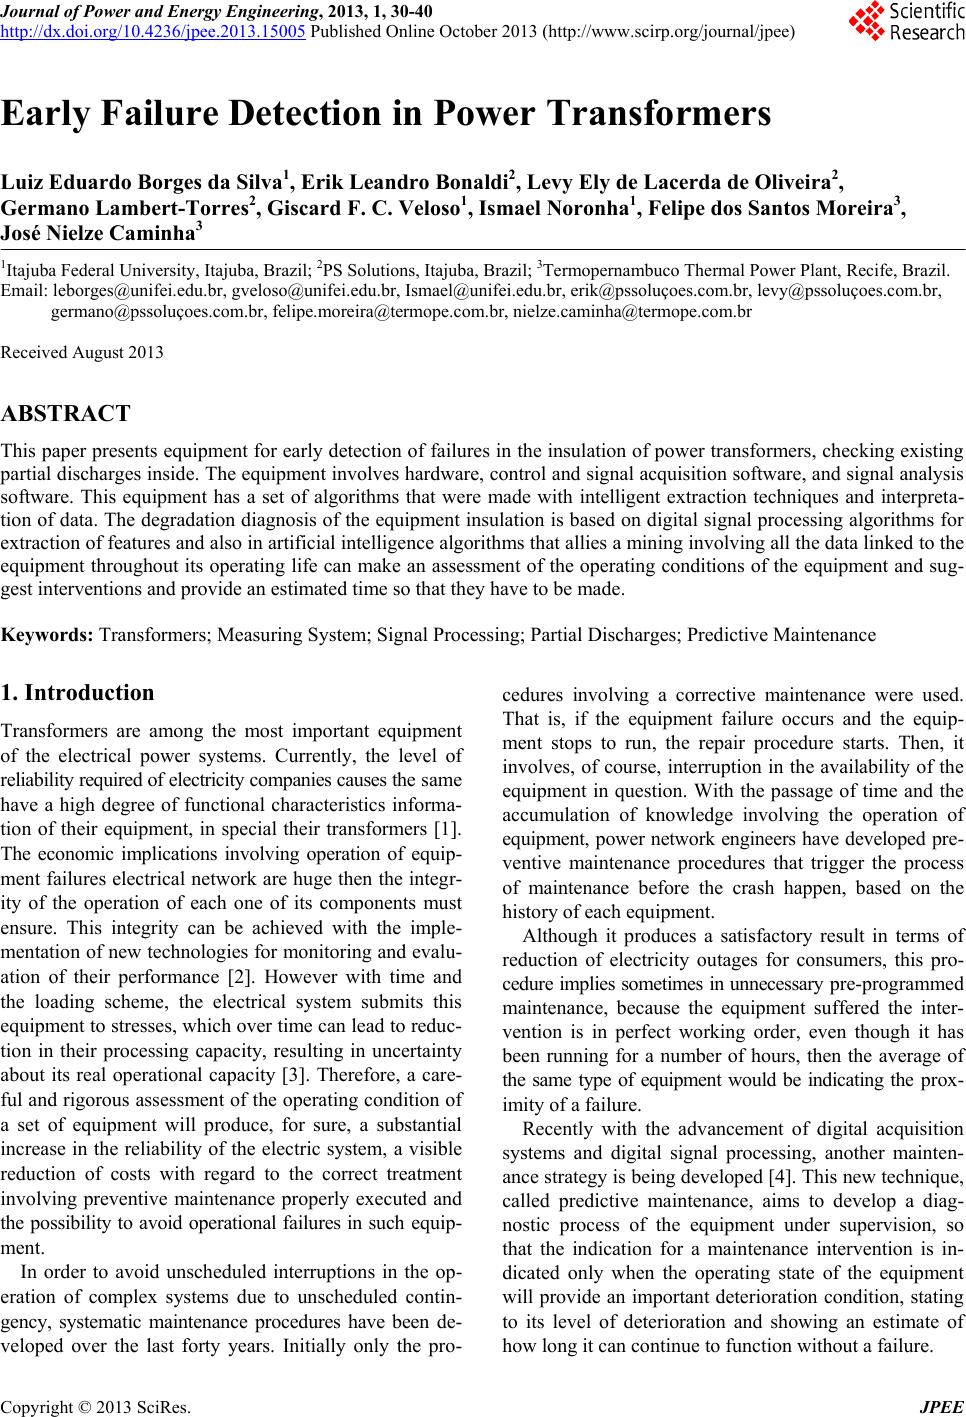
 Journal of Power and Energy Engineering, 2013, 1, 30-40 http://dx.doi.org/10.4236/jpee.2013.15005 Published Online October 2013 (http://www.scirp.org/journal/jpee) Copyright © 2013 SciRes. JPEE Early Failure Detection i n Power Transformers Luiz Eduardo Borges da Silva1, Erik Leandro Bonaldi2, Levy Ely de Lacerda de Oliveira2, Germano Lambert-Torres2, Giscard F. C. Veloso 1, Ismael Noronha1, Felipe dos Santos Moreira3, José Nielze Caminha3 1Itajuba Federal University, Itajuba, Brazil; 2PS Solutions, Itajuba, Brazil; 3Termopernambuco Thermal Power Plant, Recife, Brazil. Email: leborges@unifei.edu.br, gveloso@unifei.edu.br, Ismael@unifei.edu.br, erik@pssoluçoes.com.br, levy@pssoluçoes.com.br, germano@pssoluçoes.com.br, felipe.moreira@termope.com.br, nielze.caminha@termope.com.br Received August 2013 ABSTRACT This paper presents equipment for early detection of failures in the insulation of power transformers, checking existing partial discharges inside. The equipment involves hardware, control and signal acquisition software, and signal analysis software. This equipment has a set of algorithms that were made with intelligent extraction techniques and interpreta- tion of data. The degradation diagnosis of the equipment insulation is based on digital signal processing algorithms for extraction of features and also in artificial intelligence algorithms that allies a mining involving all the data linked to the equipment throughout its operating life can make an assessment of the operating conditions of the equipment and sug- gest interventions and provide an estimated time so that they have to be made. Keywords: Transformers; Measuring System; Signal Processing; Partial Discharges; Predictive Maintenance 1. Introduction Transformers are among the most important equipment of the electrical power systems. Currently, the level of reliability required of electricity companies causes the same have a high degree of functional characteristics informa- tion of their equipment, in special their transformers [1]. The economic implications involving operation of equip- ment failures electrical network ar e huge then the integr- ity of the operation of each one of its components must ensure. This integrity can be achieved with the imple- mentation of new technologies for monitoring and evalu- ation of their performance [2]. However with time and the loading scheme, the electrical system submits this equipment to stresses, which over time can lead to reduc- tion in their processing capacity, resulting in uncertainty about its real operational capacity [3]. Therefore, a care- ful and rigorous as sessment of the operating condition of a set of equipment will produce, for sure, a substantial increase in the reliability of the electric system, a visible reduction of costs with regard to the correct treatment involving preventive maintenance properly executed and the possibility to avoid operational failures in such equip- ment. In order to avoid unscheduled interruptions in the op- eration of complex systems due to unscheduled contin- gency, systematic maintenance procedures have been de- veloped over the last forty years. Initially only the pro- cedures involving a corrective maintenance were used. That is, if the equipment failure occurs and the equip- ment stops to run, the repair procedure starts. Then, it involves, of course, interruption in the availability of the equipment in question. With the passage of time and the accumulation of knowledge involving the operation of equipment, power network engineers have developed pre- ventive maintenance procedures that trigger the process of maintenance before the crash happen, based on the history of each equipment. Although it produces a satisfactory result in terms of reduction of electricity outages for consumers, this pro- cedure implies somet imes in unneces sary pre-programmed maintenance, because the equipment suffered the inter- vention is in perfect working order, even though it has been running for a number of hours, then the average of the same type of equipment would be indicating the prox- imity of a failure. Recently with the advancement of digital acquisition systems and digital signal processing, another mainten- ance strategy is being developed [4]. This new technique, called predictive maintenance, aims to develop a diag- nostic process of the equipment under supervision, so that the indication for a maintenance intervention is in- dicated only when the operating state of the equipment will provide an important deterioration condition, stating to its level of deterioration and showing an estimate of how long it can continue to function without a failure.  Early Failure Detection in Power Transformers Copyright © 2013 SciRes. JPEE This paper treats exactly of this type of maintenance for transformers. The proposed methodology uses partial discharges signals occurred inside of the transformers. The use of partial discharges is one of the types of failure that deserves mention because it contains much informa- tion about inside problems in transformers. The partial discharges are failures which are developed silently, and able to produce an unexpected interruption in the trans- former. The partial discharge phenomenon is a problem in the insulation system, which manifests itself through tiny elec- tric arcs within the dielectric material, causing its degra- dation to culminate in the complete failure and possible destruction of the equipment. The activity of partial dis- charges in transformers must be monitored in order to follow the evolution of this problem to plan an interven- tion before a catastrophic failure occurs. Therefore, a care- ful and rigorous assessment of the operating c ondition of the transformers produces a substantial increase of its reliability, a visible reduction of costs with regard to the correct treatment involving preventive properly executed and the possibility of to avoid operational failures of the equipment. In this way, a device that detects internal defects early, allows the maintenance activities may be planned to mi- tigate these interruptions. This planning can be inserted within the culture of predictive maintenance and aims to develop a diagnostic process of the equipment under su- pervision, so that the indication for a maintenance inter- vention is indicated only when the operating state of the equipment provides an important deterioration of condi- tion. Their continued use creates parameters on the level of deterioration in which the same lies and presents a forecast of how long it can continue to function without widespread failure will happen. As the process of partial discharge s appears initially as a one-off failure, sometimes with micro scop ic d imen sions, can occur in any point of isolation and evolve to com- promise it entirely. As partial discharges which occur in the interior of the windings represent an important point of information on their conditions of aging and deteriora- tion, the proposed device is useful for any company with transformers. The proposed evaluation methodology of transformer operational conditions has been implemented in a proper designed data acquisition system to do a sampling of the variables involved in the process of deterioration of the observed equipment. The developed system is based on the digital signal processing of the information contained in the electrical variables involving the operation of the transformer, es- pecially information directly obtained from the current flowing through the windings of the transformer. Wave- let transform was the chosen digital technique due to its quality to extract information inside of the innumerous other signals contained in the current. On the basis of information extracted specifically currents of the trans- former, with the use of Rogowski coil type sensors, ex- pects to be able to infer about the operating conditions of the equipment insulation. This is possible to expect be- cause the standard involving the behavior of partial dis- charges monitored presents a strong degree of correlation with the deterioration of th e conditions of the isolation of the same. In this way, through the information contained in the acquired signals, extracted after an adequate digital signal processing, it is possible to obtain an assessment of the state of the windings of the observed equipment. 2. Insulation Degradation by Partial Discharges The normal or accelerated aging of insulation deteriora- tion caused by partial discharges and oil contamination cause changes in the dynamic characteristics of the sys- tem formed by the metal structure of the transformer and its isolation. Considering the fact that partial discharges are caused by non-homogeneity in isolation, contamina- tion and overloading, the electrical signals of partial dis- charges obtained this process may prove, through an analysis of their distribution in the phase of the voltage signal and its waveform, those features that are related to the problems which want to diagnose. So, establishing a chronology of measurements, the evolution of these prob- lems can be modeled and forecasted a possible disrupting of insulation, preventing this from happening through appropriate intervention. A partial discharge is an electric pulse or electric dis- charge that occurs inside an insulating material under an electric field. This pulse or discharge only partially closes the circuit between the isolated conductive parts, hence, the name, partial discharge. The partial discharges can be generated by various types of mechanisms. In general, it occurs due to a rapid change in the configuration of the electric field due to some kind of internal electrical activ- ity in to the presence of contaminants or particles. This change leads to the appearance of an electric current flowing in a conductor connected to the exterior of the apparatus, being the effect most common and most ex- ploited for parti a l discharge measure ments. Power transformers are among the more expensive equipment of the electrical system. So they are also made and maintained to be most reliable equipment, which is essential to the operation of the entire system. Proof of this is the presence of power transformers with more than 30 years ago are still in operation. However, this reputa- tion is maintained at the cost of maintenance of excel- lence, which includes strict monitoring of their condi- tions. This is absolutely necessary, because the transfor- mers are strategic parts of the electrical system and fail-  Early Failure Detection in Power Transformers Copyright © 2013 SciRes. JPEE ures in their operation can cause huge problems such as power interruption to larg e populations and for important productive sectors. Their catastrophic destruction can cause damage to other equipment, injuries in employees of elec- tric utilit ies, en v iro n menta l po llu tion wi th to xic substances leading to fines and penalties due to environmental leg- islation. All these problems represent high costs that can be avoided with a proper maintenance based on condition monitoring. In this context, the transformer insulation system is a critical aspect of this monitoring. Large power transformers are isolated with oil, paper and porcelain (bushings). The oil, in general, does not have a very high degree of purity, leading to partial dis- charges generation mechanisms associated with impuri- ties su ch as gas bubbles (wells) and solid particles (coro- na in liquids). On paper, the presence of insulating cavities is the main cause of partial discharges, and deterioration by the presence of moisture and even by the partial dis- charge activity action, tends to decrease its dielectric properties. Thus, not only the aging of the insulation system components contributes to the activity of partial discharge in transformers, but also oversights in the con- struction or operation of the equipment may cause dam- age, as the oil contamination leading to an increase in the intensity of discharges and the reduction of their working life. Therefore, knowing how the partial discharges manif- est themselves not only in a specific point, but in many points inside the transformer, and knowing its behavior over time, it is possible to infer about the state of the monitored transformer, and even to anticipate potential failures, which represent a great savings in maintenance costs. In general, depending on how the partial discharge is manifesting, it can be inferred not only the seriousness of the problem and its possible causes. Partial discharges occur predominantly in the first and third quarters of the voltage cycle, as shown in Figure 1 (pulses are exagger- ated in the figure). In these quarters, the voltage value growth occurs. The electric system formed by conductors and insulation acts as a capacitor being loaded up to the point at which partial discharges begin to appear. They Figure 1. Occurrence of partial discharges in the cycle. can be measured as voltage pu lses of high frequency and low intensity. In the first quarter of the voltage, the dis- charge cycle results in a negative pulse (or downward). This is called the partial discharge of negative polarity. In the third quarter of the cycle, the partial discharge re- sults in a pulse-driven upwards, or positive, being called a partial discharge of positive polarity. These pulses are on the order of from millivolts to some units of volts. Although appearing in Figure 1 as a pulse for each quar- ter of a cycle, in fact they appear in large quantities, be- ing your score within a cycle of rooms measured pa- rameters. In general, a partial discharge has duration of no more than one or two nanoseconds. However, the signal de- tected outside of the equipment under test depends on the nature of the connection between the point where the partial discharge and the exterior. In good condition (case of coaxial cables insulated with SF6), there are very few losses (due to its good response at high frequencies), the signal detected abroad be preserved almost intact, as will suffer little attenuation or scattering. But there are cases where there are major changes in the shape of the wrist due to huge losses at high frequencies and due to the complexity of the connection between the places where the partial discharge and the outer, intrinsic detection to each type of equipment under test. 3. Discrete Wav e let Transform The discrete wavelet transform is a form of expansion. The main difference for most expansions is in the organ- ization of their coefficients, which vary depending on two parameters instead of just one as in Fourier series. The functions that form the Foundation are the wavelet calls that can be arranged to form orthogonal sets. The discrete wavelet transform coefficients are arranged at different levels, which represent the different resolutions, or scales, and are given as a function of time. The ob- taining of these coefficients can be interpreted through correlation between the sign and the functions of the base, reinforcing the concept of multi-resolution [5]. Wavelets are waveforms of a limited duration, average value equal to zero and unit standard. These waveforms have concentrated their energy on time, which gives an ability to use in expansion systems for non-stationary analysis, i.e. for analysis where the signal is non-statio- nary or non-stationary components has (transient) [6]. The use of wavelets as expansion set is what is usually called Wavelet System. This expansion set is not unique, as is the case of the Fourier series expansion, for example, which is formed only by complex exponentials. In fact, there are many different Wavelet systems, and their co m- mon features are: a) Can form a set of “building blocks”: this set can be used to construct or represe nt s igns and f unc tions;  Early Failure Detection in Power Transformers Copyright © 2013 SciRes. JPEE b) By providing a location and time signal frequency, the wavelet expansion represents the largest part of the energy of the signal with few coefficients; c) The calculation of the coefficients of the expansion is done efficiently; d) The wavelet systems or different wavelet families have waveforms that balance in a relationship between how the functions are compactly located in time or in space (duratio n) and how soft they are; e) Multi-resolution; f) The value of the coefficients of the expansion quickly decays to zero; g) Ability to perform a more accurate location descrip- tion and a separation of signal characteristics; the wave- let expansion coefficients represent the correlation be- tween the signal stretch and the wavelet; “stretch” be- cause the wavelet is a wave of limited support (limited duration), thus, the coefficients represent components that are per se; h) The possibility to define wavelet syste ms “persona- lized” for specific applications. There is a line of research that studies the characteris- tics and wavelet system develops. In the present study, existing systems are used, as for example the Daubechies wavelet family. A generic form, the wavelet expansion can be written throug h as follows: (1) However, as one of the characteristics of wavelet is to have an own unitary standard, it means a unitary energy, therefore the analysis expression becomes: (2) The coefficients vary with two parameters: the time shift k, and range j, unlike, for example, Fourier series, where the coefficients vary just w ith the frequencies. For each scale, there is a set of coefficients vary in time. The expansion is made up of “versions” of the moth- er-wavelets scaled and displaced in time. This means that there is a waveform with a format determined by the characteristics of the wavelet (the mother wavelet) and the entire expansion is created from it, varying its posi- tion in time or space (independent variable) and varying its range, i.e. “stretching” or “shrinking” the waveform. The scale is a parameter inversely proportional to fre- quency. 4. Presentation of the Proposed Device The system consists basically of current transd ucers with adequate pas s band, based on the techno logy of Rogows- ki coil, a signal conditioning circuit to adjust the signal measured data acquisition circuit, an analog/digital con- version circuit for high speed and resolution, a computer to the digital processing and storage of electrical variables and measures a smart program data consolidation, evalu- ation and diagnosis of the operating condition of the equipment. A signal processing technique that has brought important results in the detection of partial discharges is a technique called Wavelet Transform, which is used in this development [7]. This type of transform was also implemented in the process of breakdown of fundamental characteristics related to th e cond itio ns of the transformer insulation. The development makes an analysis of the characteris- tic of current signal involving the partial discharges cir- culating by the equipment housing, being measured in a specific point on the connection with the earth. 4.1. Detection of Partial Discharges Using Rogowski Coil A technique that takes advantage of the enormous possi- bilities of Rogowski effect sensor and the processing power of the discrete wavelet transform for detection of partial discharge in transformers is described. The partial discharge pulses are generated in high fre- quencies, but depending on the circuit that range from the inside of the transformer to the point where it is de- tected, may suffer several mitigations, which significant- ly changes its waveform and, especially, their range con- siderably, reducing it, causing pulses with small ampli- tude. And more, to small amplitude pulse problem, the noise problem also must be added. At a substation, there are several sources of noise such as radio waves, electrostatic discharge, coronas, lightning, in addition to the thermal noise. The signal acquisition equipment itself for having high bandwidth for signs of partial discharges also con- tributes to contamination with white noise. So, a simple visual analysis of a signal collected, for example, a tran s- former grounding terminal, may not reveal anything re- lated to par tial discharges. It is essentia l, therefore, a more accurate analysis using digital signal processing tech- niques. Taking into account the transformer ground terminals, as one of the paths through which pulses of partial dis- charges in the form of electric current, its detection could be monitoring these sites. For this, the chosen sensor, besides being able to detect high frequency currents, must also provide a good electrical insulation. The ideal device for this task is in fact Rogowski coil. 4.2. Rogowski Coil Composition As shown in Figure 2, Rogowski coil shall consist of a circular plastic mould with a mounted in such a way as to have a density of turns evenly distributed. The cross sec- 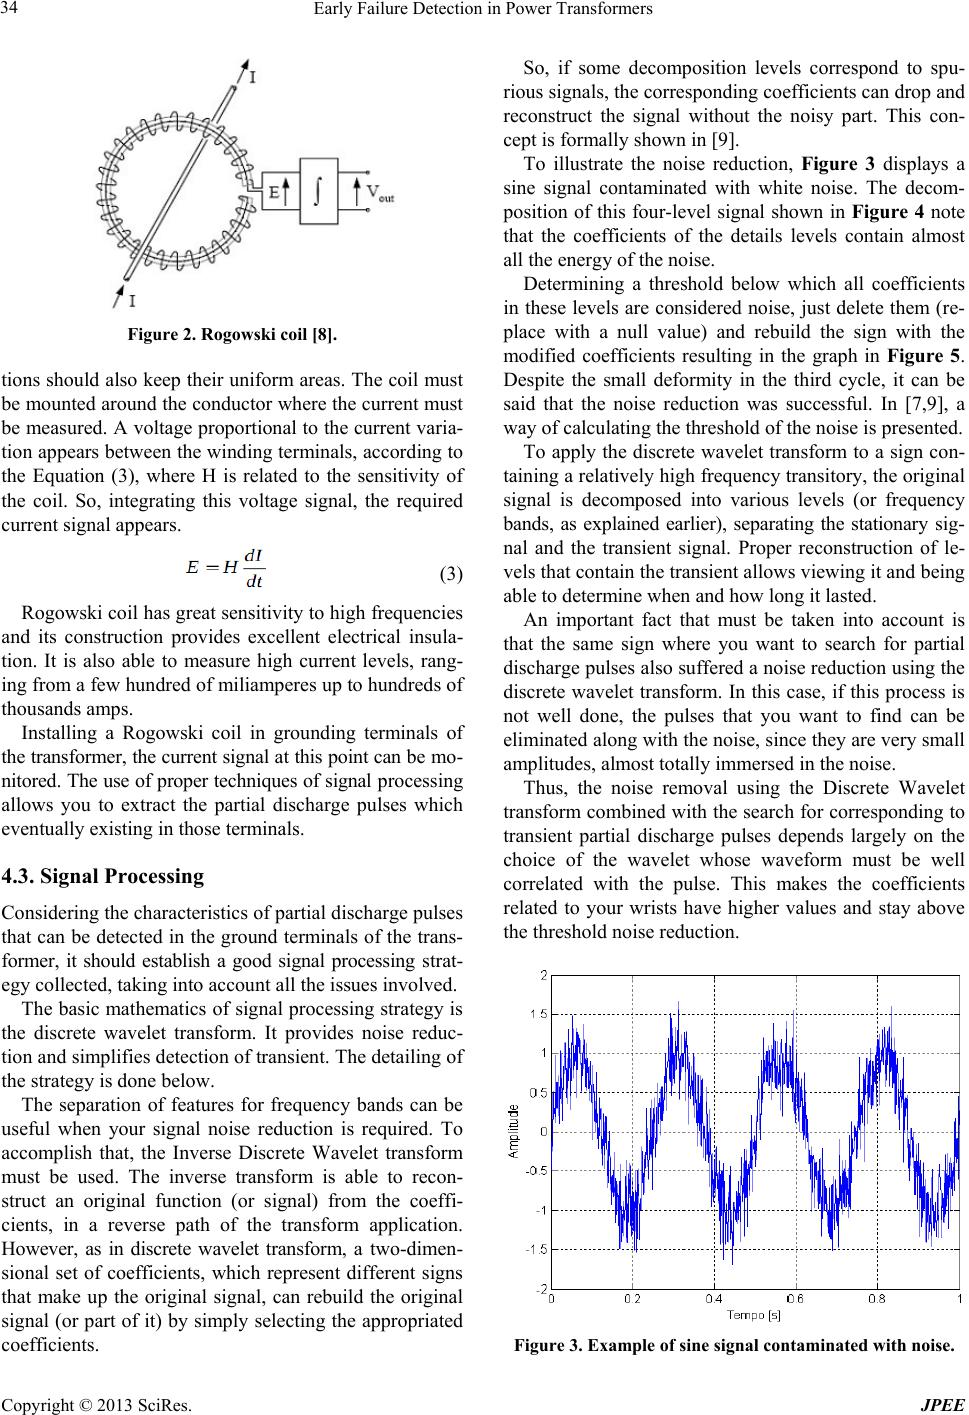 Early Failure Detection in Power Transformers Copyright © 2013 SciRes. JPEE Figure 2. Rogowski coil [8]. tions should also keep their uniform areas. The coil must be mounted around the conductor where the current must be measured. A voltage proportional to the current varia- tion appears between the winding terminals, according to the Equation (3), where H is related to the sensitivity of the coil. So, integrating this voltage signal, the required current signal appears. (3) Rogowski coil has great sensitivity to high frequencies and its construction provides excellent electrical insula- tion. It is also able to measure high current levels, rang- ing from a few hundred of miliamperes up to hundreds of thousands amps. Installing a Rogowski coil in grounding terminals of the transformer, the current signal at this point can be mo- nitored. The use of proper techniques of signal processing allows you to extract the partial discharge pulses which eventually existing in those terminals. 4.3. Signal Processing Considering the characteristics of partial discharge pulses that can be detected in the ground terminals of the trans- former, it should establish a good signal processing strat- egy collected, taking into account all the issues involved. The basic mathematics of signal processing strategy is the discrete wavelet transform. It provides noise reduc- tion and simplifies detection of transient. The detailing of the strategy is done below. The separation of features for frequency bands can be useful when your signal noise reduction is required. To accomplish that, the Inverse Discrete Wavelet transform must be used. The inverse transform is able to recon- struct an original function (or signal) from the coeffi- cients, in a reverse path of the transform application. However, as in discrete wavelet transform, a two-dimen- sional set of coefficients, which represent different signs that make up the original signal, can rebuild the original signal (or part of it) by simply selecting the appropriated coefficients. So, if some decomposition levels correspond to spu- rious signals, the corresponding coefficients can drop and reconstruct the signal without the noisy part. This con- cept is formally shown in [9]. To illustrate the noise reduction, Figure 3 displays a sine signal contaminated with white noise. The decom- position of this four-level signal shown in Figure 4 note that the coefficients of the details levels contain almost all the energy of the noise. Determining a threshold below which all coefficients in these levels are considered noise, just delete them (re- place with a null value) and rebuild the sign with the modified coefficients resulting in the graph in Figure 5. Despite the small deformity in the third cycle, it can be said that the noise reduction was successful. In [7,9], a way of calculating the threshold of the noise is presented. To apply the discrete wavelet transform to a sign con- taining a relatively high frequency transitory, the orig inal signal is decomposed into various levels (or frequency bands, as explained earlier), separating the stationary sig- nal and the transient signal. Proper reconstruction of le- vels that contain the trans ient allows viewing it and being able to determine when and how long it lasted. An important fact that must be taken into account is that the same sign where you want to search for partial discharge pulses also suffered a noise reduction using the discrete wavelet transform. In this case, if this process is not well done, the pulses that you want to find can be eliminated along with the noise, since they are very small amplitudes, almost totally immersed in the noise. Thus, the noise removal using the Discrete Wavelet transform combined with the search for corresponding to transient partial discharge pulses depends largely on the choice of the wavelet whose waveform must be well correlated with the pulse. This makes the coefficients related to your wrists have higher values and stay above the threshold noise reduction. Figure 3. Example of sine signal contaminated with noise. 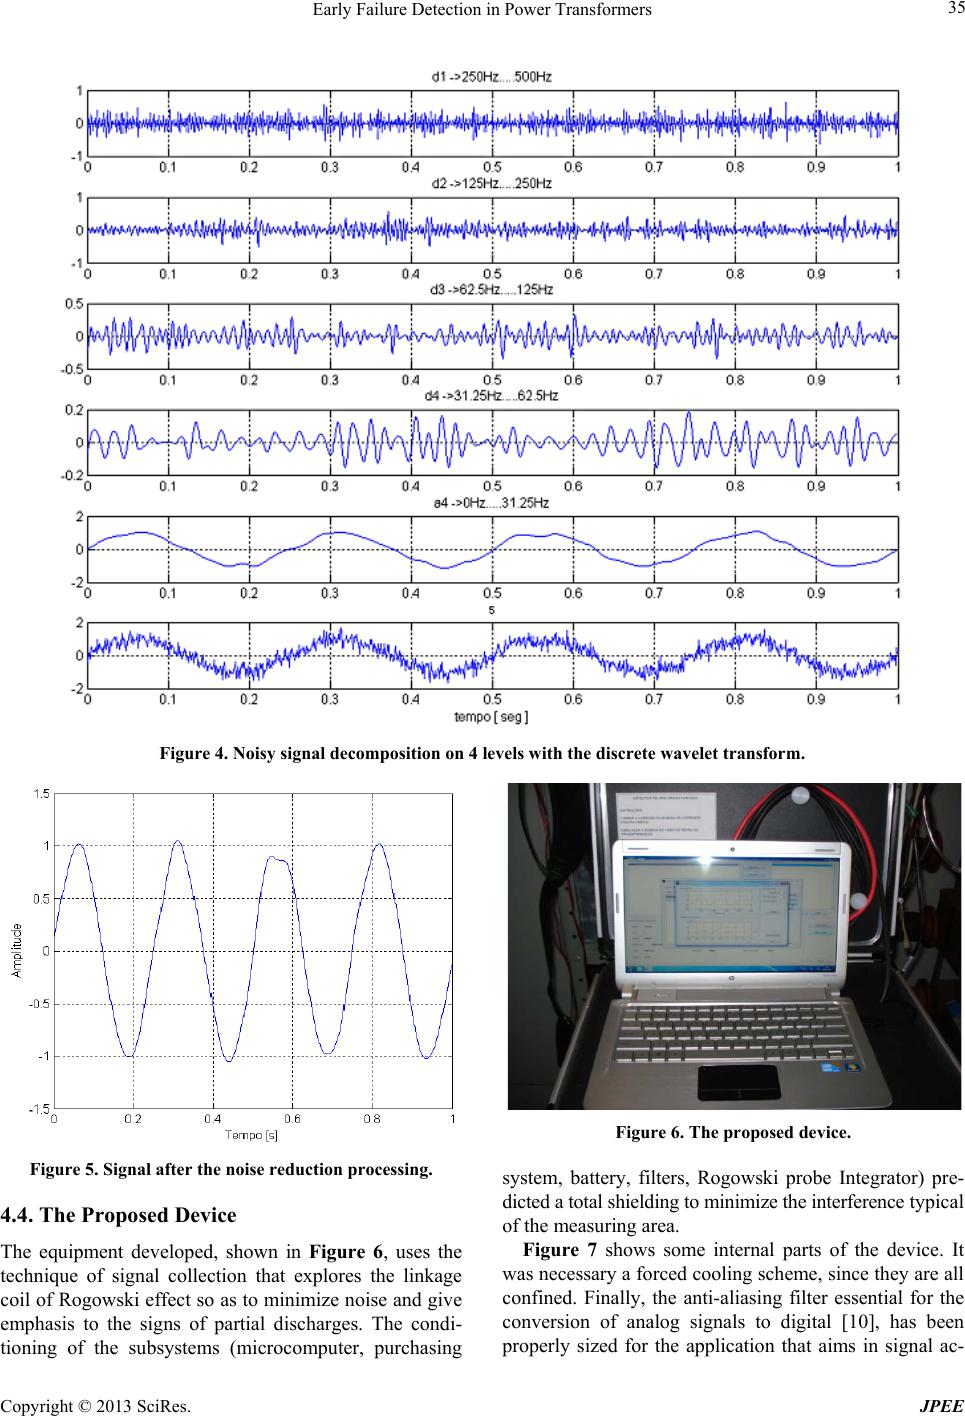 Early Failure Detection in Power Transformers Copyright © 2013 SciRes. JPEE Figure 4. Noisy signal decomposition on 4 levels with the discrete wavelet transform. Figure 5. Signal after the noise reduction processing. 4.4. The Proposed Device The equipment developed, shown in Figure 6, uses the technique of signal collection that explores the linkage coil of Rogowski effect so as to minimize noise and give emphasis to the signs of partial discharges. The condi- tioning of the subsystems (microcomputer, purchasing Figure 6. The proposed device. system, battery, filters, Rogowski probe Integrator) pre- dicted a total shielding to minimize the interference typical of the measuring area. Figure 7 shows some internal parts of the device. It was necessary a forced cooling scheme, since they are all confined. Finally, the anti-aliasing filter essential for the conversion of analog signals to digital [10], has been properly sized for the application that aims in signal ac- 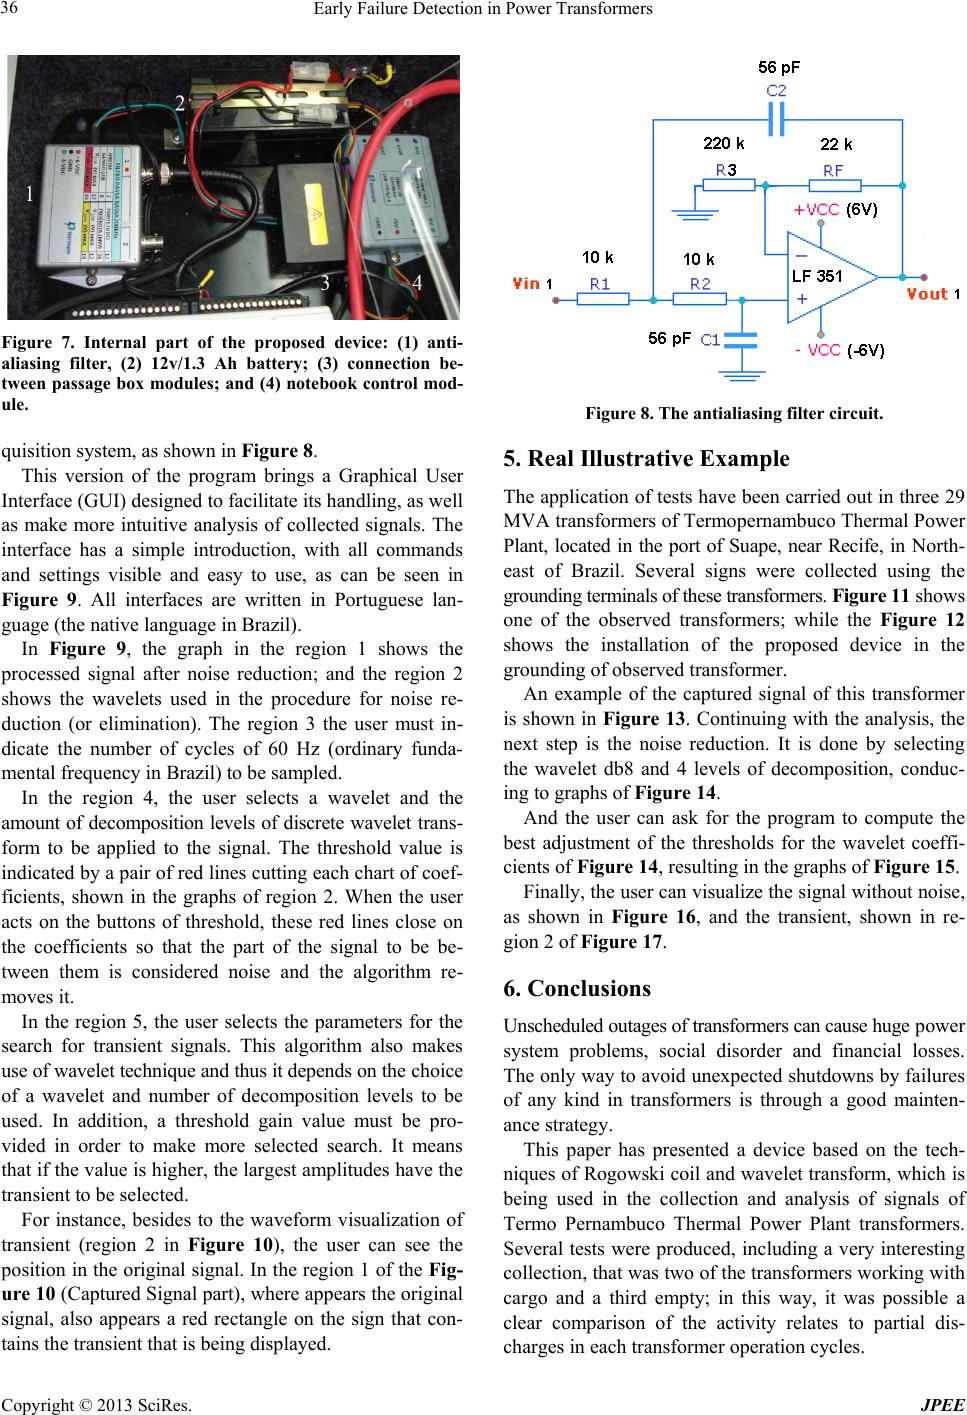 Early Failure Detection in Power Transformers Copyright © 2013 SciRes. JPEE Figure 7. Internal part of the proposed device: (1) anti- aliasing filter, (2) 12v/1.3 Ah battery; (3) connection be- tween passage box modules; and (4) notebook control mod- ule. quisition system, as shown in Fi gure 8 . This version of the program brings a Graphical User Interface (GUI) design ed to facilitate its handling, as well as make more intuitive analysis of collected signals. The interface has a simple introduction, with all commands and settings visible and easy to use, as can be seen in Figure 9. All interfaces are written in Portuguese lan- guage (the native language in Brazil). In Figure 9, the graph in the region 1 shows the processed signal after noise reduction; and the region 2 shows the wavelets used in the procedure for noise re- duction (or elimination). The region 3 the user must in- dicate the number of cycles of 60 Hz (ordinary funda- mental frequency in Brazil) to be sampled. In the region 4, the user selects a wavelet and the amount of decomposition levels of discrete wavelet trans- form to be applied to the signal. The threshold value is indicated by a pair of red lines cutting each chart of coef- ficients, shown in the graphs of region 2. When the user acts on the buttons of threshold, these red lines close on the coefficients so that the part of the signal to be be- tween them is considered noise and the algorithm re- moves it. In the region 5, the user selects the parameters for the search for transient signals. This algorithm also makes use of wavelet technique and thus it depends on the choice of a wavelet and number of decomposition levels to be used. In addition, a threshold gain value must be pro- vided in order to make more selected search. It means that if the value is higher, the largest amplitudes have the transient to be selected. For instance, besides to the waveform visualization of transient (region 2 in Figure 10), the user can see the position in the original signal. In the region 1 of the Fig- ure 10 (Captured Signal part), where appears the original signal, also appears a red rectangle on the sign that con- tains the transient that is being displayed. Figure 8. The antialiasing filter circuit. 5. Real Illustrative Example The application of tests have been carried out in three 29 MVA transformers of Termopernambuco Thermal Power Plant, located in the port of Suape, near Recife, in North- east of Brazil. Several signs were collected using the grounding terminals of t hese transform ers. Figure 11 shows one of the observed transformers; while the Figure 12 shows the installation of the proposed device in the grounding of observed transformer. An example of the captured signal of this transformer is shown in Figure 13. Continuing with the analysis, the next step is the noise reduction. It is done by selecting the wavelet db8 and 4 levels of decomposition, conduc- ing to gra p hs of Figure 14. And the user can ask for the program to compute the best adjustment of the thresholds for the wavelet coeffi- cients of Figure 14, resulti ng i n the g ra phs of Figure 15. Finally, the user can visualize the signal without noise, as shown in Figure 16, and the transient, shown in re- gion 2 of Figure 17. 6. Conclusions Unscheduled outages of transformers can cause huge power system problems, social disorder and financial losses. The only way to avoid unexpected shutdowns by failures of any kind in transformers is through a good mainten- ance strategy. This paper has presented a device based on the tech- niques of Rogowski coil and wavelet transform, which is being used in the collection and analysis of signals of Termo Pernambuco Thermal Power Plant transformers. Several tests were produced, including a very interesting collection, that was two of the transformers working with cargo and a third empty; in this way, it was possible a clear comparison of the activity relates to partial dis- charges in each transformer operation cycles. 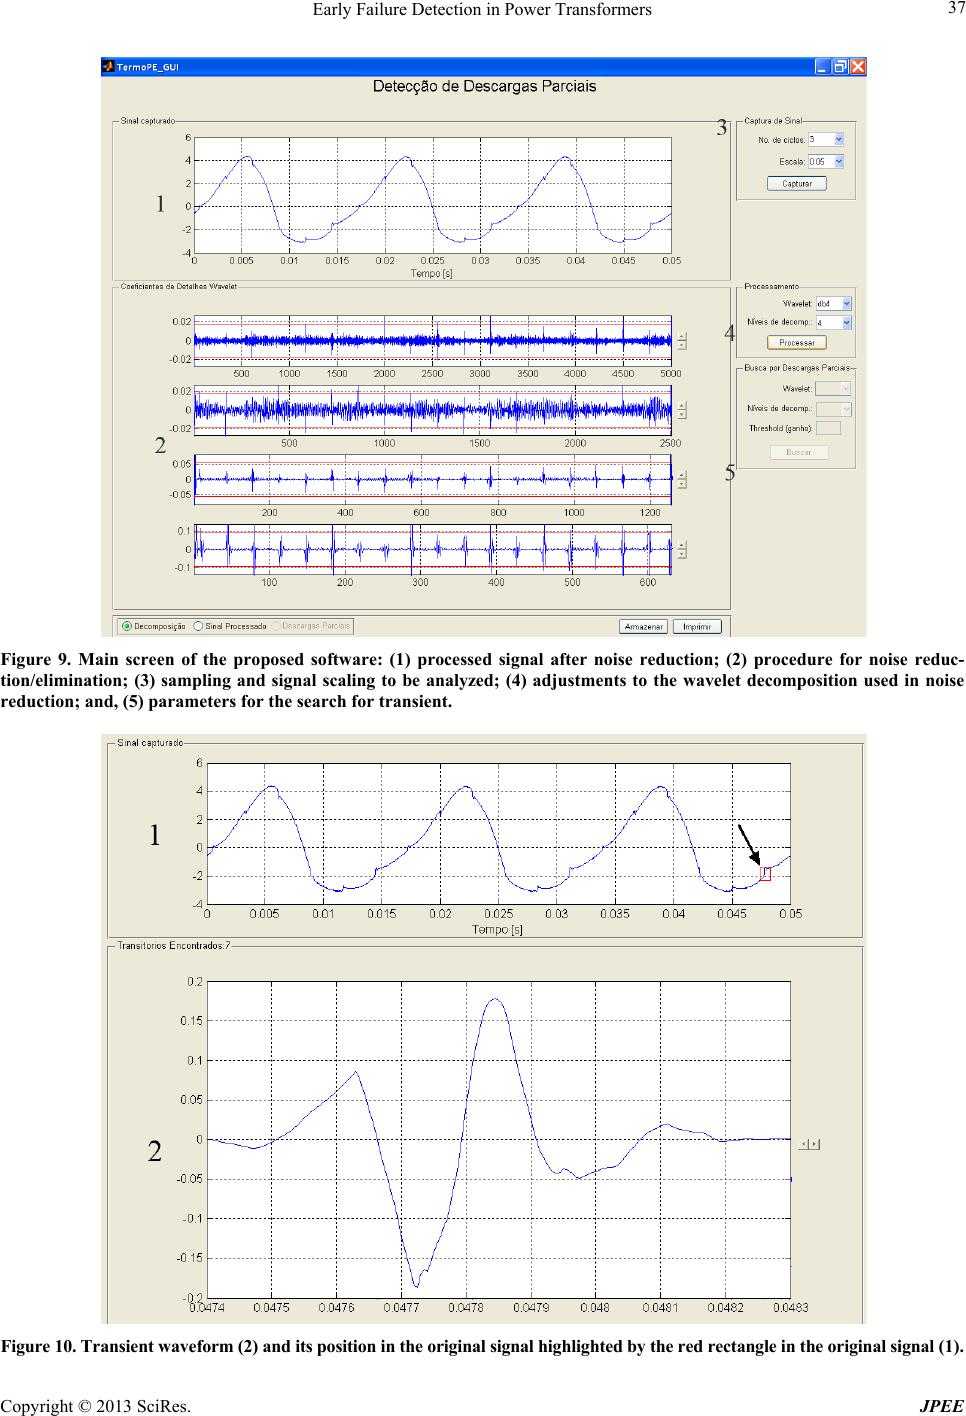 Early Failure Detection in Power Transformers Copyright © 2013 SciRes. JPEE Figure 9. Main screen of the proposed software: (1) processed signal after noise reduction; (2) procedure for noise reduc- tion/elimination; (3) sampling and signal scaling to be analyzed; (4) adjustments to the wavelet decomposition used in noise reduction; and, (5) parameters for the search for transient. Figure 10. Transient waveform (2) and its position in the original signal highlighted by the red rectangle in the original signal (1). 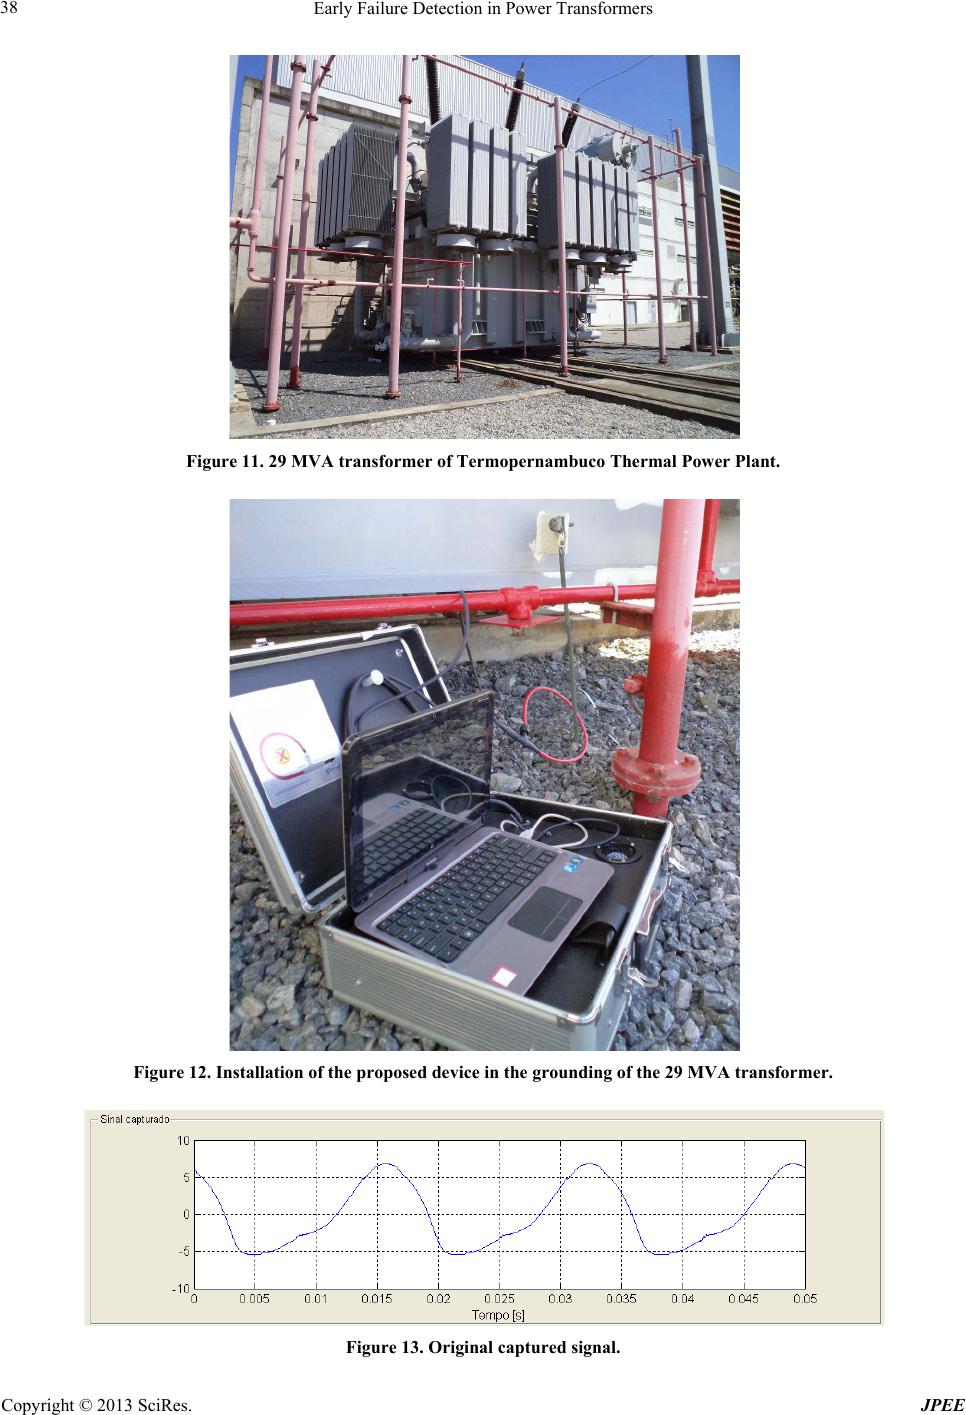 Early Failure Detection in Power Transformers Copyright © 2013 SciRes. JPEE Figure 11. 29 MVA transformer of Termopernambuco Thermal Power Plant. Figure 12. Installation of the proposed device in the grounding of the 29 MVA transformer. Figure 13. Original captured signal. 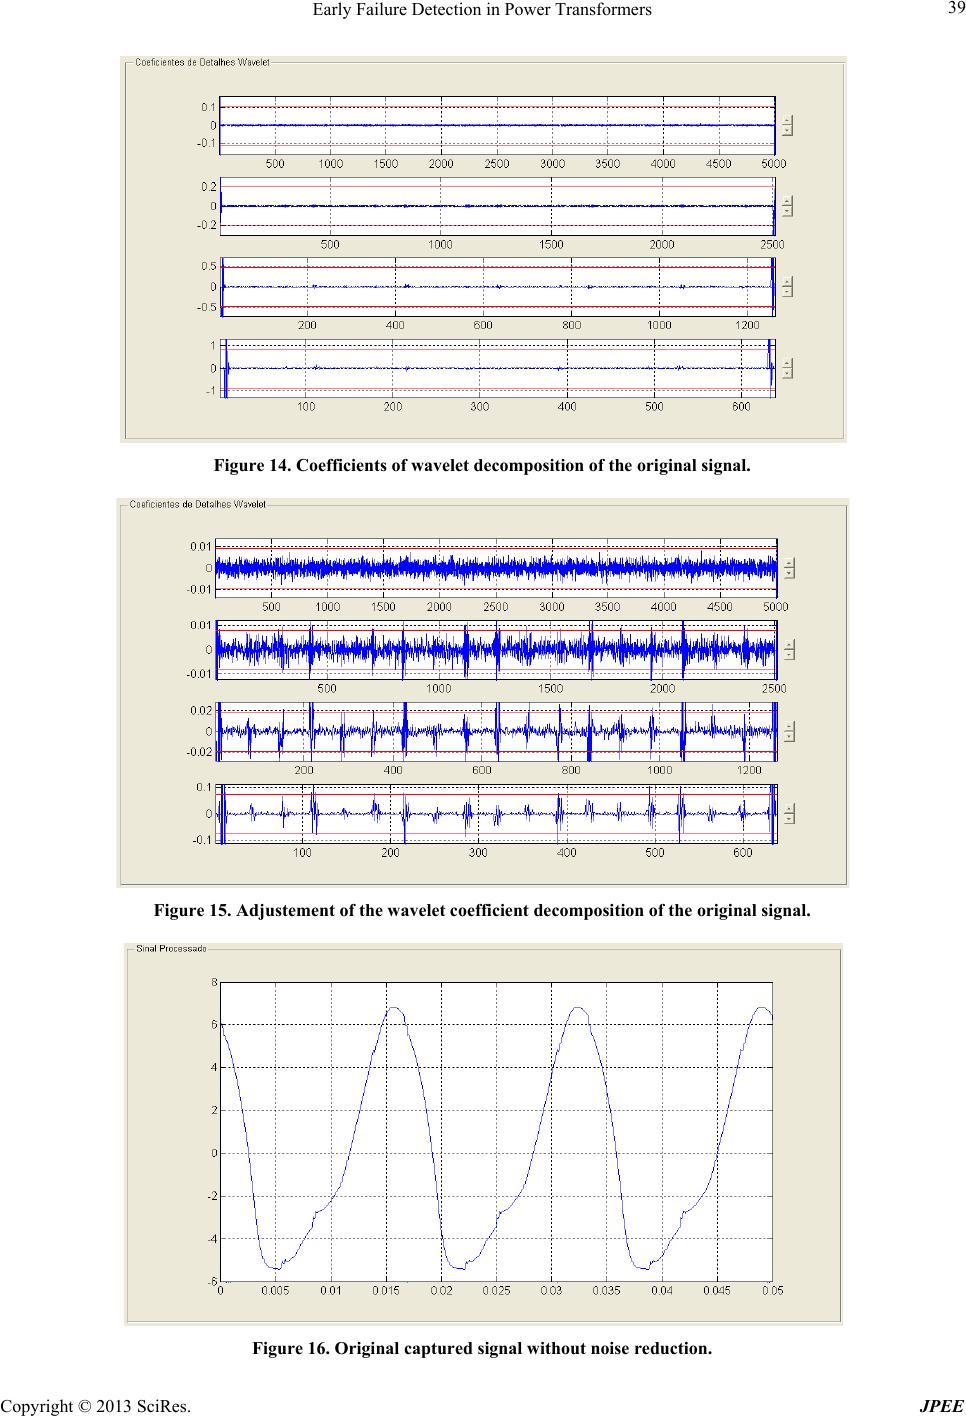 Early Failure Detection in Power Transformers Copyright © 2013 SciRes. JPEE Figure 14. Coefficients of wavelet decomposition of the original signal. Figure 15. Adjustement of the wavelet coefficient decomposition of the original signal. Figure 16. Original capt ured signal without noise reduction.  Early Failure Detection in Power Transformers Copyright © 2013 SciRes. JPEE Figure 17. (1) Original captured signal (the transient wave is located in red rectangle), and (2) transient waveform. 7. Acknowledgements The authors gratefully acknowledge the technical contri- butions of Termo Pernambuco Thermal Power Plant en- gineers. And also, the academic authors would like to thank CNPq, CAPES, and FAPEMIG for the partial fi- nancial suppo rt of this project. REFERENCES [1] A. A. A. Esmin and G. Lambert-Torres, “Application of Particle Swarm Optimization to Optimal Power Systems,” International Journal of Innovative Computing, Informa- tion and Control, Vol. 8, No. 3A, 2012, pp. 1705-1716. [2] E. L. Bonaldi, L. E. L. de Oli veira, J. G. Borges da Silva, G. Lambert-Torres and L. E. Borges da Silva, “Predictive Maintenance by Electrical Signature Analysis to Induc- tion Motors,” In: R. Araujo, Ed., Induction Motors— Modelling and Control, InTech, Croácia, 2012, pp. 487- 520. [3] C. H. da Silva, R. R. Pereira, L. E. Borges da Silva, G. Lambert-Torres and J. O. P. Pinto, “New Strategies for Application of Adaptive Filters in Active Power Filters,” IEEE Transactions on Industry Applications, Vol. 47, No. 3, 2011, pp. 1136-1141. http://dx.doi.org/10.1109/TIA.2011.2125931 [4] H. G. Arango, A. C. Z. de Souza, G. Lambert-Torres and A. P. Alves da Silva, “Difference between Regular and Deterministic Chaos Processes Based on Time Analysis of Load: An Example Using CEMIG Data,” Electric Pow- er Systems Research, Vol. 56, 2000, pp. 35-41. http://dx.doi.org/10.1016/S0378-7796(00)00095-X [5] C. S. Burrus, R. A. Gopinath and H. Guo, “Introduction to Wavelets and Wavel et Transforms,” Prentice Hall, New Jersey, 1998. [6] Y. Tian, P. L. Lewin, S. J. Sutton and S. G. Swingler, “PD Characterization Using Wavelet Decomposition of Acoustic Emission Signals,” Proceedings of the 2004 IEEE International Conference on Solid Dielectrics, Tou- louse, France, 2004. [7] G. F. C. Veloso, L. E. Borges da Silva, I. Noronha, G. Lambert-Torres, J. Haddad, R. R. Pereira and S. U. Ahn, “Detection of Partial Discharge in Power Transformers Using Rogow ski Coil and Multir esolution Anal ysis,” Jour- nal of Energy and Power Engineering, Vol. 4, No. 2, 2010, pp. 39-45. [8] S. A. Boggs, “Partial Discharge: Overview and Signal Generation,” IEE E Electrical Insulation Magazine, Vol. 6, No. 4, 1990, pp. 33-39. http://dx.doi.org/10.1109/57.63057 [9] G. J. Paoletti and A. Golubev, “Partial Discharge Theory and Technologies Related to Medium-Voltage Electrical Equipment,” IEEE Transactions on Industry Applications, Vol. 37, No. 1, 2001, pp. 90-103. http://dx.doi.org/10.1109/28.903131 [10] L. E. Borges da Silva, L. E. L. de Oliveira, L. E. L. de Oliveira, V. F. da Silva, J. O. P. Pinto and B. K. Bose, “Improving the Dynamic Response of Active Power Fil- ters Based on the Synchronous Reference Frame Method,” Proceedings of the Applied Power Electronics Confer- ence, APEC2002, Dallas, 10-14 March 2002, Vol. 2, pp. 742-748.
|