 American Journal of Anal yt ical Chemistry, 2011, 2, 116-125 doi:10.4236/ajac.2011.22013 Published Online May 2011 (http://www.SciRP.org/journal/ajac) Copyright © 2011 SciRes. AJAC Speciation of Dissolved Trace Nickel in Environmental Waters by On-Line Sonodigestion-Flow Injection Solid Phase Extraction Coupled to Flame Atomic Absorption Spectrometry María Carmen Yebra-Biurrun1*, Jesús Manuel Castro-Romero2 1Department of Analytical Chemistry, Nutrition and Bromatology, Faculty of Chemistry, University of Santiago de Compostela, Santiago de Composte l a, Spain 2Department of Analytical Chemistry, Escuela Universitaria Politécnica, University of A Coruña, Ferrol, Spain E-mail:* mcarmen.yebra@usc.es Received January 5, 2011; revised January 19, 2011; accepted January 20, 2011 Abstract A simple on-line sonodigestion system was successfully used for breakdown organic nickel complexes in environmental waters acidified with diluted nitric acid prior to flow injection total dissolved nickel precon- centration in a microcolumn containing a chelating resin (Chelite Che with iminodiacetic acid groups) and determination by flame atomic absorption spectrometry. For the determination of the dissolved labile nickel fraction, microcolumns packed with the chelating resin were loaded in-situ with the sample without sample pH modification, and once in the laboratory were inserted in the flow injection device where nickel elu- tion-detection was carried out. The performance of the chelating resin was investigated in order to elucidate its behavior in the presence of dissolved nickel species. The results obtained reveal that the resin, at the ex- perimental employed conditions, retained only dissolved free nickel ions and nickel bound to weak com- plexes (labile fraction). The figures of merit for determinations in both nickel fractions are given and the ob- tained values are discussed. The speciation scheme is applied to the analysis of nickel in river and seawater samples collected in Galicia (Northwest, Spain). The results of fractionation showed that Ni are mainly in the dissolved labile fraction in river water, while in seawater samples analyzed was mainly present in the organic fraction. Keywords: Sonodigestion, Preconcentration, Flow Injection, Nickel Speciation, Flame Atomic Absorption Spectrometry, Environmental Water 1. Introduction Nickel is a transition metal element that is widespread in the natural environment, and fulfils an important role in many biochemical processes. Once dissolved in fresh or sea water, the form of aqueous nickel is influenced by pH, redox conditions, ionic strength, the type and con- centration of inorganic and organic ligands, pressure and temperature, and the surfaces available for adsorption [1,2]. Thus, speciation studies of nickel in natural aquatic environments such as rivers, lakes, estuaries and seas must distinguish between dissolved and particulate nick- el. The aqueous solubility of nickel compounds and their chemical form and oxidation state in water strongly in- fluences their bioavailability and therefore toxicity. The dissolved nickel fraction in fresh and sea water forms free hydrated Ni(II) cations and soluble nickel inorganic and organic complexes of different stability [3]. An im- portant group of complexing agents in natural waters, which forms very stable complexes with transition met- als, is called the dissolved organic matter (DOM) [4]. Humic and fulvic substances, which are made up of a complex mixture of residues from the decomposition of plants and animals, are the main components of DOM in the aquatic environment, consisting of 30% - 80% dis- solved organic carbon in waters. Several studies have shown that binding of metallic ions with humic sub- stances increases metal mobility in natural waters and 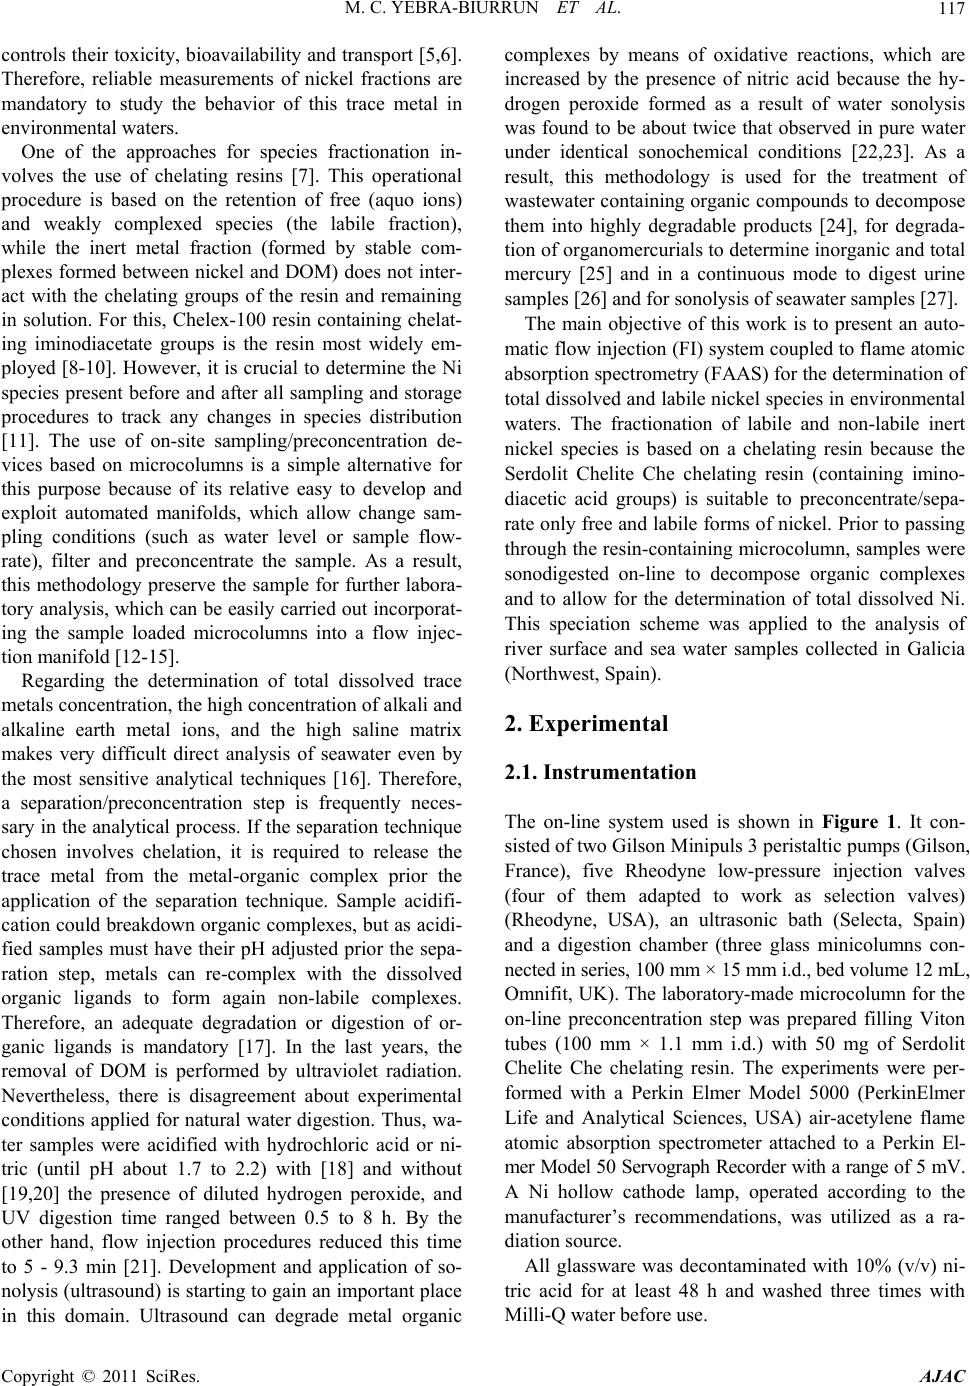 M. C. YEBRA-BIURRUN ET AL.117 controls their toxicity, bioavailability and transport [5,6]. Therefore, reliable measurements of nickel fractions are mandatory to study the behavior of this trace metal in environmental waters. One of the approaches for species fractionation in- volves the use of chelating resins [7]. This operational procedure is based on the retention of free (aquo ions) and weakly complexed species (the labile fraction), while the inert metal fraction (formed by stable com- plexes formed between nickel and DOM) does not inter- act with the chelating groups of the resin and remaining in solution. For this, Chelex-100 resin containing chelat- ing iminodiacetate groups is the resin most widely em- ployed [8-10]. However, it is crucial to determine the Ni species present before and after all sampling and storage procedures to track any changes in species distribution [11]. The use of on-site sampling/preconcentration de- vices based on microcolumns is a simple alternative for this purpose because of its relative easy to develop and exploit automated manifolds, which allow change sam- pling conditions (such as water level or sample flow- rate), filter and preconcentrate the sample. As a result, this methodology preserve the sample for further labora- tory analysis, which can be easily carried out incorporat- ing the sample loaded microcolumns into a flow injec- tion manifold [12-15]. Regarding the determination of total dissolved trace metals concentration, the high concentration of alkali and alkaline earth metal ions, and the high saline matrix makes very difficult direct analysis of seawater even by the most sensitive analytical techniques [16]. Therefore, a separation/preconcentration step is frequently neces- sary in the analytical process. If the separation technique chosen involves chelation, it is required to release the trace metal from the metal-organic complex prior the application of the separation technique. Sample acidifi- cation could breakdown organic complexes, but as acidi- fied samples must have their pH adjusted prior the sepa- ration step, metals can re-complex with the dissolved organic ligands to form again non-labile complexes. Therefore, an adequate degradation or digestion of or- ganic ligands is mandatory [17]. In the last years, the removal of DOM is performed by ultraviolet radiation. Nevertheless, there is disagreement about experimental conditions applied for natural water digestion. Thus, wa- ter samples were acidified with hydrochloric acid or ni- tric (until pH about 1.7 to 2.2) with [18] and without [19,20] the presence of diluted hydrogen peroxide, and UV digestion time ranged between 0.5 to 8 h. By the other hand, flow injection procedures reduced this time to 5 - 9.3 min [21]. Development and application of so- nolysis (ultrasound) is starting to gain an important place in this domain. Ultrasound can degrade metal organic complexes by means of oxidative reactions, which are increased by the presence of nitric acid because the hy- drogen peroxide formed as a result of water sonolysis was found to be about twice that observed in pure water under identical sonochemical conditions [22,23]. As a result, this methodology is used for the treatment of wastewater containing organic compounds to decompose them into highly degradable products [24], for degrada- tion of organomercurials to determine inorganic and total mercury [25] and in a continuous mode to digest urine samples [26] and for sonolysis of seawater samples [27]. The main objective of this work is to present an auto- matic flow injection (FI) system coupled to flame atomic absorption spectrometry (FAAS) for the determination of total dissolved and labile nickel species in environmental waters. The fractionation of labile and non-labile inert nickel species is based on a chelating resin because the Serdolit Chelite Che chelating resin (containing imino- diacetic acid groups) is suitable to preconcentrate/sepa- rate only free and labile forms of nickel. Prior to passing through the resin-containing microcolumn, samples were sonodigested on-line to decompose organic complexes and to allow for the determination of total dissolved Ni. This speciation scheme was applied to the analysis of river surface and sea water samples collected in Galicia (Northwest, Spain). 2. Experimental 2.1. Instrumentation The on-line system used is shown in Figure 1. It con- sisted of two Gilson Minipuls 3 peristaltic pumps (Gilson, France), five Rheodyne low-pressure injection valves (four of them adapted to work as selection valves) (Rheodyne, USA), an ultrasonic bath (Selecta, Spain) and a digestion chamber (three glass minicolumns con- nected in series, 100 mm × 15 mm i.d., bed volume 12 mL, Omnifit, UK). The laboratory-made microcolumn for the on-line preconcentration step was prepared filling Viton tubes (100 mm × 1.1 mm i.d.) with 50 mg of Serdolit Chelite Che chelating resin. The experiments were per- formed with a Perkin Elmer Model 5000 (PerkinElmer Life and Analytical Sciences, USA) air-acetylene flame atomic absorption spectrometer attached to a Perkin El- mer Model 50 Servograph Recorder with a range of 5 mV. A Ni hollow cathode lamp, operated according to the manufacturer’s recommendations, was utilized as a ra- diation source. All glassware was decontaminated with 10% (v/v) ni- tric acid for at least 48 h and washed three times with Milli-Q water before use. Copyright © 2011 SciRes. AJAC  M. C. YEBRA-BIURRUN ET AL. Copyright © 2011 SciRes. AJAC 118 Figure 1. Schematic of the flow injection manifold used for the determination of total and labile dissolved Ni(II) in environ- mental water samples. B: blank; BS: buffer solution; DC: digestion chamber; E: eluent; FAAS: flame atomic absorption spectrometer; IV: injection valve; M: mixing coil; MC: microcolumn containing the resin Serdolit Chelite Che; P1 and P2: peristaltic pumps; S/SS: sample or standard solution; SV1, SV2, SV3 and SV4: selecting valves; UB: ultrasonic bath; UW: ultrapure w a t er; W: waste. 2.2. Reagents and Samples Nickel stock solution (1000 g·mL–1) was purchased from Merck (Germany). The nitric acid used to water acidification and the hydrochloric acid used to the elu- tion step were from Merck (Germany). The chelating resin containing iminodiacetic acid groups was Serdolit Chelite Che (Serva Electrophoresis, Germany). Ammo- nia-ammonium chloride buffer solution (pH 8) was pre- pared by dissolution of 1.1 g of ammonium chloride (Merck, Germany) in 100 mL of ultrapure water and adjust the pH to 8.0 by adding diluted ammonia (Merck, Germany). Aqueous solutions of humic acid (Sigma- Aldrich, Switzerland), ethylenediaminetetraacetic acid (EDTA), sodium chloride and sodium sulfate (Merck, Germany) were prepared as model natural ligands. Certi- fied reference material Slew-3 (estuarine water) obtained from the National Research Council of Canada. Solu- tions (reagents and standards) were prepared using ul- trapure water of 18.2 M cm resistivity, obtained from a Milli-Q water purification system (Millipore, USA). Statistical analysis of the experimental designs was carried out by means of the Statgraphics Plus V.5.1 sta- tistical package (Manugistic, Inc., USA). Surface river water and seawater samples were col- lected in Galicia (Northwest, Spain). For the determina- tion of total dissolved nickel, samples were collected in pre-cleaned glass bottles, filtered through a 0.45 µm membrane filter (mixed cellulose esters, Millipore Ibéri- ca, Spain); and immediately acidified with 10 mL of concentrated nitric acid to avoid metal adsorption on the container walls. The samples were stored in a refrigerator (4˚C) for no longer than two weeks. For the determina- tion of the nickel labile fraction, water samples were preconcentrated on-site without prior pH modification. After on-line filtration with a 0.45 µm filter, 200 mL of each sample was passed through a resin-containing mi- crocolumn at a flow rate of 4.0 mL·min–1 [13]. As a re- sult, nickel was retained on the microcolumn only in its labile fraction. After loading, the resin was washed with ultrapure water and the residual internal fluid drawn off. The microcolumns were transported in a portable refrig- erator, and returned to the laboratory where they were stored in a refrigerator until further analysis. 2.3. Procedure For the determination of the concentration of the nickel labile fraction, the in-situ loaded microcolumns were connected to the FI manifold shown in Figure 1. The microcolumn was located immediately before the detec- tor. The analysis procedure consists of the injection of 110 L of 3 mol·L–1 hydrochloric acid into a carrier ul- trapure water pumped at 5.0 mL·min–1. Thus, the labile fraction of nickel is released directly into the nebulizer of the FAAS spectrometer at a flow-rate of 5.0 mL·min–1. The determination of the total dissolved concentration of nickel takes place after decomposition of metal or- ganic complexes by sonodigestion. Thus, water samples (30 mL) in 0.6 mol·L–1 nitric acid medium are inserted into the flow system at 5.0 mL·min–1 by means of a peri- staltic pump (P2). Once all the sample volume is located in the digestion chamber (three glass minicolumns con- nected in series (DC)), which are immersed within the ultrasonic bath at room temperature, the pump control- ling the sample stream (P2) was stopped and the sample  M. C. YEBRA-BIURRUN ET AL.119 stays under the action of ultrasound energy for a period of 120 s. After, the selecting valve (SV3) was switched to its other position to select the digestion chamber downstream, and the pump P2 was again activated. In this way, the sonodigested water sample arrives at the part of the FI system where the preconcentration step takes place, and converged with the buffer stream (am- monia-ammonium chloride buffer solution, pH 8) in or- der to obtain the optimum pH value for metal retention in the chelating resin. Both channels are homogenized in the mixing coil and then, the resulting stream passed through the microcolumn containing the chelating resin (Serdolit Chelite Che). By means of SV2, the sample matrix is sent to waste, while ultrapure water flowing through the detector by the nebulizer suction. Finally, the retained nickel was subsequently eluted by injection of 110 µL of 3 mol·L–1 hydrochloric acid into a water car- ried stream, being continuously monitored by a FAAS instrument. In order to avoid carry-over, a washing step was including in the analysis cycle. Thus, between each sample analysis, the digestion chamber was washed with ultrapure water during 60 s. For this, the selecting valve (SV4) was switched to select the ultrapure water stream channel, while the wash water was sent to waste through SV3. 3. Results and Discussion In this work, was chosen a resin with iminodiacetic acid groups (Serdolit Chelite Che) because a commercial re- sin containing this chelating group as Chelex-100 was proved to be an excellent medium for metal speciation. However, few reports appear in the bibliography in which other resins with these chelating groups are em- ployed for speciation schemes [8,9]. Furthermore, the chelating resin Serdolit Chelite Che is a macroporous (macroreticular) polystyrene based resin, which effec- tively size excludes colloids from binding sites. More- over, this resin has as advantage a wide pH range in- cluding unpolluted river and sea water [28]. Thus, the labile nickel fraction can be retained by the resin without pH modification, which prevent of changes in the ana- lytical composition of the different nickel fractions. 3.1. Effect of Complexing Agents Competition for metals from ligands in solution will de- termine the distribution among labile (free (aquo-ions) and weakly complexed species) and inert fractions (metal complexes unable to be dissociated by interaction with the active groups of the resin). In this study were selected as representative ligands chloride, sulfate, EDTA and humic acid at a concentration of 19000, 905, 30 and 30 mg·L–1, respectively. The inorganic ligands chosen are the major anionic components of river and sea water, and regarding the organic ligands, humic acids are the very important. EDTA is an organic ligand present in environmental waters, which is frequently used as or- ganic ligand model because has high affinity for metals, with which forms strong complexes [29]. The influence of these ligands on the complexation and retention of nickel by the Serdolit Chelite Che resin was investigated at pH 6 - 8 by using a solution containing 1 µg·L–1 of Ni(II) and a volume of 200 mL. The results of this study, shown in Figure 2, demonstrate that for both pH studied, more than 95% Ni(II) in chloride and sulfate solutions were retained by the resin. It is due to the formation of labile complexes with these anions. Nevertheless, when the solution contains humic acid or EDTA, for both tested pH values the nickel recovery was less than 10%. This behavior can be explained by the formation of non- labile complexes, which are not retained on the chelating resin. Thus, in view of the obtained values, it was estab- lished that the Serdolite Chelite Che resin can be used for separation of the free and the labile nickel fraction from their inert complexes formed with organic ligands. 3.2. Optimization of the Experimental Conditions for the FI Preconcentration of Ni(II) Experimental work was initially focused on the optimi- zation of the variables implied on the utilization of the chelating resin Serdolite Chelite Che in an on-line mode because the preconcentration step determines the effi- ciency of the final method. By applying the Plackett- Burman statistical method, it was possible to select the variables which had the largest influence on percentage of nickel recovery (analytical response). The selected Figure 2. Influence of several ligands on the complexation and retention of Ni(II). Copyright © 2011 SciRes. AJAC  M. C. YEBRA-BIURRUN ET AL. Copyright © 2011 SciRes. AJAC 120 factors and their levels are presented in Table 1. These factors were selected according to available data and experience gathered in previous screening experiments. Thus, a screening Plackett-Burman 2 ^ 6 × 3/16 experi- mental design with one centerpoint, which studied the effects of the factors in 13 experiments was run. All ex- periments were performed using a sample volume of 30 mL and introducing a standard solution of 1 g·L–1 of Ni(II) into the FI manifold. The analysis of the results produced the main effect Pareto chart (P = 95%) (Figure 3). In these charts, bar lengths are proportional to the absolute value of the estimated effect, which helps when comparing the relative importance of effects. The mini- mum ‘‘t’’ value at the 95% confidence interval was 2.4. The t value is plotted as a vertical black line in Figure 3. We considered as significant any variable that offered a value higher than ±t. Pareto chart (Figure 3) shows the most important factors affecting the on-line preconcen- tration of nickel. The sample pH (A), the eluent concen- tration (diluted hydrochloric acid) (C) and the eluent volume (E) were statistically significant with positive sign. The sample flow-rate, (B) was a variable with a great influence on the experimental response with nega- tive sign. The other variables considered, elution flow- rate and minicolumn diameter did not produce any sig- nificant effect. Therefore, these statistically insignificant variables were fixed at certain values taking into account the best operational, flow and analytical conditions. While the significant ones (sample pH (A), sample flow-rate (B), eluent concentration (C) and eluent vol- ume (E)) were optimized by using a central composite 24 + star design with 11 error degree of freedom and 26 runs. Table 1 lists the upper and lower values given for each variable together with the fixed values for insig- nificant variables studied in the screening design. By use of the standardized Pareto chart is found that the sample pH and eluent concentration are statistically significant factors in the ranges under study. Thus, maximum values tested for these variables were selected as optimum. The values chosen for sample flow-rate and eluent volume were a compromise between reasonable recovery, rea- sonable analysis time, and adequate concentration factor achieved. The choice was inferred from predictions pro- vided by the Statgraphics software. The values selected, on the basis of results obtained by use of the response surface (Figure 4), are listed in Table 1. As the recovery in the optimum conditions for pH values studied ranged between 85.7% to 96.7%, it was verify the optimum pH range for nickel preconcentration. Thus, recovery was calculated under the selected experimental conditions and modifying the sample pH (between 4 and 8). The results obtained demonstrated that nickel was recovered quantitatively in the pH range 5 - 8. This pH range in- cludes the normal pH range of river and sea water, which implies that the pH does not have to be modified when the labile nickel species are on-site preconcentrated. Table 1. Variables and their experimental levels adopted for the selection of variables involving the FI preconcentration step. Plackett-Burman 2 ^ 6 × 3/16 design 2 ^ 4 + star central composite design Level Level Variable Key Low Upper Optimum Low Upper Optimum Sample pH A 1 8 - 2 8 8 Sample flow-rate (mL·min–1) B 1 5 - 1 4 4 HCl concentration (eluent solution, mol·L–1) C 0.1 3 - 1 3 3 Elution flow-rate (mL·min–1) D 3 5 5 - - - Eluent volume (µL) E 70 110 - 90 110 110 Minicolumn diameter (mm) F 1.1 2.3 1.1 - - - Figure 4. Cubic response surface estimated for the central composite design in the optimization of the FI preconcen- tration step. Figure 3. Pareto chart for the Plackett-Burman design ap- plied to optimize the FI preconcentration step.  M. C. YEBRA-BIURRUN ET AL.121 3.3. Optimization of the Experimental Conditions for the On-Line Sonodigestion of Environmental Water Samples The optimization of the variables affecting the on-line sonodigestion procedure of environmental water samples: concentration of nitric acid (acid sample medium) (A), sonication time (B) and sonodigestion temperature (C), was carried out by building a central composite design (23 + star with 11 error degree of freedom, 16 random- ized experiments and three replicates). The tested values for each variable are shown in Table 2. The response variable was the recovery calculated according to the following equation: % R = (C1/C2) × 100, where C1 is the concentration of Ni(II) obtained by the proposed procedure and C2 is the concentration obtained for the same water sample, but performing the sample digestion procedure by traditional way using ammonium peroxy- disulfate at elevated temperature [30]. The experiments were performing by using a sample volume of 30 mL, and as digestion chamber two possible operational modes were studied: 1) a glass minicolumn (100 mm × 25 mm i.d., bed volume 35 mL), 2) three glass minicolumns connected in series (100 mm × 15 mm i.d., bed volume 12 mL). After performing the experiments, it is proven that for both operational modes tested, sonodigestion temperature is not a significant variable, resulting in low estimated effects. In fact, some experiments result in quantitative recoveries when the sonodigestion tempera- ture is 20˚C. Therefore, 20˚C (room temperature) was the value chosen as optimum for this variable. Thus, only the two statistically significant factors (with positive sign): acid sample medium concentration (A) and sonication time (B) were taken into account to analyze the design. The values chosen for these variables were a compro- mise between, reasonable analysis time and the lowest nitric acid concentration with which a quantitative re- covery is obtained. The choice was inferred from predic- tions provided by the Statgraphics software. The values selected, on the basis of results obtained by use of the response surface (Figure 5) are listed in Table 2. The analysis of the response surface plot indicates that for the same sonodigestion acid medium (0.6 mol·L–1 nitric ac- id), the sonication time required for quantitative recovery when a single minicolumn was used as digestion cham- ber is higher than that need when three minicolumns were used. This can be explained by the fact that the sin- gle minicolumn has a diameter (25 mm) higher than that of the three minicolumns connected in series (15 mm), which generates a high attenuation of ultrasound waves, reducing the effects of ultrasound energy in the sample within the minicolumn. Consequently, in order to in- crease the analysis time, for subsequent work we decided to use minicolumns with the minor diameter (15 mm). As each column has a bed volume of 12 mL, are neces- sary three to contain a water sample volume of 30 mL. In these conditions, nickel was quantitatively recovered when the sonication time was 120 s. Table 2. Optimization of experimental parameters for continuous sonodigestion. 2 ^ 3 + star central composite design Level Optimum Variable Key Low Upper M1a M2b Concentration of acid sample medium (nitric acid, mol·L–1) A 0.2 1 0.6 0.6 Sonication time (min) B 60 240 180 120 Sonodigestion temperature (˚C) C 20 50 20 20 aM1: a glass minicolumn (100 mm × 25 mm i.d., bed volume 35 mL); bM2: three glass minicolumns connected in series (100 mm × 15 mm i.d., bed volume 12 mL). Total bed volume 36 mL. Figure 5. Response surfaces estimated for the central composite design in the optimization of the on-line sonodigestion. (a) Digestion chamber: one minicolumn (25 mm i.d.); (b) Digestion chamber: three minicolumns connected in series (15 mm i.d). Copyright © 2011 SciRes. AJAC  M. C. YEBRA-BIURRUN ET AL. Copyright © 2011 SciRes. AJAC 122 3.4. Analytical Data and Validation of the Method The sample volume used for the determination of the total dissolved concentration of nickel was 30 mL, and the sample volume used for the determination of the dis- solved labile nickel fraction was 200 mL. Therefore, for each one of these sample volumes calibration plots were established by use standard solutions at eight concentra- tions levels (0 - 7.5 µg·L–1 Ni and 0 - 1.1 µg·L–1 Ni, for 30 and 200 mL, respectively). These standard solutions were treated in accordance with the sample-treatment procedure using the described optimized system de- scribed above. The regression equations of the calibration graph ob- tained for both sample volumes are shown in Table 3. The limits of detection (LOD) and the limits of quantifi- cation (LOQ) for the different nickel fractions were cal- culated by use of the IUPAC criterion [31]. As a result of use a minor sample volume, the detection limit for the determination of the dissolved labile nickel fraction is lower than that for the determination of its total dissolved concentration. Analytical and statistical data for each nickel fractions are summarized in Table 3. The precision of the method (within day), expressed as relative standard deviation, was evaluated by eleven independent measurements of a water sample. The preconcentration factors calculated as the ratio of the slope of the calibration graph with and without preconcentration were also shown in Table 3. Analytical recovery was assessed after spiking aliquots of seawater and river water samples with metals (Table 3). It can be concluded that a complete analytical recovery (within the 95.5% - 98.6% range) was reached for both nickel fractions. A certified reference material (Slew-3) with a certificate value of (1.23 ± 0.07) µg·L–1 Ni was used to verify the accuracy of the proposed methodology. The concentrations found was (1.25 ± 0.07) µg·L–1, which is in concordance with the certified value. To evaluate the possible sample matrix interferences in the nickel determination, a standard addition method was performed. In this way, the certified reference material (Slew-3) was spiked with several nickel standard solu- tions (0 - 5 μg·L–1). In these conditions, an addition cali- bration graph was run (n = 6) under the optimal chemical and flow conditions for the whole process. The equation was: absorbance = 8.8 × 10⁻³ C + 0.011 (r2 = 0.9996), where C is Ni concentration, expressed as μg·L–1. This equation and the calibration graph have the same slope, demonstrating that Ni determination is free of matrix interferences. With the aim to establish the time that, once in situ loaded with water samples, the minicolumns could be stored before nickel determination, stability studies at optimum conditions were performed. For this, the nickel retained on minicolumns was determined at the same day of the sampling, and after 5 and 10 days stored at 4˚C (refrigerator). The obtained results indicated that mini- columns were stable for at least 10 days and could be stored during this time without any significant losses. 3.5. Determination of Labile and Total Nickel in Environmental Water Samples In order to evaluate the analytical applicability of the proposed method, it was applied to the determination of labile and total nickel in several environmental water samples from Galicia (north-western Spain) and the re- sults obtained are summarized in Table 4 (mean ± stan- dard deviation, n = 3). The percentages for the labile fraction of each metal are also presented in Table 4. Thus, it has demonstrated that in the analyzed seawater samples, nickel is principally present in the inert fraction forming strong organic complexes ((10.8 ± 0.4)%) in the Table 3. Analytical and statistical data of the determination of total and labile dissolved nickel in environmental water samples. Labile Ni Total Ni Sample volume, mL 200 30 Calibration equation (C, µg·L–1) 5.9 × 10⁻² C + 8.0 × 10⁻⁵ 8.8 × 10⁻³ C + 3.1 × 10⁻⁴ Linear range, µg·L–1 0.065-1.17 0.45 - 7.52 Correlation coefficient, r2 0.999 0.999 Preconcentration factor 1792.7 265.9 Detection limit, µg·L–1 0.021 0.13 Precision (RSD, %) 2.7 1.8 Recovery(%)a 95.5 96.6 Recovery(%)b 96.9 98.5 Recovery(%)c 97.4 97.2 Recovery(%)d 98.6 97.7 aTotal dissolved Ni: seawater sample spiked with 2 µg·L–1. Labile dissolved Ni: seawater sample spiked with 0.3 µg·L–1 (n = 3); bTotal dissolved Ni: seawater sample spiked with 3 µg·L–1. Labile dissolved Ni: seawater sample spiked with 0.4 µg·L–1 (n = 3); cTotal dissolved Ni: river water sample spiked with 3 µg·L–1. Labile dissolved Ni: river water sample spiked with 0.3 µg·L–1 (n = 3); dTotal dissolved Ni: river water sample spiked with 5 µg·L–1. Labile dissolved Ni: river water sample spiked with 0.5 µg·L–1 (n = 3).  M. C. YEBRA-BIURRUN ET AL.123 Table 4. Determination of labile and total nickel in environmental water samples from Galicia (north-western Spain). Nickel concentration, µg·L–1 Sample Labile Total % LFa Seawater 1 0.48 ± 0.02 4.62 ± 0.11 10.4 Seawater 2 0.34 ± 0.02 3.22 ± 0.17 10.6 Seawater 3 0.19 ± 0.01 1.71 ± 0.07 11.1 Seawater 4 0.11 ± 0.01 1.03 ± 0.07 10.7 Seawater 5 0.26 ± 0.02 2.24 ± 0.11 11.6 Seawater 6 0.21 ± 0.01 1.97 ± 0.07 10.7 Seawater 7 0.42 ± 0.02 3.83 ± 0.11 11.0 Seawater 8 0.50 ± 0.03 4.55 ± 0.07 11.0 Seawater 9 0.63 ± 0.03 6.02 ± 0.17 10.5 Seawater 10 0.34 ± 0.02 3.26 ± 0.23 10.4 River water 1 1.15 ± 0.01 1.29 ± 0.10 89.1 River water 2 0.62 ± 0.01 0.68 ± 0.03 91.2 River water 3 1.06 ± 0.01 1.18 ± 0.07 89.8 River water 4 0.55 ± 0.02 0.61 ± 0.03 90.2 River water 5 0.82 ± 0.01 0.91 ± 0.07 90.1 River water 6 0.99 ± 0.02 1.14 ± 0.09 86.8 River water 7 0.90 ± 0.01 1.03 ± 0.07 87.4 River water 8 0.81 ± 0.02 0.96 ± 0.03 84.4 a LF: Percentage of labile fraction labile dissolved fraction). By the other hand, in river wa- ter samples nickel is found mainly in the labile dissolved fraction ((88.6 ± 2.3)%). 4. Conclusions A combination of continuous sonodigestion and solid- phase extraction by using a chelating resin was exploited for dissolved nickel speciation in environmental water samples, determining labile (comprising the free ion, inorganic complexes and weak organic complexes) and total dissolved nickel (mainly comprising, additionally, strong organic complexes) with a high sensitivity and precision. Sonodigestion has been used for first time for decomposition of organic complexes of nickel from en- vironmental waters, which allowed simplify sample preparation and speed up and the analysis time for the determination of total dissolved Ni concentration. On the other hand, for the determination of the labile fraction, it is demonstrated for the first time that Chelite Che resin can be used as an effective material for the in-situ sepa- ration/preconcentration of free and labile dissolved Ni(II) species. Furthermore, the proposed methodology could be applied with detection by inductively coupled plasma atomic emission spectrometry and inductively coupled plasma-mass spectrometry to improve analytical sensi- tivity. 5. Acknowledgements This work has been funded by the Spain's Ministry of Science and Innovation, within the framework of Project CTQ 2009-12282. 6. References [1] R. Mandal, N. M. Hassan, J. Murimboh, C. L. Chakra- barti and M. H. Back, “Chemical Speciation and Toxicity of Nickel Species in Natural Waters from the Sudbury Area (Canada),” Environmental Science and Technology, Vol. 36, No. 7, 2002, pp. 1477-1484. doi:10.1021/es015622e [2] R. Cornellis, J. Caruso, H. Crews and K. Heumann, “Handbook of Elemental Speciation II: Species in the Environment, Food, Medicine and Occupational Health,” Copyright © 2011 SciRes. AJAC  M. C. YEBRA-BIURRUN ET AL. 124 John Wiley & Sons Ltd., Chichester, 2005. [3] M. Martino, A. Turner and M. Nimmo, “Distribution, Speciation and Particle-Water Interactions of Nickel in the Mersey Estuary, UK,” Marine Chemistry, Vol. 88, No. 3-4, 2004, pp.161-177. doi:10.1016/j.marchem.2004.03.007 [4] J. D. Thomas, “The Role of Dissolved Organic Matter, Particularly Free Amino Acids and Humic Substances, in Freshwater Ecosystems,” Freshwater Biology, Vol. 38, No. 1, 1997, pp. 1-36. doi:10.1046/j.1365-2427.1997.00206.x [5] L. E. Doig and K. Liber, “Nickel Speciation in the Pres- ence of Different Sources and Fractions of Dissolved Or- ganic Matter,” Ecotoxicology and Environmental Safety, Vol. 66, No. 2, 2007, pp. 169-177. doi:10.1016/j.ecoenv.2005.12.011 [6] I. V. Slaveykova, I. B. Karadjova, M. Karadjov and D. L. Tsalev, “Trace Metal Speciation and Bioavailability in Surface Waters of the Black Sea Coastal Area Avaluated by HF-PLM and DGT,” Environmental Science and Tec- hnology, Vol. 43, No. 6, 2009, pp. 1798-1803. doi:10.1021/es802544n [7] M. Pesavento, G. Alberti and R. Biesuz, “Analytical Me- thods for Determination of Free Metal Ion Concentration, Labile Species Fraction and Metal Complexation Capac- ity of Environmental Waters: A Review,” Analytica Chi- mica Acta, Vol. 631, No. 2, 2009, pp. 129-141. doi:10.1016/j.aca.2008.10.046 [8] M. B. Alvarez, M. E. Malla and D. E. D. Batistoni, “Per- formance Evaluation of Two Chelating Ion-Exchange Sorbents for the Fractionation of Labile and Inert Metal Species from Aquatic Media,” Analytical and Bioana- lytical Chemistry, Vol. 378, No. 2, 2004, pp. 438-446. doi:10.1007/s00216-003-2237-y [9] K. C. Bowles, S. C. Apte, G. E. Batley, L. H. Hales and N. J. Rogers, “A Rapid Chelex Column Method for the Determination of Metal Speciation in Natural Waters,” Analytica Chimica Acta, Vol. 558, No. 1-2, 2006, pp. 237-245. doi:10.1016/j.aca.2005.10.071 [10] G. Alberti, R. Biesuz and M. Pesavento, “Determination of the Total Concentration and Speciation of Metal Ions in River, Estuarine and Seawater Samples,” Analytical Sciences, Vol. 24, No. 12, 2008, pp. 1605-1611. doi:10.2116/analsci.24.1605 [11] D. L. Giokas, J. Antelo, E. K. Paleologos, F. Arce and M. I. Karayannis, “Copper Fractionation with Dissolved Or- ganic Matter in Natural Waters and Wastewaters—A Mixed Micelle Mediated Methodology (Cloud Point Ex- traction) Employing Flame Atomic Absorption Spec- trometry,” Journal of Environmental Monitoring, Vol. 4, No. 4, 2002, pp. 505-510. doi:10.1039/b202668f [12] G. M. Sawula, “On-Site Preconcentration and Trace Met- al Ions Determination in the Okavango Delta Water Sys- tem, Botswana,” Talanta, Vol. 64, No. 1, 2004, pp. 80-86. doi:10.1016/j.talanta.2003.11.048 [13] M. C. Yebra-Biurrun, A. Moreno-Cid and L. Puig, “Mi- nicolumn Field Preconcentration and Flow-Injection Flame Atomic Absorption Spectrometric Determination of Cadmium in Seawater,” Analytica Chimica Acta, Vol. 524, No. 1-2, 2004, pp. 73-77. doi:10.1016/j.aca.2004.05.052 [14] K. Zih-Perényi and A. Lásztity, “On-Site Classification of Manganese Forms in Natural Waters by Membrane Filtration and Chelating Exchange,” Spectrochimica Acta B, Vol. 60, No. 3, 2005, pp. 385-392. doi:10.1016/j.sab.2005.01.009 [15] J. P. Lafleur and E. D. Salin, “Pre-Concentration of Trace Metals on Centrifugal Microfluidic Discs with Direct Determination by Laser Ablation Inductively Coupled Plasma Mass Spectrometry,” Journal of Analytical Ato- mic Spectrometry, Vol. 24, No. 11, 2009, pp. 1511-1516. doi:10.1039/b910276k [16] F. C. Domínguez-Lledó, M. D. Galindo-Riaño, I. C. Díaz-López, M. García-Vargas and M. D. Granado-Ca- stro, “Applicability of a Liquid Membrane in Enrichment and Determination of Nickel Traces from Natural Wa- ters,” Analytical and Bioanalytical Chemistry, Vol. 389, No. 2, 2007, pp. 653-659. doi:10.1007/s00216-007-1472-z [17] A. Limbeck, “Microwave-Assisted UV-Digestion Proce- dure for the Accurate Determination of Pd in Natural Waters,” Analytica Chimica Acta, Vol. 575, No. 1, 2006, pp. 114-119. doi:10.1016/j.aca.2006.05.062 [18] E. P. Achterberg, C. B. Braungardt, R. C. Sandford and P. J. Worsfold, “UV Digestion of Seawater Samples Prior to the Determination of Copper Using Flow Injection with Chemiluminescence Detection,” Analytica Chimica Acta, Vol. 440, No. 1, 2001, pp. 27-36. doi:10.1016/S0003-2670(01)00824-8 [19] M. T. S. D. Vasconcelos and M. F. C. Leal, “Speciation of Cu, Pb, Cd and Hg in Waters of the Oporto Coast in Portugal, Using Pre-Concentration in a Chelamine Resin Column,” Analytica Chimica Acta, Vol. 353, No. 2-3, 1997, pp. 189-198. doi:10.1016/S0003-2670(97)87777-X [20] N. Ndung’u, R. P. Franks, K. W. Bruland and A. R. Fle- gal, “Organic Complexation and Total Dissolved Trace metal Analysis in Estuarine Waters: Comparison of Sol- vent-Extraction Graphite Furnace Atomic Absorption Spectrometric and Chelating Resin Flow Injection Induc- tively Coupled Plasma-Mass Spectrometric Analysis,” Analytic a C himica Acta, Vol. 481, No. 1, 2003, pp. 127-138. doi:10.1016/S0003-2670(03)00063-1 [21] D. Point, G. Bareille, H. Pinaly, C. Belin and O. F. X. Donard, “Multielemental Speciation of Trace Elements in Estuarine Waters with Automated On-Site UV Photolysis and Resin Chelation Coupled to Inductively Coupled Plasma Mass Spectrometry,” Talanta, Vol. 72, No. 3, 2007, pp. 1207-1216. doi:10.1016/j.talanta.2007.01.014 [22] L. Venault, Ph. Moisy, S. I. Nikitenko and C. Madic, “Kinetics of Nitrous Acid Formation in Nitric Acid Solu- tions under the Effect of Power Ultrasound,” Ultrasonics Sonochemistry, Vol. 4. No. 2, 1997, pp. 195-204. doi:10.1016/S1350-4177(97)00010-2 [23] S. I. Nikitenko, L. Venault and Ph. Moisy, “Scavenging of OH Radicals Produced from H2O Sonolysis with Ni- Copyright © 2011 SciRes. AJAC  M. C. YEBRA-BIURRUN ET AL. Copyright © 2011 SciRes. AJAC 125 trate Ions,” Ultrasonics Sonochemistry, Vol. 11, No. 3-4, 2004, pp. 139-142. doi:10.1016/j.ultsonch.2004.01.009 [24] J. Madhavan, F. Grieser and M. Ashokkumar, “Degrada- tion of Orange-G by Advanced Oxidation Processes,” Ultrasonics Sonochemistry, Vol. 17, No. 2, 2010, pp. 338-343. doi:10.1016/j.ultsonch.2009.10.008 [25] J. L. Capelo, I. Lavilla and C. Bendicho, “Room Tem- perature Sonolysis-Based Advanced Oxidation Process for Degradation of Organomercurials: Application To Determination Of Inorganic And Total Mercury In Wa- ters By Flow Injection-Cold Vapor Atomic Absorption Spectrometry,” Analytical Chemistry, Vol. 72, No. 20, 2000, pp. 4979-4984. doi:10.1021/ac000470b [26] R. M. Cespón-Romero and M. C. Yebra-Biurrun, “De- termination of Trace Metals in Urine with an On-Line Ultrasound-Assisted Digestion System Combined with a Flow-Injection Preconcentration Manifold Coupled to Flame Atomic Absorption Spectrometry,” Analytica Chimica Acta, Vol. 609, No. 2, 2008, pp. 184-191. doi:10.1016/j.aca.2008.01.002 [27] M. C. Yebra-Biurrun and N. Carro-Mariño, “Flow Injec- tion Flame Atomic Absorption Determination of Cu, Mn and Zn Partitioning in Seawater by On-Line Room Tem- perature Sonolysis and Minicolumn Chelating Resin Me- thodology,” Talanta, Vol. 83, No. 2, 2010, pp. 425-430. doi:10.1016/j.talanta.2010.09.045 [28] E. R. Weiner, “Applications of Environmental Aquatic Chemistry: A Practical Guide,” 2nd Edition, CRC Press, Boca Raton, 2008. doi:10.1201/9781420008371 [29] J. Hur, M. A. Schlautman and S. Yim, “Effects of Or- ganic Ligands and pH on the Leaching of Copper from Brake Wear Debris in Model Environmental Solutions,” Journal of Environmental Monitoring, Vol. 6, No. 1, 2004, pp. 89-94. doi:10.1039/b310125h [30] M. C. Yebra-Biurrun, A. Bermejo-Barrera, M. L. Mel- la-Louzao and M. P. Bermejo-Barrera, “Determination of Copper Traces in Water by Atomic Absorption Spectrometry,” Quimica Analitica, Vol. 10, No. 1, 1991, pp. 59-64. [31] L. A. Currie, “Nomenclature in Evaluation of Analytical Methods Including Detection and Quantification Capa- bilities (IUPAC Recommendations 1995),” Analytica Ch- imica Acta, Vol. 391, No. 2, 1999, pp. 105-126. doi:10.1016/S0003-2670(99)00104-X
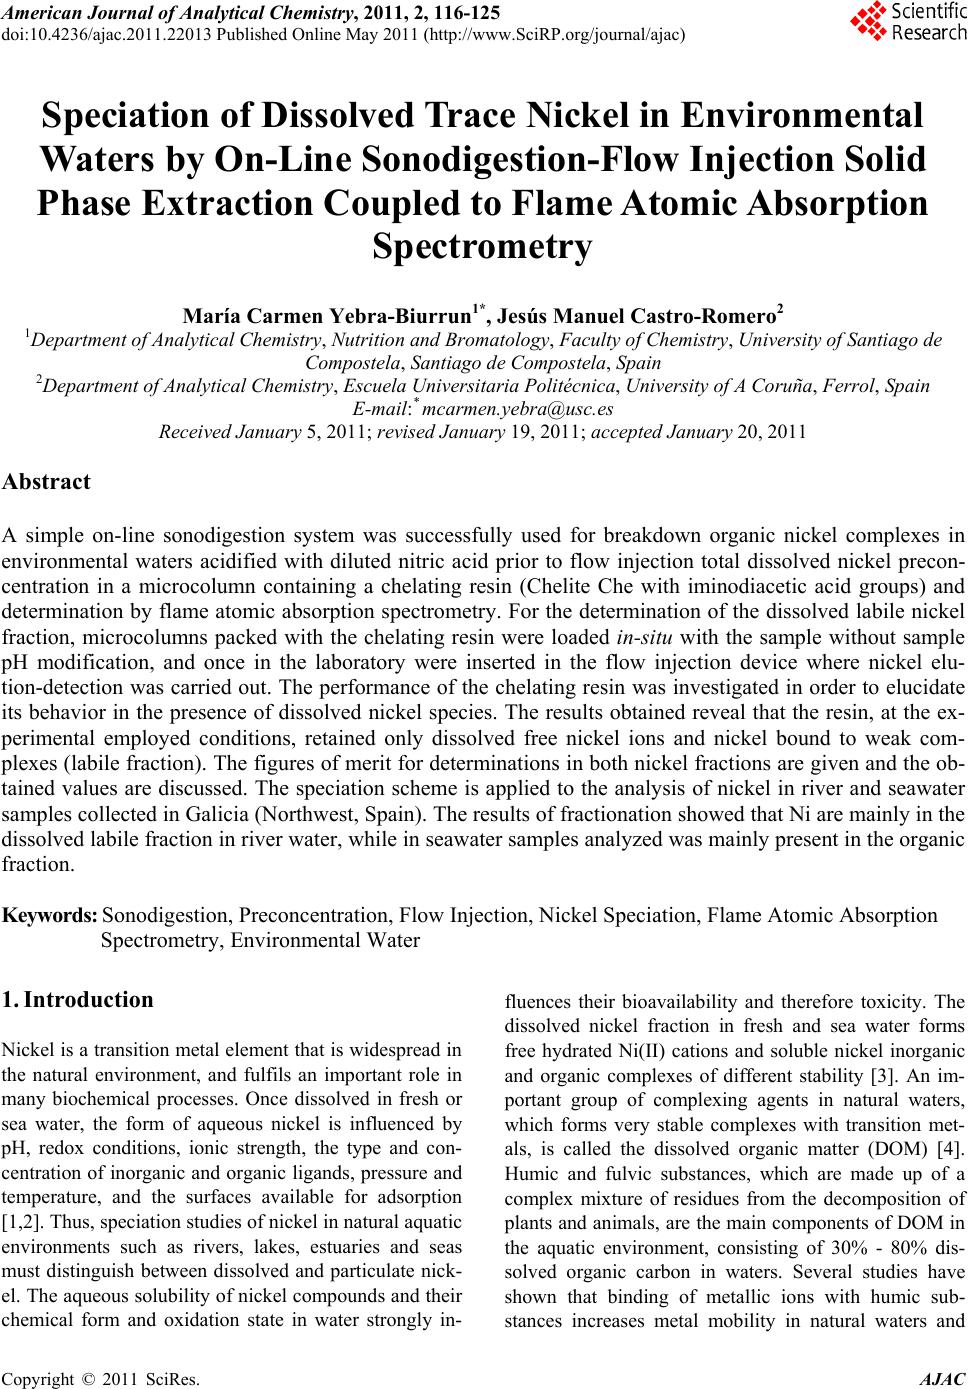
|