American Journal of Analytical Chemistry, 2011, 2, 85-92
doi:10.4236/ajac.2011.22009 Published Online May 2011 (http://www. SciRP.org/journal/ajac)
Copyright © 2011 SciRes. AJAC
Dielectric Analysis of Response Time in Electr orh eological
Fluids Developed for Medical Devices
Naullage Indika Perera, Manik Pavan Maheswaram, Dhruthiman Mantheni,
Hettiarachchige Dhanuja Perera, Michael Ellen Matthews, Tobili Sam-Yellowe, Alan Riga
Department of Chemistry, Cleveland State University, Cleveland, USA
E-mail: alanriga@hotmail.com
Received August 2, 2010; revised January 12, 2011; accepted March 5, 2011
Abstract
Three electrorh eological fluids (ERFs) of recently synthesized P olyaniline. HCl and Cellulose fl uids as well
as a commercial product from Flud icon® (German y), were ev aluated with a two-electrode probe unit and by
Dielectric Analysis (DEA). The study was a part of an ongoing medical device development project. The
dielectric res ponse times were calculated u sing the critical peak frequency in a correspon ding Debye plot of
Tan Delta (loss factor/permittivity) vs. log frequency. The DEA revealed the response times (tau, τ) in ms.
The Fludicon® ERF was DEA durable (repeat cycles produced same results) and the τ was temperature de-
pendent: 16 ms at 25˚C and 0.16 ms at 80˚C. The Cellulose ERF was somewhat DEA durable and the τ was
5.5 ms at 25˚C and 0.21 ms at 80˚C. The response times were logarithmic with the temperature (˚C) with a
correlation coefficient of >0.98 for the Cellulose and Fludicon® ERFs. The Polyaniline ERF had a τ of 53
ms at 25˚C in the 1st DEA run and there was no indication of a τ for the remaining DEA tests.
Keywords: ERF, Tan Delta, DEA, Fibrillation, Debye Plot, Response Time
1. Introduction and Background
Electrorheological fluids (ERFs) are generally suspen-
sions of high dielectric constant electrically polarizable
particles in non-conducting base fluids with a low di-
electric constant. ER active materials are generally po-
lymers, ceramics, metals or composites such as cellulose,
starch, titanium oxide, polyurethanes and polyanilines
[1-5]. In the presence of an external AC electric field,
typically a few kilovolts per millimeter, these ER active
particles are polarized due to the dielectric difference
between the suspended particles and the base fluid [6].
The field-induced dipoles on the particles cause them to
align and form chains or fibrillated structures that bridge
the electrode gap. The formation of chains or fibrillation
result in a large and reversible increase in the apparent
viscosity (see Figure 1) that can be easily adjusted by
controlling the strength of the applied electric field.
Ever since the discovery of the ER concept by Willis
Winslow (1949) in the late 1930s [7], a tremendous
amount of research on various applications of ERFs has
been going on in university and industrial labs due to
their potential use as rapid, infinitely variable interfaces
between electrical and mechanical components of intel-
ligent systems [8-11]. ERFs are now used in many in-
dustrial applications, i. e. hydraulic valves, clutches,
brakes, and shock absorbers. Although utilization of ER
technology in current medical device development ap-
plications is low, the interest has been growing in recent
years. Less agglomeration, low power consumption, bet-
ter dispersability and faster response, favorable in milli-
seconds, to an applied field are all important factors for
Field of f
Field on
Figure 1. Particle fibr illation of Fludicon® RheOil 3.0 ERF.
Imaged at Riga imaging facility.
N. I. PERERA ET AL.
Copyright © 2011 SciRes. AJAC
86
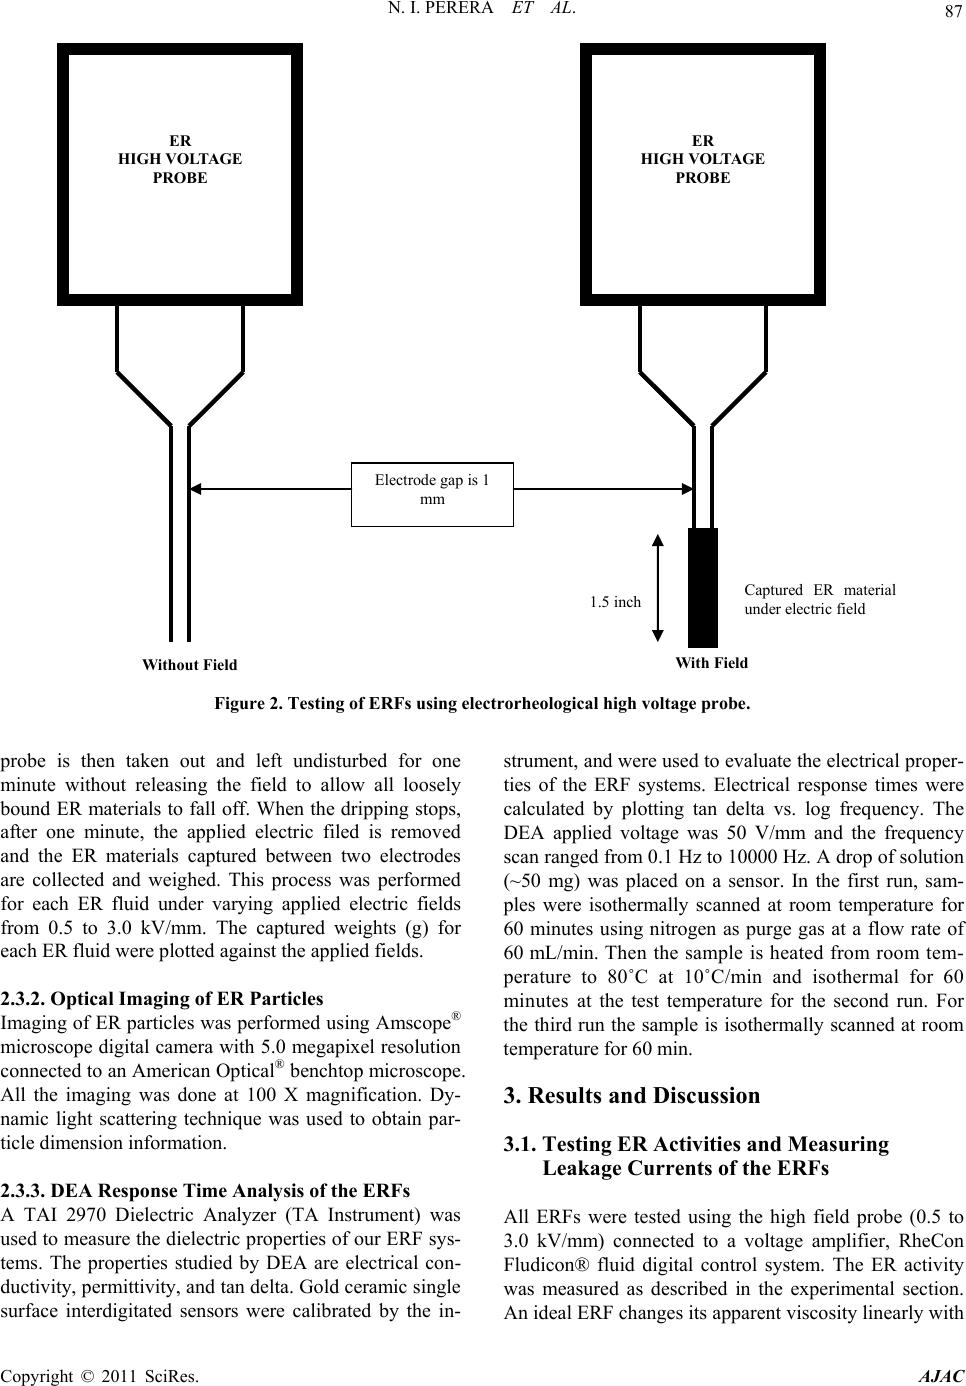
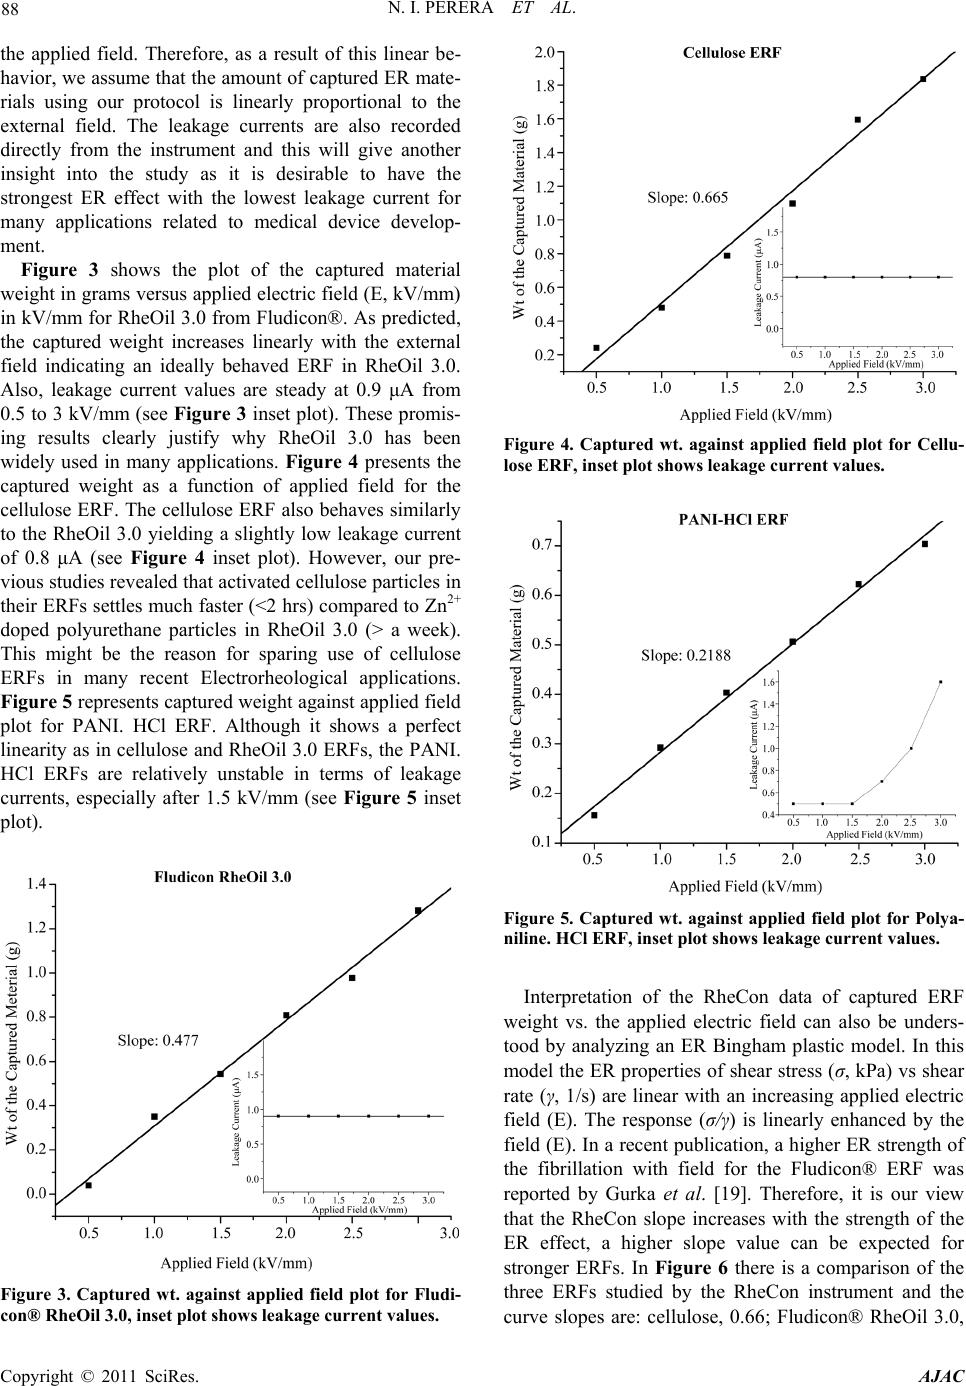
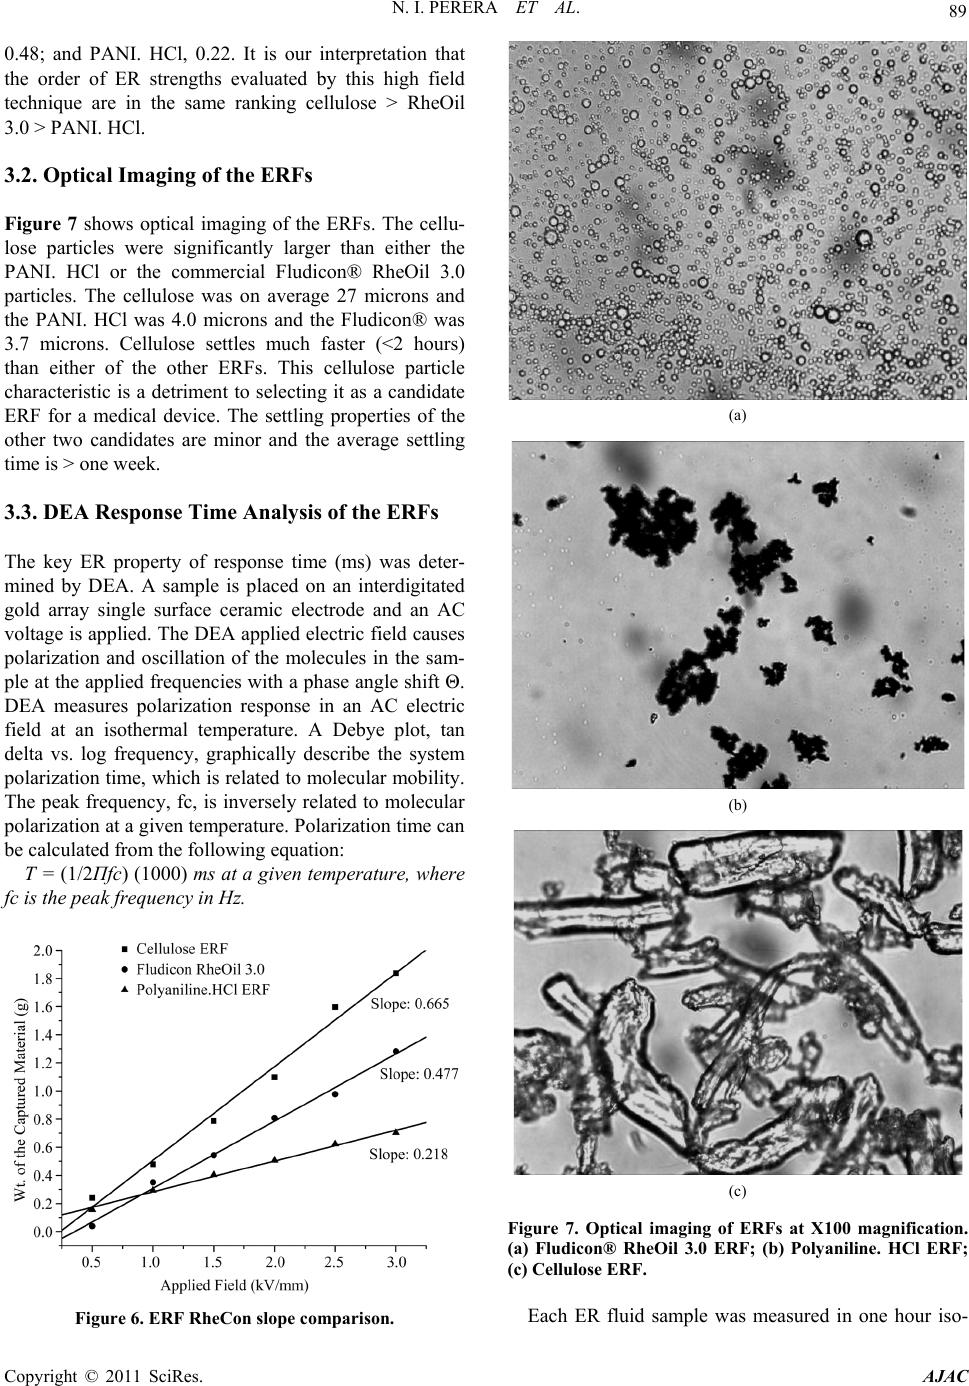
an ideal ERF. The results of the ideal behavior are being
considered for use in device development applications.
Of all the above mentioned ERF qualities, the response
time is a significant parameter that should be considered
for many applications when selecting a suitable ERF.
Therefore, accurate measurement of ERF response time
is crucial. There are many methods currently available in
the market that can be employed to measure ER response
time effectively and accurately, the DEA method devel-
oped by Riga et al. is promising in terms of experimental
time [12], cost and repeatability. DEA is a widely used
thermal analytical method that measures polarization
response in an AC electric field at isothermal tempera-
tures or by scanning temperature techniques [13-16]. A
Debye plot of Tan Delta, a ratio of d ielectric los s divided
by the relative permittivity, versus frequency can fix the
limits of ER active particle polarization or relaxation
time. The ER response time in a commercial ERF is di-
rectly related to the polarization time, which is inversely
related to the critical peak frequency in the Debye plot.
In the present work, we analyzed DEA response times
in three widely used ERFs and their suitability for using
in medical device development applications. The ERFs
used in this study are Polyaniline Hydrochloride (PANI-
HCl), Cellulose and Fludicon® RheOil 3.0 from the Flu-
dicon® Cooperation, Germany. PANI-HCl ERFs were
selected in this study mainly due to their favorable sta-
bility, adjustable conductivity, controllable particle size,
low density and hardness, which are all good qualities
for many applications. Cellulose ERFs exhibit most of
the above mentioned properties in addition to relatively
low cost and ease of synthesis. The key advantage of
including Fludicon® RheOil 3.0, which contains polyu-
rethane particles doped with Zn2+ in silicone oil, in this
study is that it is a commercialized product and has al-
ready been used in device development applications
[17,18].
2. Experimental Procedure
2.1. Chemicals and Commercial ERFs
All materials needed for ERF synthesis, Aniline (Cat#
242284), Hydrochloric Acid (Cat# H1758), Microgranular
Cellulose (Cat# C6413), Ethylene Glycol (Cat# 3 24558),
Ammonium Persulfate (Cat# A3678), 5 cSt Silicone Oil
(Cat #317667), SPAN 85 surfactant were reagent grade
and purcha s ed from Sigma-Aldrich. Deionized water was
obtained from a Barnstead ultra pure water purification
system (specific resistance >18.2 MΩ/cm). Fludicon®
RheOil 3.0 was purchased from Fludicon® Cooperation
in Germany.
2.2. Procedures and Appa ratus
2.2.1. Preparation of Cellulose ERF
Cellulose ERFs were prepared using a standard protocol.
Briefly, cellulose polymers were heated in an oven over-
night at 120˚C. The dried cellulose was then placed in a
desiccator until it came to room temperature. Next, 30%
dried cellulose, 3.0% anhydrous ethylene glycol, 2%
SPAN 85® were ball milled overnight in 5 cSt silicone
oil. The final ERF was collected in a glass container and
left in a desiccator until used.
2.2.2. Preparation of Polyaniline ERF
Synthesis and Purification of Polyaniline-HCl ( PA NI-
HCl) 500 mL of 1M Aniline in 1M HCl was mixed with
500 mL of 1M Ammo nium Persulfate in a beaker at 0˚C.
The reaction mixture was gently stirr ed and left at rest to
polymerize overnight. Next day, the PANI precipitate
was collected on a filter paper, washed three times with
0.1 M NH4OH, and similarly with deionized water. The
resultant PANI. HCl was dried in an oven at 120˚C for
48 hours, and then placed in a desiccator until needed.
PANI. HCl structure was confirmed using IR spectros-
copy.
2.3. Preparation of the PANI. HCl ERF
pH of the previously synthesized PANI-HCl was ad-
justed to a desired pH (e.g. 7.0) by doping and d e-doping
with NH4OH and HCl. After doping/de-doping process,
the PANI. HCl was collected on a filter paper, washed
three times with deionized water, and similarly with
Methanol. Next, the pH adjusted PANI. HCl was dried in
an oven for 48 hours at 120˚C.
The ER fluid was prepared by dispersing the PANI. HCl
in silicone oil in the presence of the SPAN 85 surfactant.
The final ER fluid was obtained by ball milling PANI,
SPAN 85 and 5 cSt silicone oil for 4 hours. The compo-
sition of the final ERF was 15% wt PANI, 3% wt SPAN
85 in 5 cSt silicone oil.
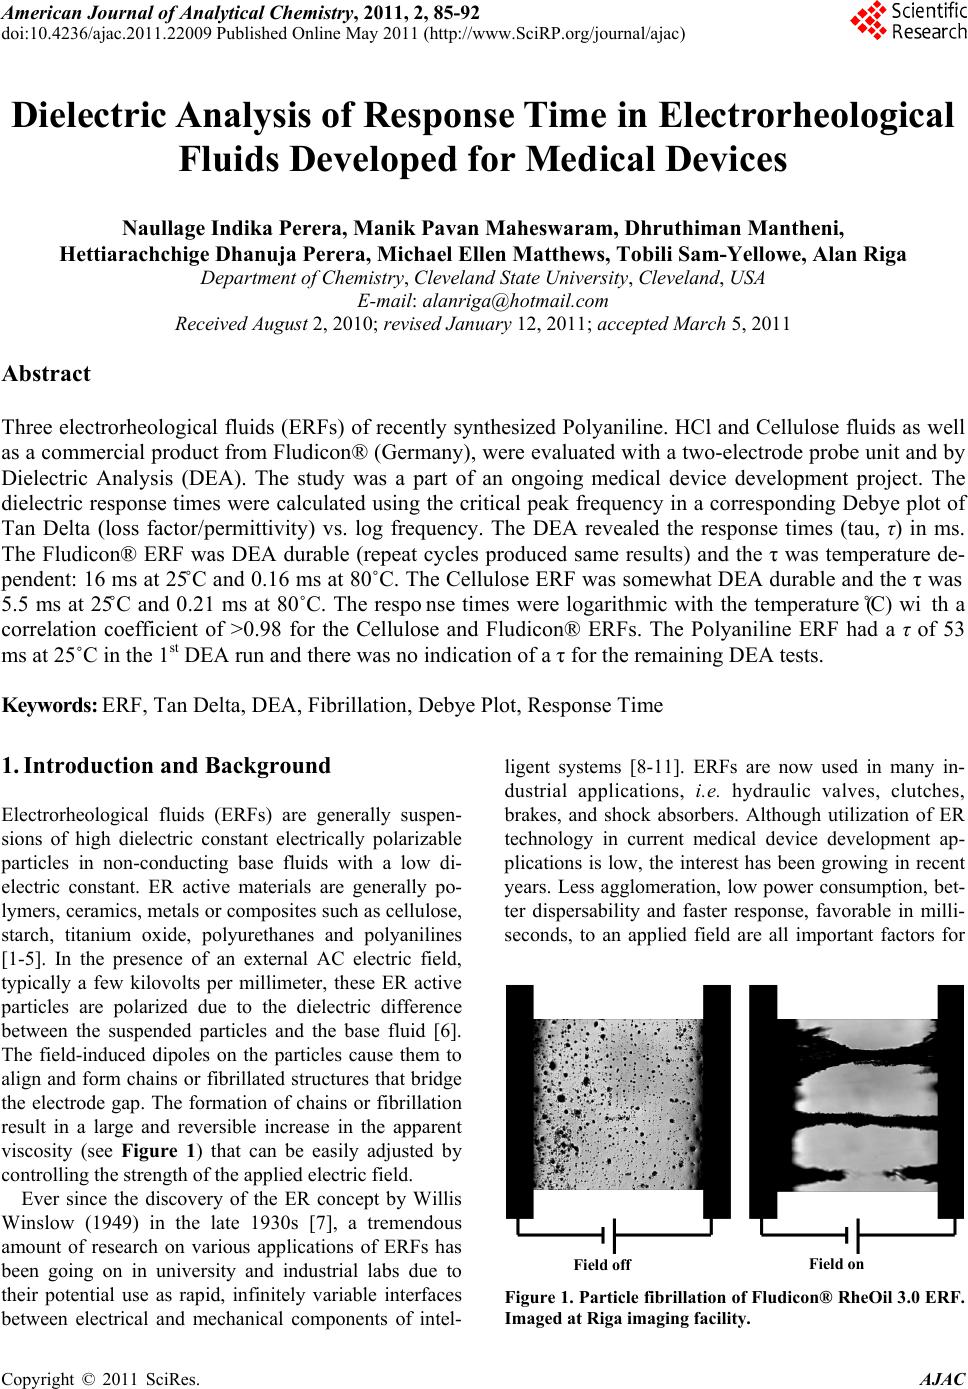
2.3.1. Testing ER Fluids for ER Activity
ER effects and leakage currents of all the ER fluids used
in the study were measured at room temperature using an
Electrorheological high field probe (to 3.0 kV/mm) con-
nected to a voltage amplifier, a RheCon Fludicon® fluid
digital control system. The distance between the two
electrodes in the probe was set to 1.0 mm. We have de-
signed a novel protocol to measure ER activities in this
study and it is measured as follows. First, the high vol-
tage probe is dipped carefully into the ER fluid to a depth
of 38 mm (1.5 inches) (see Figure 2). Next, the elec-
trodes are charged with the variable electric field. The
N. I. PERERA ET AL.
Copyright © 2011 SciRes. AJAC
87
ER
HIGH VO LT A G E
PROBE
With Field
ER
HIGH VO LT A G E
PROBE
1.5 inch
Captured ER material
under electri c fi el d
Electrode gap is 1
mm
Figure 2. Testing of ERF s using electrorheological high voltage probe.
probe is then taken out and left undisturbed for one
minute without releasing the field to allow all loosely
bound ER materials to fall off. When the dripping stops,
after one minute, the applied electric filed is removed
and the ER materials captured between two electrodes
are collected and weighed. This process was performed
for each ER fluid under varying applied electric fields
from 0.5 to 3.0 kV/mm. The captured weights (g) for
each ER fluid were plotted against the applied fields.
2.3.2. Optical Imaging of ER Particles
Imaging of ER particles was performed using Amscope®
microscope digital ca mera with 5.0 megapixel resolution
connected to an American Optical® benchtop microscope.
All the imaging was done at 100 X magnification. Dy-
namic light scattering technique was used to obtain par-
ticle dimension information.
2.3.3. DEA Response Time Analysis of the ERFs
A TAI 2970 Dielectric Analyzer (TA Instrument) was
used to measure the dielectric properties of our ERF sys-
tems. The properties studied by DEA are electrical con-
ductivity, permittivity, and tan d elta. Gold ceramic sing le
surface interdigitated sensors were calibrated by the in-
strument, and were used to evalu ate the electrical proper-
ties of the ERF systems. Electrical response times were
calculated by plotting tan delta vs. log frequency. The
DEA applied voltage was 50 V/mm and the frequency
scan ranged from 0.1 Hz to 10000 Hz. A drop of solution
(~50 mg) was placed on a sensor. In the first run, sam-
ples were isothermally scanned at room temperature for
60 minutes using nitrogen as purge gas at a flow rate of
60 mL /min. Then the sample is heated from room tem-
perature to 80˚C at 10˚C/min and isothermal for 60
minutes at the test temperature for the second run. For
the third run the sample is isothermally scanned at room
temperature for 60 min.
3. Results and Discussion
3.1. Testing ER Activities and Measuring
Leakage Currents of the ERFs
All ERFs were tested using the high field probe (0.5 to
3.0 kV/mm) connected to a voltage amplifier, RheCon
Fludicon® fluid digital control system. The ER activity
was measured as described in the experimental section.
An ideal ERF changes its apparent viscosity linearly with
N. I. PERERA ET AL.
Copyright © 2011 SciRes. AJAC
88
the applied field. Therefore, as a result of this linear be-
havior, we assume that the amount of captured ER mate-
rials using our protocol is linearly proportional to the
external field. The leakage currents are also recorded
directly from the instrument and this will give another
insight into the study as it is desirable to have the
strongest ER effect with the lowest leakage current for
many applications related to medical device develop-
ment.
Figure 3 shows the plot of the captured material
weight in grams versus applied electric field (E, kV/mm)
in kV/mm for RheOil 3.0 from Fludicon®. As predicted,
the captured weight increases linearly with the external
field indicating an ideally behaved ERF in RheOil 3.0.
Also, leakage current values are steady at 0.9 μA from
0.5 to 3 kV/mm (see Figure 3 inset plot). These promis-
ing results clearly justify why RheOil 3.0 has been
widely used in many applications. Figure 4 presents the
captured weight as a function of applied field for the
cellulose ERF. The cellulose ERF also behaves similarly
to the RheOil 3.0 yielding a slightly low leakage current
of 0.8 μA (see Figure 4 inset plot). However, our pre-
vious studies revealed that activated cellulose particles in
their ERFs settles much faster (<2 hrs) compared to Zn2+
doped polyurethane particles in RheOil 3.0 (> a week).
This might be the reason for sparing use of cellulose
ERFs in many recent Electrorheological applications.
Figure 5 represents captured weight against app lied field
plot for PANI. HCl ERF. Although it shows a perfect
linearity as in cellulose and RheOil 3.0 ERFs, the PANI.
HCl ERFs are relatively unstable in terms of leakage
currents, especially after 1.5 kV/mm (see Figure 5 inset
plot).
Figure 3. Captured wt. against applied field plot for Fludi-
con® RheOil 3.0, inset plot shows leakage current values.
Figure 4. Captured wt. against applied field plot for Cellu-
lose ERF, inset plot shows leakage current values.
Figure 5. Captured wt. against applied field plot for Polya-
niline. HCl ERF, inset plot shows leakage current values.
Interpretation of the RheCon data of captured ERF
weight vs. the applied electric field can also be unders-
tood by analyzing an ER Bingham plastic model. In this
model the ER properties of shear stress ( σ, kPa) vs shear
rate (γ, 1/s) are linear with an increasing applied electric
field (E). The response (σ/γ) is linearly enhanced by the
field (E). In a recent publication, a higher ER strength of
the fibrillation with field for the Fludicon® ERF was
reported by Gurka et al. [19]. Therefore, it is our view
that the RheCon slope increases with the strength of the
ER effect, a higher slope value can be expected for
stronger ERFs. In Figure 6 there is a comparison of the
three ERFs studied by the RheCon instrument and the
curve slopes are: cellulose, 0.66; Fludicon® RheOil 3.0,
N. I. PERERA ET AL.
Copyright © 2011 SciRes. AJAC
89
0.48; and PANI. HCl, 0.22. It is our interpretation that
the order of ER strengths evaluated by this high field
technique are in the same ranking cellulose > RheOil
3.0 > PANI. HCl.
3.2. Optical Imaging of the ERFs
Figure 7 shows optical imaging of the ERFs. The cellu-
lose particles were significantly larger than either the
PANI. HCl or the commercial Fludicon® RheOil 3.0
particles. The cellulose was on average 27 microns and
the PANI. HCl was 4.0 microns and the Fludicon® was
3.7 microns. Cellulose settles much faster (<2 hours)
than either of the other ERFs. This cellulose particle
characteristic is a detriment to selecting it as a candidate
ERF for a medical device. The settling properties of the
other two candidates are minor and the average settling
time is > one week.
3.3. DEA Response Time Analysis of the ERFs
The key ER property of response time (ms) was deter-
mined by DEA. A sample is placed on an interdigitated
gold array single surface ceramic electrode and an AC
voltage is applied. The DEA applied electric field causes
polarization and oscillation of the molecules in the sam-
ple at the applied frequencies with a phase angle shift Θ.
DEA measures polarization response in an AC electric
field at an isothermal temperature. A Debye plot, tan
delta vs. log frequency, graphically describe the system
polarization time, which is related to molecular mobility.
The peak frequency, fc, is inversely related to molecular
polarization at a given temperature. Polarization time can
be calculated from the following equation:
Τ = (1/2Πfc) (1000) ms at a given temperature, where
fc is the peak frequency in Hz.
Figure 6. ERF RheCon slope comparison.
(a)
(b)
(c)
Figure 7. Optical imaging of ERFs at X100 magnification.
(a) Fludicon® RheOil 3.0 ERF; (b) Polyaniline. HCl ERF;
(c) Cellulose ERF.
Each ER fluid sample was measured in one hour iso-
N. I. PERERA ET AL.
Copyright © 2011 SciRes. AJAC
90
thermal sequences of 25, 80 and 25˚C (for a total of 3
hours). We consider ERFs to be response time durable if
the first and third runs are similar within 1 ms. Figure 8
shows DEA curves of tan delta versus frequency for the
Fludicon® RheOil 3.0 ERF. The calculated response
time (τ) fo r the Fludicon® ERF was 15 ms at 25˚C in the
first run and 0.16 ms in the second run at 80˚C. However,
in the third run again at 25˚C a similar response time
(16 ms) to the first one was reported. This data clearly
indicates the Fludicon® RheOil 3.0 is a DEA durable
ERF and the response time is strongly influenced by the
temperature. Also, the obtained DEA response times at
25˚C were very close to the published response time of
12 ms at 25˚C [20]. The Cellulose ERF shows somewhat
durability giving 5.5 ms at 25˚C in the first run and 1.6
ms in the third run. Settling in the ERF may be the cause
for the lack of reproducibility for the Cellulose ERF. As
seen in the Fludicon® ERF, the response times were
strongly temperature dependant for the Cellulose ERF
giving 0.21 ms at 80˚C (see Figure 9). The response
times were logarithmic with the temperature (˚C) with a
correlation coefficient of >0.98 for the Cellulose and
Fludicon® ERFs. The Polyaniline.HCl ERF had a rela-
tively slow response of 53 ms at 25˚C in the first DEA
run and there was no indication of a τ for the remaining
DEA tests (see Figure 10).
Response Time in ms
25˚C - 1st, 3rd Runs 16 ms
Response Time in ms
80˚C - 3rd Run 0.16 ms
62.76 min
79.99˚C
996.4 Hz
0.5872
3rd Run 25˚C
0.64 min
10.04 Hz
1.327
2nd Run 80˚C
1st Run 25˚C
Freq uency (Hz)
Univ e rsal V4.5A TA I ns tr um ents
0.1
1 10 100
1000 10000
Tan Delta
3.0
2.5
2.0
1.5
1.0
0.5
0.0
Figure 8. DEA response ti me analysis for Fludicon® RheOil 3.0 ERF.
Run 2 at 80˚C
peak frequency 750 Hz
Resp o ns tim e 0.21 ms
Frequen cy (Hz)
Univ e rsal V3.9A TA I nst r um ents
10
100
1000 10000
Tan Delta
0.6
0.0
0.4
0.2
0.2
Run 1 at 25˚C
peak frequency 29 Hz
Resp o ns tim e 5.5 ms
Run 3 at 25˚C
peak frequency 100 Hz
Resp o ns tim e 1.6 ms
Figure 9. DEA response time analysis for Cellulose E RF.
N. I. PERERA ET AL.
Copyright © 2011 SciRes. AJAC
91
Polyaniline Tan Delta vs Log frequency
peak s a t 1 and 3 Hz
Temp 25˚C for 1Hr
Respon se tim e 5 3 ms
Response time 160 ms at 25˚C
1.08 min
86.69 Hz
1.286
3rd Run 25˚C
2nd Run 80˚C
1st Run 25˚C
Frequen cy (Hz)
Univ e rsal V4.5A TA I ns tr um ents
0.1
1
10 100
1000 10000
Tan Delta
8
6
4
2
0
0.41 min
3.065 Hz
5.961
0.28 min
0.9880 Hz
6.569
0.33 min
1.002 Hz
0.1209
Figure 10. DEA response time analysis for Polyaniline. HCl ERF.
4. Conclusions
Evaluation of the physical-chemical and electrical prop-
erties of recently synthesized and purchased ERFs re-
vealed that the commercial Fludicon® RheOil 3.0, po-
lyurethane particles coated with Zinc2+ ions, was the b est
candidate in terms of response time (16, 0.16 and 15 ms),
durability, particle size and settling. Although the Cellu-
lose ERF showed promising response time values (5.5,
0.21 and 1.6 ms), larger particle size and fast settling
significantly limits the usability in many ERF applica-
tions. The PANI. HCl ERF system did not produce cha-
racteristics that would allow recommendation as a can-
didate fluid.
5. Acknowledgements
We would like to acknowledge the Third Frontier State
of Ohio Research Program (2008-2010), the Office of
Sponsored Programs and Research and the College of
Science, Cleveland State University for their support and
funding.
6. References
[1] J. Wei, L. Zhao, S. Peng, J. Shi, Z. Liu and W. Wen,
Wettability of Urea-Doped TiO2 Nanoparticles and
Their High Electrorheological Effects,” Journal of
Sol-Gel Science and Technology, Vol. 47, No. 3, 2008, pp.
311-315. doi:10.1007/s10971-008-1787-z
[2] T. Tilki, M. Yavuz, C. Karabacak, M. Cabuk and M.
Ulutuerk, “Investigation of Electrorheological Properties
of Biodegradable Modified Cel lul ose/Corn Oil Suspen-
sions,” Carbohydrate Research, Vol. 345, No. 5, 2010,
pp. 672-679. doi:10.1016/j.carres.2009.12.025
[3] D. P. Park, J. Y. Hwang, H. J. Choi, C. A. Kim and M. S.
Jhon, “Synthesis and Characterization of Polysaccharide
Phosphates Based Electrorheological Fluids,” Materials
Research Innovations, Vol. 7, No. 3, 2003, pp.
161-166. doi:10.1007/s10019-003-0242-6
[4] J. Yin, X. Zhao, X. Xia, L. Xiang and Y. Qiao, “Elec-
trorheological Fluids Based on Nano-Fibrous Polyani-
line,” Polymer, Vol. 49, No. 20, 2008, pp. 4413-4419.
doi:10.1016/j.polymer.2008.08.009
[5] Y. Liu and P. P. Phule, “Structure Formation in Novel
Electrorheological (ER) Fluids Based on Ultrafine Par-
ticles of Electronic Ceramics,” Polymer Preprints (Ame-
rican Chemical Society, Division of Polymer Chemistry),
Vol. 35, No. 2, 1994, pp. 347-348.
[6] D. Kittipoomwong, D. J. Klingenberg, Y. M. Shkel, J. F.
Morris and J. C. Ulicny.Transient Behavior of Elec-
trorheological Fluids in Shear Flow,” Journal of Rheolo-
gy, Vol. 52, No. 1, 2008, pp. 225-241.
doi:10.1122/1.2794803
[7] W. M. Winslow, “Induced Fibrillation of Suspensions,”
Journal of A p plied P hy sics, Vol. 20, No. 12, 1949, pp.
1137-1140. doi:10.1063/1.1698285
[8] Z. P. Shulman, R. Gorodkin, E. Korobko and V. Gleb.
The Electrorheological Effect and Its Possible Uses,”
Journal of Non-Newtonian Fluid Mechanics, Vol. 8, No.
1-2, 1981, pp. 29-41. doi:10.1016/0377-0257(81)80003-1
[9] J. P. Coulter, K. D. Weiss and J. D. Carlson, “Engineer-
ing Applications of Electrorheological Materials,” Jour-
nal of Intelligent Material Systems and Structures, Vol. 4,
No. 2, 1993, pp. 248-259.
doi:10.1177/1045389X9300400215
[10] J. W. Pialet and K. O. Havelka. “Electrorheological Tech-
nology: The Future is Now,” Chemtech, Vol. 26, 1996,
N. I. PERERA ET AL.
Copyright © 2011 SciRes. AJAC
92
pp. 3645-3653.
[11] C. F. Zukoski, “Material Properties and the El ect r o rheo-
logical Response,” Annual Review of Mat erials Science,
Vol. 23, 1993, pp. 45-78.
doi:10.1146/annurev.ms.23.080193.000401
[12] A. T. Riga and L. Judovits, “Material Characterization by
Dynamic and Modulated Thermal Analytical Tech-
niques,” ASTM Special Technical Publication, USA, 2001.
[13] L. Nunez-Regueira, S. Gome z-Barreiro and C. A. Gra-
cia-Fernandez, “Study of the Influence of Isomerism on
the Curing Properties of the Epoxy Sy stem DGEBA (n =
0)/1,2 DCH by DEA and MDSC,” Journal of Thermal
Analysis and Calorimetry, Vol. 82, No. 3, 2005, pp.
797-801. doi:10.1007/s10973-005-0966-1
[14] C. M. Kinart, W. J. Kinart, D. Checinska-Majak and A.
Bald, “Densities and Relative Permittivities for Mixtures
of 2-Methoxyethanol with DEA and TEA, at Various
Temperatures,” Journal of Thermal Analysis and Calo-
rimetry, Vol. 75, No. 1, 2004, pp. 347-354.
doi:10.1023/B:JTAN.0000017355.26845.a4
[15] N. Zanati, M. E. Mathews, N. I. Perera, J. J. Moran, J. A.
Boutros, A. T. Riga and M. Bayachou, “Cholesterol Le-
vels and Activity of Membrane Bound Proteins: Charac-
terization by Thermal and Electrochemical Methods,”
Journal of Thermal Analysis and Calorimetry, Vol. 96,
No. 3, 2009, pp. 669-672.
doi:10.1007/s10973-009-0032-5
[16] M. E. Matthews, I. Atkinson, L. Presswala, O. Najjar, N.
Gerhardstein, R. Wei, E. Rye and A. T. Riga, “Dielectric
Classification of D and L Amino Acids by Thermal and
Analytical Methods,” Journal of Thermal Analysis and
Calorimetry, Vol. 93, N o. 1, 2008, pp. 281-287.
doi:10.1007/s10973-007-8835-8
[17] L. Johnston, “ Electrorheological Dampers for Industrial
and Mobile Applications—An Overview of Design Vari-
ations, Product Realisation and Performance,” Proceed-
ings of the 11th International Conference on New Actua-
tors, Bremen, 9-11 June 2008, p. 499.
[18] S. Schneider, K. Holzmann, W. Kemmet müller, L.
Johnston and D. Lißman, “Development and Testing of a
Semi-Active Suspension System for Off-Road Trucks
Using Electrorheological Dampers,” Proceedings of the
11th International Conference on New Actuators, Bre-
men, 9-11 June 2008, p. 485.
[19] M. Gurka, D. Adams, L. Johnston and R. Petricevic,
New Electrorheological Fluids—Characteristics and Im-
plementation in Industrial and Mobile Applications,”
Journal of Physics: Conference Series, Vol. 149, No. 1
2009, Article ID 012008.
[20] S. Ulrich, G. Böhme and R. Bruns. “Measuring the Re-
sponse Time and Static Rheological Properties of Elec-
trorheological Fluids with Regard to the Design of Valves
and Their Controllers,” Journal of Physics: Conference
Series, Vol. 149, No. 1, 2009, Article ID 012031.