Open Journal of Physical Chemistry, 2013, 3, 170-176
Published Online November 2013 (http://www.scirp.org/journal/ojpc)
http://dx.doi.org/10.4236/ojpc.2013.34021
Open Access OJPC
Effect of Temperature on Separation of Sarin (GB) Ions in
Differential Mobility Spectrometry
Mirosław Maziejuk, Michał Ceremuga, Monika Szyposzyńska*, Tomasz Sikora
Wojskowy Instytut Chemii i Radiometrii, Warszawa, Poland
Email: *m.szyposzynska@wichir.waw.pl
Received June 10, 2013; revised July 8, 2013; accepted July 16, 2013
Copyright © 2013 Mirosław Maziejuk et al. This is an open access article distributed under the Creative Commons Attribution Li-
cense, which permits unrestricted use, distribution, and reproduction in any medium, provided the original work is properly cited.
ABSTRACT
Different environmental conditions in which, equipment based on differential ion mobility spectrometry must operate,
forced designers and engineers to analyze the impact of, among other things, external factors on their performance and
efficiency. These devices, thanks to the DMS technology, can identify and characterize the ions contained in the gase-
ous state. However, many areas of this technique remain undiscovered, which should be examined in more detail. One
such aspect is the influence of the temperature of gaseous medium, containing tested analyte. The research presented in
this article shows why temperature is an important factor on the distribution of generated peaks. The results are shown
for different spectra generated carrier gas temperatures (50˚C - 80˚C) in which ions were toxic warfare agents. Based on
those graphs, it can be stated that increase of the temperature allows for better separation of the peaks from the back-
ground. Because of the similar ion mobility of the analyte and background ions for high and low electric field, DMS
device can send false alarms, due to the poor interpretations of passing a signal to them. So to be able to accurately as-
sess the level of risk due to the presence of substances BST in air, the test medium was added to isobutanol and isopro-
panol additives. They help better analyze and separate measured ions.
Keywords: DMS; Spectrometry; Ion Mobility
1. Introduction
Current knowledge of the DMS method has been de-
scribed in various publications, however, this article will
present the basic phenomena that took part in the exami-
nations. Method of differential ion spectrometry has been
recognized as a powerful tool for the separation and
characterization of ions present in the gas phase. Ion mo-
bility spectrometry (IMS) is now one of the best tech-
niques for chemical warfare agent’s detection [1-4] espe-
cially differential mobility spectrometry (DMS) [5-10].
In the past, DMS was called field asymmetric waveform
ion mobility spectrometry (FAIMS) [11,12]. DMS is a
special method used in ion separation based on differ-
ence in ion mobility in high and low electric field under
atmospheric pressure [13]. Relation between mobility
of ions and electric field may be described by Equation
(1):
 
01
K
EN KEN



(1)
where:
K—ion mobility, cm2/V·s,
ectric field strength, V/cm,
2·s],
of Townsend,
[T
ion
tra
E—el
K0—reduced mobility [cm/V
E/N—electric field expressed in units
,17 2
d] (1 Td = 1·10 V·cm),
α(E/N)—function characterized by mobility field.
Mobility of the ions depends on mass and charge of
the ion and flow rate of carrier gas. The schema of
nsfer in the DMS chamber is presented in the Figure 1.
Under alternating electric field applied to the electrodes,
some of the ions in the chamber are intercepted. Chang-
ing values of compensated electric field, it may be used
as specific ion filter [14,15].
Stability and repeatability of spectra obtained by DMS
have a great meaning in chemical analysis. Pressure and
temperature of carrier gas have an influence on the ion
mobility and peak shifts on the spectra. The main goal of
this work was investigation of influence of temperature
on the resolution and separation of the ions chemical
warfare agents on the example of sarin (GB).
*Corresponding author.
M. MAZIEJUK ET AL. 171
Figure 1. Scheme of ions flow through DMS spectrometer.
2. Experimental
used sarin synthesized in WIChiR in
hemicals Synthesis Covered by the Con-
ditions
MS
ant carrier gas (c
=
ce of sarin, the proton affinity of the con-
ater than the water in the proton transfer
2
Sample response graphs for sarin DMS obtained for
two carrier gas temperatures without additives is shown
in
he monomer and dimer of the
sample.
a dimer of sarin (GB)2H can be observed for
hi
rds higher voltage CV (Fig-
ur
sobutanol. The peaks shift was observed
fr
2.1. Analyte
In the studies was
Laboratory of C
vention on the Prohibition of Chemical Weapons.
WIChiR has the authority to work with toxic warfare
agents under the Concession No. B-007/2004. The con-
centration of sarin in the air was 60 mg/m3.
2.2. Apparatus and Measurement Con
Measurements were carried out using ceramic D
whose diagram is shown in Figure 2.
Measurements were carried out using air as a carrier
gas, isopropanol and isobutanol as a dop
8 mg/m3), the temperature of ambient gas: 50˚C, 60˚C,
70˚C and 80˚C, and ions (H2O) nH+ (for positive ions)
and O2-(H2O) n (for negative ions) as a reactive ions RIP
(reactant ion peak) generator voltage electric field HSV
(high separation voltage) 890 V.
3. Results
In the presen
nection is gre
reaction is formed protonated monomer GBH+. If the
concentration of the sample is large, then the protonated
monomer reacts with another molecule to form a dimer
of sarin (GB)2H+.

GBH OHGBHnH O


2
n
2
GBHGBGB H


Figures 3 and 4. The spectral peaks are visible ions
With increasing of the temperature there is a shift of
the peaks from the dimer and monomer of sarin towards
higher compensation voltage CV. In all cases, only the
peak from+
derived from the reaction, t
gh voltage of HSV. The monomer peak GBH+ is not
shown above 950 V voltage HSV with carrier gas at a
temperature of 70˚C or above 900 V for a temperature of
80˚C. Different results were obtained with sarin, when
the carrier gas contained additional small amount of iso-
propanol (Figures 5 and 6).
On the spectrum of DMS (Figure 5) is a clear peak of
the monomer and dimer of sarin, while isopropanol peak
is barely visible. The increase in temperature causes a
slight shift of the peaks towa
e 6). The high temperature peak from isopropanol is
absent above 750 V HSV. The biggest shifts were ob-
served when carrier gas was doped with isobutanol. (Fig-
ures 7 and 8).
Dependence of CV on the temperature for the mono-
mer and dimer of sarin is presented on Figure 9. Greatest
influence of the temperature was noticed when carrier
gas contained i
om value 6.8 V for monomer and 4 V for dimer
(temperature 50˚C) up to value 2.3 V for monomer and
0.6 V for dimer (temperature 80˚C). Curve obtained for
the soman dimer is very interesting at many aspects. In
the absence of additive in the carrier gas, dimer peak
occurs at the positive voltage CV. After the introduction
of dopants into a carrier gas there is a shift towards the
negative peak voltage CV.
Shift of the peaks in the positive voltage CV is associ-
ated with the formation of clusters. Declusterization of
ions causes movement in the direction of the negative
peak voltage CV.
Open Access OJPC
M. MAZIEJUK ET AL.
172
Figure 2. Scheme of DMS spectrometer.
Figure 3. Differential mobility spectra of sarin, gas temperature 50˚C, without dopant.
Differential ion spectrometry is well suited to present
the shape of the ion—if it is asymmetrical, such as water
m
of asymmetry of the ion, henperature
for different ions should be described individually and
m-
ical IMS. DMS advantage is the abil-
esolution, higher sensitivity, and re-
of the spectrometer. One of the factors affecting the per-
DGBDGB,D-isopropanol lubisobutanol


declusterization clusterization

*
+
22
DGB GBDGBD-HGBH




olecule (dipole shape) then the coefficient α is changed
to a greater extent (greater shift to higher negative volt-
age) through an increase in the ion temperature is gener-
ally asymmetric ion reduction process, and the higher
asymmetry allows the use of dopants. Furthermore, an
additional request for a differential ion spectrometry is
not a classic application of the theory of the effect of
temperature on the position of the peak K = Ko * T/273
because in this case there is explored m/z but the degree
may be another parameter describing the type of ions.
4. Conclusions
Our studies have confirmed that the chamber construc-
tion DMS allows achieving better performance co
ce the effect of tem
pared with the class
ity to get a better r
duction of the number of false signals. As these parame-
ters could be reached, it was necessary to examine how
changing weather conditions will affect the performance
Open Access OJPC
M. MAZIEJUK ET AL. 173
Figure 4. Differential mobility spectra of sarin, gas temperature 80˚C, without dopant.
Figure 5. Differential mobility spectra of sarin, gas temperature 50˚C, dopant isopropanol.
Open Access OJPC
M. MAZIEJUK ET AL.
174
Figure 6. Differential mobility spectra of sarin, gas temperature 80˚C, dopant isopropanol.
Figure 7. Differential mobility spectra of sarin, gas temperature 50oC, dopant isobutanol.
Open Access OJPC
M. MAZIEJUK ET AL. 175
Figure 8. Differential mobility spectra of sarin, gas temperature 80oC, dopant isobutanol.
Figure 9. Compenstion voltage CV as a function of gas temperature.
Open Access OJPC
M. MAZIEJUK ET AL.
Open Access OJPC
176
formance of the device is the temperature outside.
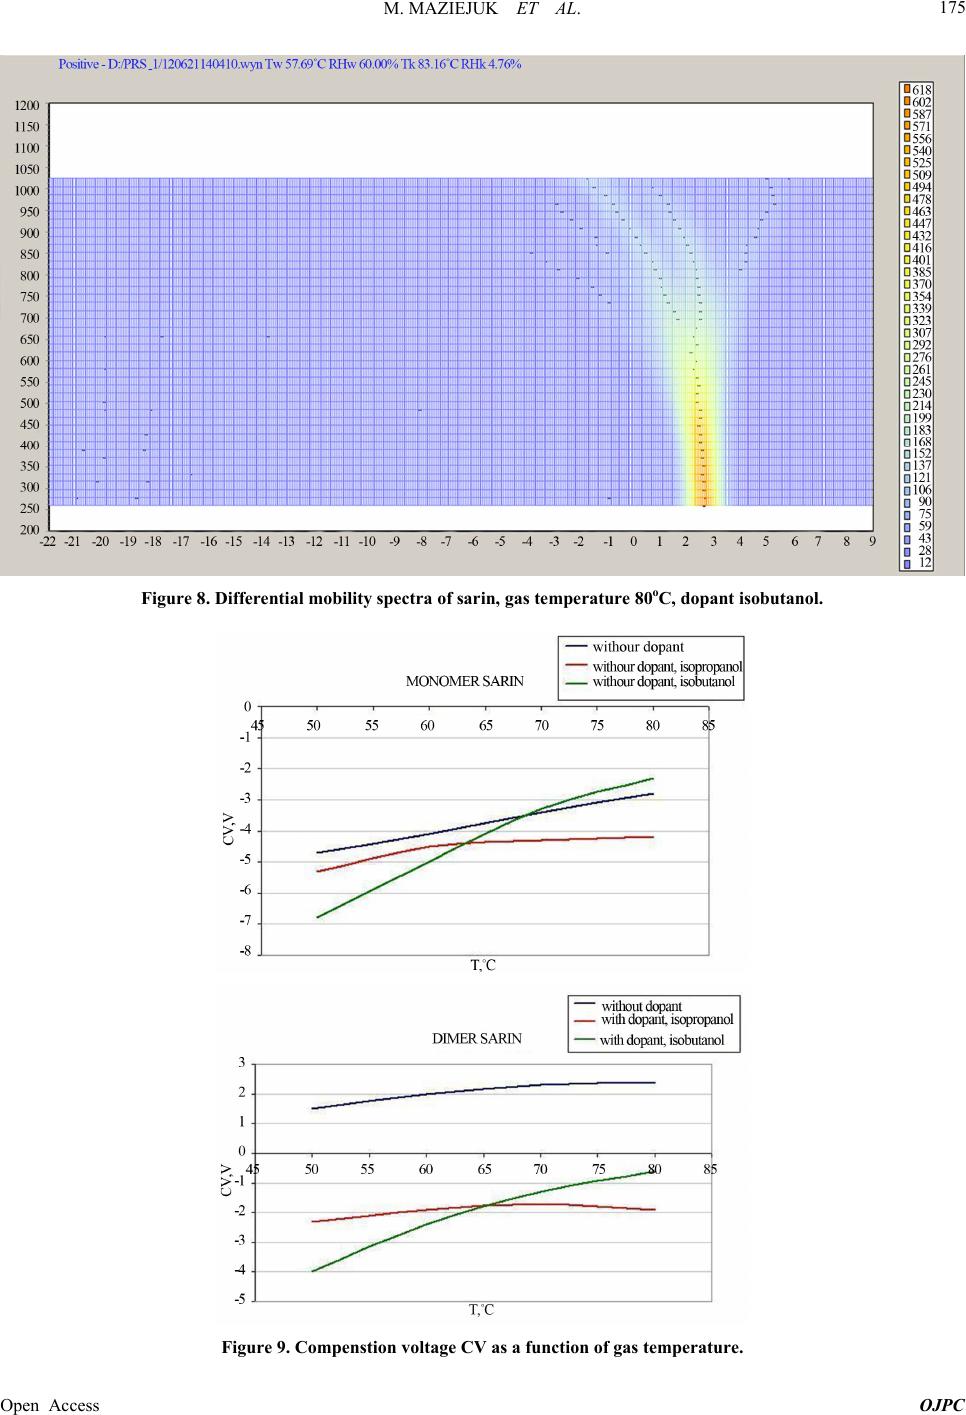
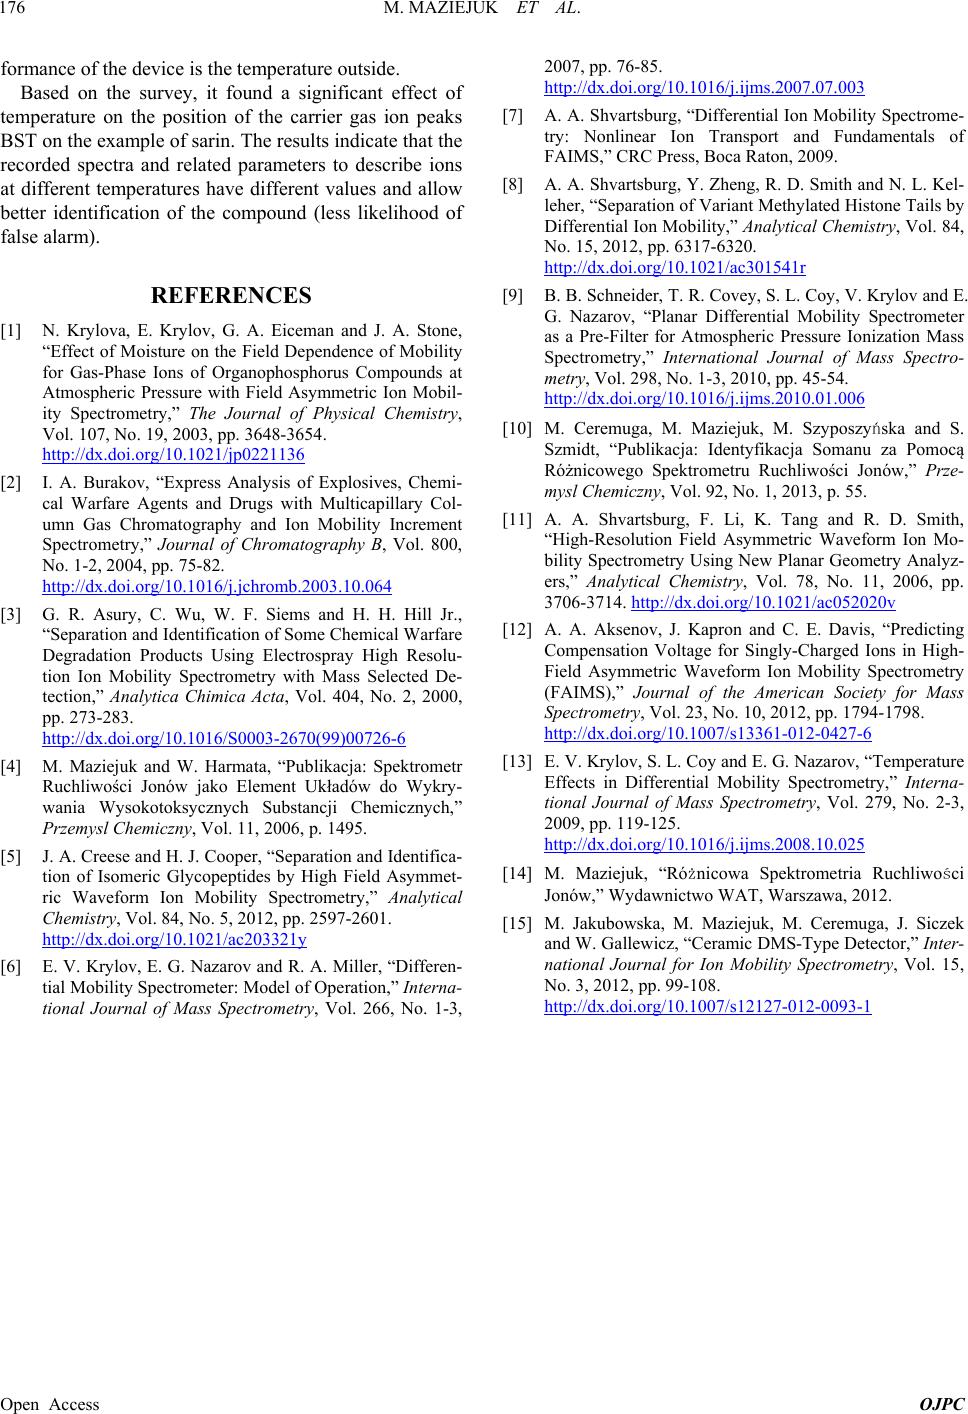
Based on the survey, it found a significant effect of
temperature on the position of the carrier gas ion peaks
BST on the example of sarin. The results indicate that the
recorded spectra and related parameters to describe ions
at different temperatures have different values and allow
better identification of the compound (less likelihood of
false alarm).
REFERENCES
[1] N. Krylova, E. Krylov, G. A. Eiceman and J. A. Stone,
“Effect of Moisture on the Field Dependence of Mobility
for Gas-Phase Ions of Organophosphorus Compounds at
Atmospheric Pressure with Field Asymmetric Ion Mobil-
ity Spectrometry,” The Journal of Physical Chemistry,
Vol. 107, No. 19, 2003, pp. 3648-3654.
http://dx.doi.org/10.1021/jp0221136
[2] I. A. Burakov, “Express Analysis of Explosives, Chemi-
cal Warfare Agents and Drugs with Multicapillary Col-
umn Gas Chromatography and Ion Mobility Increment
Spectrometry,” Journal of Chromatography B, Vol. 800,
No. 1-2, 2004, pp. 75-82.
http://dx.doi.org/10.1016/j.jchromb.2003.10.064
[3] G. R. Asury, C. Wu, W. F. Siems and H. H. Hill Jr.,
“Separation and Identification of Some Chemical Warfare
Degradation Products Using Electrospray High Resolu-
tion Ion Mobility Spectrometry with Mass Selected De-
tection,” Analytica Chimica Acta, Vol. 404, No. 2, 2000,
pp. 273-283.
http://dx.doi.org/10.1016/S0003-2670(99)00726-6
] M. Maziejuk and W. H
ykry-
[4 armata, “Publikacja: Spektrometr
Ruchliwości Jonów jako Element Układów do W
wania Wysokotoksycznych Substancji Chemicznych,”
Przemysl Chemiczny, Vol. 11, 2006, p. 1495.
[5] J. A. Creese and H. J. Cooper, “Separation and Identifica-
tion of Isomeric Glycopeptides by High Field Asymmet-
ric Waveform Ion Mobility Spectrometry,” Analytical
Chemistry, Vol. 84, No. 5, 2012, pp. 2597-2601.
http://dx.doi.org/10.1021/ac203321y
[6] E. V. Krylov, E. G. Nazarov and R. A. Miller, “Differen-
tial Mobility Spectrometer: Model of Operation,” Interna-
tional JournalVol. 266, No. 1-3
2007, pp. 76-85.
http://dx.doi.org/10.1016/j.ijms.2007.07.003
of Mass Spectrometry, ,
[7] A. A. Shvartsburg, “Differential Ion Mobility Spectrome-
try: Nonlinear Ion Transport and Fundamentals of
FAIMS,” CRC Press, Boca Raton, 2009.
[8] A. A. Shvartsburg, Y. Zheng, R. D. Smith and N. L. Kel-
leher, “Separation of Variant Methylated Histone Tails by
Differential Ion Mobility,” Analytical Chemistry, Vol. 84,
No. 15, 2012, pp. 6317-6320.
http://dx.doi.org/10.1021/ac301541r
[9] B. B. Schneider, T. R. Covey, S. L. Coy, V. Krylov and E.
G. Nazarov, “Planar Differential Mobility Spectrometer
as a Pre-Filter for Atmospheric Pressure Ionization Mass
Spectrometry,” International Journal of Mass Spectro-
metry, Vol. 298, No. 1-3, 2010, pp. 45-54.
http://dx.doi.org/10.1016/j.ijms.2010.01.006
[10] M. Ceremuga, M. Maziejuk, M. Szyposzyńska and S.
Szmidt, “Publikacja: Identyfikacja Somanu za Pomocą
żnicowego Spektrometru Ruchliwości Jonów,” Prze-
mysl Chemiczny, Vol. 92, No. 1, 2013, p. 55.
[11] A. A. Shvartsburg, F. Li, K. Tang and R. D. Smith,
“High-Resolution Field Asymmetric Waveform Ion Mo-
bility Spectrometry Using New Planar Geometry Analyz-
ers,” Analytical Chemistry, Vol. 78, No. 11, 2006, pp.
3706-3714. http://dx.doi.org/10.1021/ac052020v
[12] A. A. Aksenov, J. Kapron and C. E. Davis, “Predicting
Compensation Voltage for Singly-Charged Ions in High-
Field Asymmetric Waveform Ion Mobility Spectrometry
(FAIMS),” Journal of the American Society for Mass
Spectrometry, Vol. 23, No. 10, 2012, pp. 1794-1798.
http://dx.doi.org/10.1007/s13361-012-0427-6
E. G. Nazarov, “Temperature [13] E. V. Krylov, S. L. Coy and
Effects in Differential Mobility Spectrometry,” Interna-
tional Journal of Mass Spectrometry, Vol. 279, No. 2-3,
2009, pp. 119-125.
http://dx.doi.org/10.1016/j.ijms.2008.10.025
[14] M. Maziejuk,
Jonów,” Wydawnictwo WAT, Warszawa, 2012.
“Różnicowa Spektrometria Ruchliwości
[15] M. Jakubowska, M. Maziejuk, M. Ceremuga, J. Siczek
and W. Gallewicz, “Ceramic DMS-Type Detector,” Inter-
national Journal for Ion Mobility Spectrometry, Vol. 15,
No. 3, 2012, pp. 99-108.
http://dx.doi.org/10.1007/s12127-012-0093-1