Advances in Nanoparticles, 2013, 2, 372-377
Published Online November 2013 (http://www.scirp.org/journal/anp)
http://dx.doi.org/10.4236/anp.2013.24051
Open Access ANP
Characterization and Photocatalytic Efficiency of
Palladium Doped-TiO2 Nanoparticles
Ahmed A. Abd El-Rady1, Mahmmoud S. Abd El-Sadek2*#,
Mohamed M. El-Sayed Breky1, Fawzy H. Assaf1
1Chemistry Department, Faculty of Science, South Valley University, Qena, Egypt
2Nanomaterials Lab, Physics Department, Faculty of Science, South Valley University, Qena, Egypt
Email: *el_sadek_99@yahoo.com, Mahmoud.abdelsadek@sci.svu.edu.eg
Received August 26, 2013; revised October 9, 2013; accepted October 27, 2013
Copyright © 2013 Ahmed A. Abd El-Rady et al. This is an open access article distributed under the Creative Commons Attribution
License, which permits unrestricted use, distribution, and reproduction in any medium, provided the original work is properly cited.
ABSTRACT
The effect of modification of TiO2 with different palladium concentrations on its characteristics and photocatalytic effi-
ciency was studied. Photo catalysts were prepared by the sol-gel method and were characterized by different techniques.
A uniform distribution of palladium through the TiO2 matrix was observed. The X-ray diffraction patterns of the pure
and palladium doped TiO2 were found to be quiet similar and the average particle size was not significantly changed.
As a result of palladium doping, the UV-Vis analysis showed a red shift in the onset of wavelength of absorbance and
the band gap was changed from 3.39 to 3.06 eV for the 0.3 wt% Pd/TiO2 sample. Photo catalytic removal study of for-
mic acid showed that the 0.3 wt% palladium doped photocatalyst exhibits the highest efficiency among the different
palladium doped photocatalysts using sun light as the radiation source.
Keywords: TiO2 Nanoparticles; Sol-Gel Process; Thermal Analysis; Photocatalyst; and Formic Acid
1. Introduction
Titanium dioxide (TiO2) has been widely used as a
photocatalyst for degrading a wide range of organic
compounds [1]. In addition, TiO2 has attracted extensive
interests because of its potential applications to photo-
catalysis [2], chemical sensors [3], solar cell electrodes
[4], and hydrogen storage materials [5]. However, the
TiO2 photocatalyst is known to have limitations for
practical applications. One of these limitations is that the
TiO2 has activity only under light of wavelength shorter
than 388 nm because of its wide band gap (Eg = 3.2 eV)
[6-8]. The wide band gap limits the use of sunlight as
excitation energy and the high rate of recombination of
photo-generated electron-hole pairs in TiO2 results in low
photocatalytic efficiency [6-8]. To overcome these two
difficulties, many efforts have been made to modify TiO2
nanoparticles [8-10]. One of the promising approaches is
based on the metal loading. Various metals, such as Pt,
Au, Pd, Rh and Ag, have been used as electron acceptors
to separate the photo-induced hole/electron pair and
promote interfacial charge-transfer processes [11-16].
Therefore, the aim of the present work is to study the
effect of palladium on the properties and activity of the
TiO2 photocatalyst prepared by the sol-gel method. To
investigate the photocatalytic efficiency of the pure and
doped TiO2, formic acid was used as a model pollutant.
Formic acid is a very simple molecule which can be
decomposed in simple steps leading to the increase of the
pH of the treated solution.
2. Experimental Section
2.1. Synthesis details
Titanium tetrachloride (Fluka 98%) was used as a
starting material. 3 gm of TiCl4 was added dropwisely to
15 ml absolute ethanol under stirring. The resulting
solution was stirred at room temperature to form a gel.
Then, the gel was heated on the hotplate at about 80˚C to
form a white powder. The powder was then dried at
110˚C for 45 minute in furnace. The dried powders were
ground in an agate mortar and calcined, in air, at 350˚C,
400˚C, 480˚C, and 600˚C for 2 h in a muffle furnace. A
portion of the dried precipitate was characterized by
XRD and used for thermal analysis. Preparation of the Pd
*Corresponding author.
#Present address: Nottingham Nanotechnology and Nanoscience Centre
(NNNC), School of Physics & Astronomy University of Nottingham,
N
ottingham NG7 2RD, UK.
A. A. A. EL-RADY ET AL. 373
doped TiO2 nanoparticles (Pd/TiO2) was carried out by
similar procedures used for the preparation of the
undoped TiO2 except that a calculated amount palladium
chloride (required to obtain 0.05, 0.1 and 0.3 wt% of the
final catalyst) was dissolved in ethanol before the
addition of titanium chloride. The Pd/TiO2 was obtained
by calcinations of the obtained powder at 400˚C for
under similar conditions.
2.2. Characterization
Thermogravimetric analysis (TG) and Differential Scan-
ning Calorimetry (DSC) were performed on a Netzch
STA-409EP apparatus. Thermal analyses were carried
out in the range 20˚C - 1000˚C, with a heating rate of 10
K·min1. Powdered samples (24 mg) were analyzed in
alumina crucible by using α-Al2O3 as a reference.
X-ray diffraction spectra were recorded at room
temperature using a powder diffractometer Bruker axs
D8 Advance, Germany with Cu-Kα radiation source, λ =
1.5406 Å and 2Ө in the rang 10˚ - 80˚. The average
crystallite size of anatase phase was determined according
to the Scherrer equation. Particle size determination was
carried out with a transmission electron microscope
(TEM), Jeol Jem-1230. Visible-Ultraviolet spectrum was
performed with a JASCO Corp., V-570 UV-V is spec-
trophotometer. Analysis of TiO2 was carried out between
200 and 800 nm.
2.3. Photocatalytic Efficiency Experiments
The photocatalytic efficiency of the catalysts was
investigated using a 500 ml beaker. 150 mg of pure TiO2
or Pd/TiO2 photocatalysts were mixed with 500 ml of
formic acid solution (initial concentration of about 5 ×
103 M). The resulting suspension was stirred to obtain
the maximum adsorption of organic pollutant molecules
on the photocatalyst surface and to make oxygen
available for the reaction. After 6 h under the UV lamp
and 4 h under sun light irradiation, 20 ml sample was
taken for analysis. Samples were centrifuged before
analysis to separate the solid particles. TOC (Phoenix
8000 Laboratory Analyzer uses sodium per-sulfate in
combination with UV light to oxidize organic material)
was used for the analysis of formic acid.
3. Results and Discussion
Figure 1 shows the TG and DTG curve of the undoped
TiO2. The figure presents two weight loss steps. The first
step appeared between 50˚C - 380˚C. This step shows a
decrease in the mass of about 14.19%. This step may be
attributed to the evaporation of water and the loss of
organic component and transformation of amorphous to
anatase form. The second step appeared between 380˚C -
950˚C showed a decrease in mass of about 2.0%. This
step may be attributed to the dehydroxylation of TiO2
surface. The total weight loss is 16.19%. It can be
concluded that a photocatalyst with a stable weight can
be obtained by calcinations at about 400˚C.
Figure 2 shows the corresponding DSC curve of TiO2
sample. There are two DSC peaks. The first peak, at
around 100˚C, can be attributed to the vaporization of
water and the subsequent loss of organic impurities. The
second adsorption peak at ~580˚C may be attributed to
the transformation of TiO2 from anatase to rutile form
[17,18].
The XRD analysis of the dried powder (that used for
the preparation of the undoped TiO2 photocatalysts
before calcinations) showed amorphous material with
starting of formation of the anatase phase. Figure 3
presents the XRD results of the TiO2 calcined at different
temperatures. This figure indicates that the sample
calcined at 380˚C consists of anatase phase only.
Samples calcined at 480˚C and 600˚C consists of anatase
0100 200 300 400 500 600 700 800 9001000
84
86
88
90
92
94
96
98
100
102
Tem perature /°C
weight Remaining/%
-2 .0
-1 .5
-1 .0
-0 .5
0.0
0.5
1.0
Mass Change:2.00%
Mass Change:14.19%
DTG/(%/min)
Figure 1. TG and DTG of the dried powder used for the
preparation of the undoped TiO2 nanoparticles, heating
rate of 10 K·min1 under O2 flow.
Figure 2. DSC of the dried powder used for the preparation
of the undoped TiO2 sample, heating rate of 10 K·min1
under O2 flow.
Open Access ANP
A. A. A. EL-RADY ET AL.
374
and rutile. Table 1 lists the average crystallite sizes of
TiO2 (calculated from the XRD peak, according to
Scherrer equation).
It can be concluded that from XRD study, anatase
phase in the nano scale may be obtained by calcination of
the dried powder at 380˚C and less than 480˚C.
Figure 4 shows the X-ray diffraction patterns of the
undoped and 0.05%, 0.1%, and 0.3% palladium doped
TiO2 calcined at 400˚C. The XRD patterns didn’t show
any Pd phase (even for the 0.3% Pd doped TiO2). This
may reveal that Pd ions are uniformly dispersed in TiO2
matrix. In the region of 2θ˚ = 10˚ - 80˚, the shape of
diffraction peaks of the crystal planes of pure TiO2 is
quite similar to those of Pd/TiO2 of different Pd
concentrations.
The average crystal sizs of TiO2 and Pd doped TiO2
nanoparticles were calculated and also, were presented in
10 20 30 40 50 60 70
*
*
*
*
*
*
*
*
*
*
* Anatase
Rutile
(b)
(c)
(a)
Intensity(a.u.)
2-Theta-Scale
Figure 3. XRD patterns of TiO2 nanoparticles obtained by
calcinations at different temperatures (a) 380˚C, (b) 480˚C,
and (c) 600˚C.
Table 1. Calculated grain size and phase composition of the
doped and undoped TiO2 catalyst at different calcination
temperature from the XRD results.
Phase %
Catalyst
Mean
Crystallite
Size (nm) Anatase Rutile
Calcination
Temperature/˚C
Undoped TiO2 16.58 100 - 380
Undoped TiO2 24.75 44.4 55.6 480
Undoped TiO2 57.6 11.5 88.5 600
Undoped TiO2 23.3 100 - 400
0.05% Pd-TiO2 22.5 100 - 400
0.1% Pd-TiO2 21.7 100 - 400
0.3% Pd-TiO2 22 100 - 400
Table 1. The average crystal size was not significantly
changed due to the addition of the Pd+2.
Figure 5 shows the TEM result of the undoped TiO2
nanopaeticles calcined at 480˚C. The TEM image of the
undoped TiO2 nanoparticles has a narrow size dis-
tribution (17 - 28 nm). The result of the TEM agrees with
the XRD results concerning the particle size range.
The EDX (energy dispersive X-ray microanalysis) was
recorded in the binding energy region of 0 - 11 keV. The
result is shown in Figure 6. The peak from the spectrum
reveals the presence of two peaks around 4.508 and
0.525 keV, respectively. The intense peak is assigned to
the bulk TiO2 and the less intense one to the surface TiO2.
The peaks of Pd are distinct in Figure 7 at 2.8 and 3.6
keV. This result confirms the existence of Pd atoms in
the TiO2 matrix.
The UV-visible spectra of the undoped TiO2 and Pd
doped TiO2 samples prepared by calcinations at 400˚C
are shown in Figure 7. The onset wavelength of
absorption used to calculate the optical band gap was
determined by extrapolation of the base line and the
absorption edge. Table 2 shows the calculated absorption
onset (λ) and the corresponding band gap (Eg) for doped
10203040506070
*
*
*
*
*
* Anatase
pure TiO2
0.3% Pd-TiO2
0.1% Pd-TiO2
0.05% Pd-TiO2
Intensity (a.)
2-Theta Scale
.u
Figure 4. XRD patterns of the doped and undoped TiO2
nanoparticles calcined at 400˚C.
Figure 5. TEM image of TiO2 nanoparticles prepared by
calcinations at 480˚C.
Open Access ANP
A. A. A. EL-RADY ET AL. 375
Figure 6. EDX pattern of 0.03% Pd doped TiO2 nanoparti-
cles.
250 300350 400 450 500 550 600 650700 750800
0.04
0.06
0.08
0.10
0.12
0.14
0.16
Absorbance(a.u)
wavelength(nm)
pure TiO2
0.05% Pd doped TiO2
0.1 % Pd doped TiO2
0.3 % Pd doped TiO2
Figure 7. UV-Vis absorption spectra for undoped and Pd
doped TiO2 nanoparticles prepared by calcinations at
400˚C.
Table 2. Absorption band edge (λ) and band gap (Eg) of
undoped and Pd doped TiO2 samples.
Photocatalyst Absorption Band
Edge (λ), nm Band Gap (Eg), eV
Pure TiO2 365.85 3.39
0.05% Pd Doped TiO2 369.9 3.35
0.1% Pd Doped TiO2 375.36 3.29
0.3% Pd Doped TiO2 404.93 3.06
and undoped TiO2.
The absorption spectrum of Pd doped TiO2 consists of
a single broad intense absorption at the range 365.85 -
404.93 nm can be attributed to the charge-transfer from
the valence band to the conduction band [11]. The
undoped TiO2 showed absorbance in the shorter wave-
length region. The UV-Vis absorption results showed a
red shift of the absorption onset value due to modi-
fication of TiO2 with Pd of different concentrations as
shown in Figure 7. It is known that doping of various
transitional metal ions into TiO2 could shift its optical
absorption edge from UV into visible light range [19].
3.1. Photocatalytic Efficiency
(Removal of Formic Acid)
Formic acid is a simple molecule that can be mineralized
in simple steps leading to the increase of the pH of the
treated solution. One possible route for formic acid
removal may be initiated through the direct transfer of an
electron from the adsorbed formic acid to the surface
positive hole of the photocatalyst [20]. Also, it is well
known that hydroxyl radicals are produced in photo-
catalytic reactions illuminated by radiation of suitable
wave length. These hydroxyl radical may react with the
HCOO-molecule to form water and ·COO-, which can be
further decomposed through the reaction with oxygen
[20]. Presence of palladium can modify the photo-
catalytic effect through increasing the life time of charge
separation and shifting the absorbance to longer wave
length.
Formic acid concentration was measured by the Total
Organic Carbon (TOC). TOC was decreased from 52.2
mg/l to 35 mg/l using the 0.05% Pd doped TiO2 under
UV irradiation, Figure 8. For the undoped TiO2 photo-
catalyst, the TOC was decreased to 23.6 mg/L. The pH of
the solution also was changed from 3.06 to 3.17 and 3.3
for doped and undoped TiO2 photocatalysts, respectively
within the same time (see Table 3). The change of the
pH was taken as a signal for the removal of formic acid.
It can be seen that under UV irradiation, the undoped
TiO2 exhibits better efficiency than the Pd/TiO2 photo-
catalyst.
Removal of formic acid by pure TiO2 and Pd/TiO2
were examined using sun light as a radiation source
Figure 9. It can be seen that Pd/TiO2 shows higher
efficiency than the pure TiO2. Also, it can be seen that
there is a gradual increase in the efficiency of the
Pd/TiO2 with increasing palladium content in the catalyst.
TOC was decreased from 61 mg/L to 49.6, 34.2, 2.19 and
initial TOCundoped TiO 20.05 % Pd /TiO2
0
10
20
30
40
50
TOC (ppm)
Figure 8. Removal of formic acid by undoped TiO2 and
0.05% Pd doped TiO2 under UV irradiation. Catalyst wt.
150 mg and λ = length 360 nm.
Open Access ANP
A. A. A. EL-RADY ET AL.
376
initial TOCundoped TiO 20.05 % pd doped T iO20.1 % pd doped TiO20.3% pd doped TiO2
0
10
20
30
40
50
60
TOC (ppm)
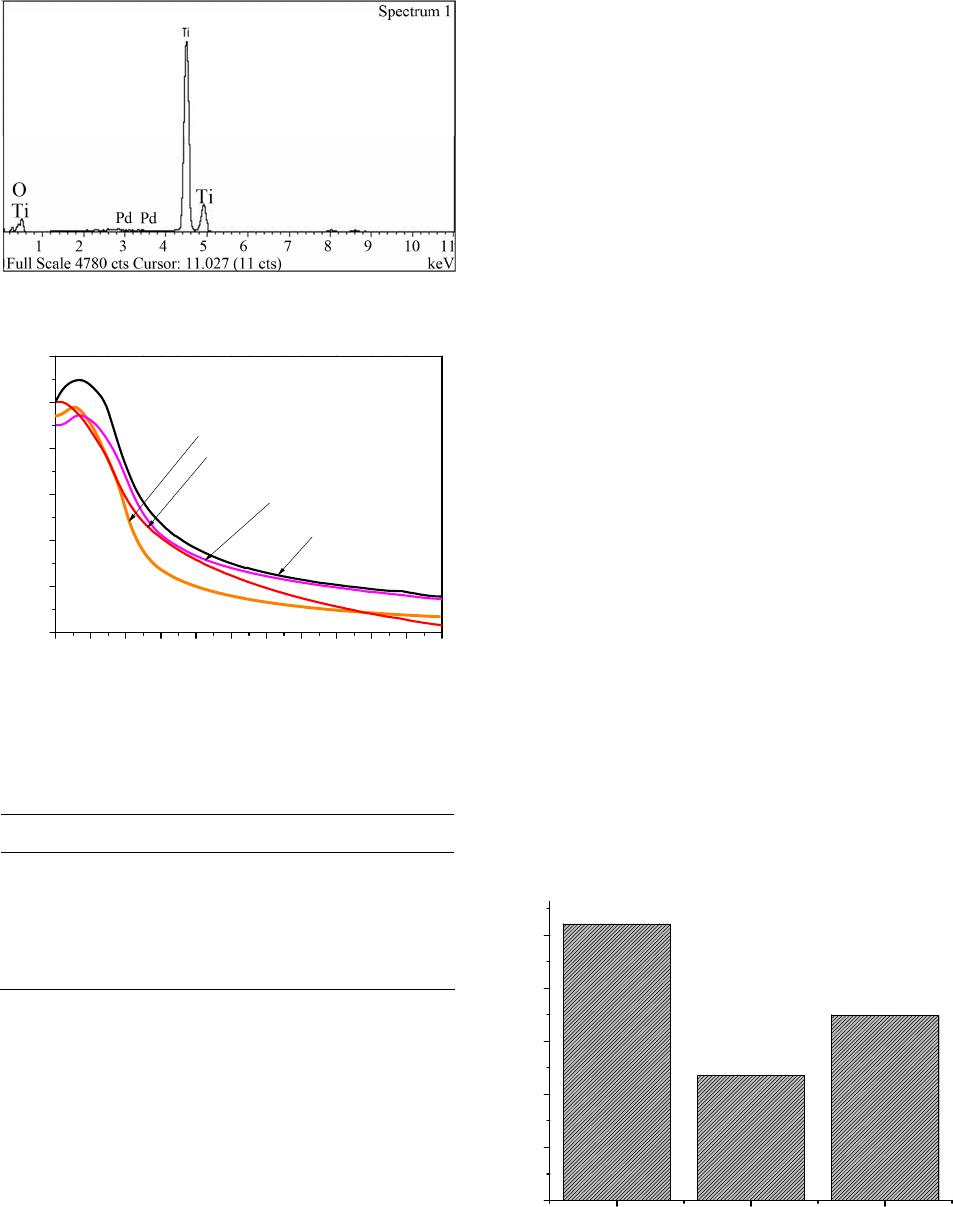
Figure 9. Removal of formic acid by the undoped TiO2,
0.05%, 0.1% and 0.3% Pd/TiO2. Catalyst wt 150 mg under
sun light irradiation.
Table 3. TOC and pH values for formic acid solution
treated by doped and undoped TiO2 nanoparticles prepared
by calcinations at 400˚C under UV irradiation for 6 hrs.
Sample Name pH TOC Degradation Rate (%)
Formic acid Solution 3.06 52.2 -
Undoped TiO2 3.3 23.6 54.8
0.05% Pd Doped TiO2 3.17 35 33
Table 4. TOC results for doped and undoped TiO2 nano-
particles annealed at 400˚C under sun light irradiation for 4
hrs.
Sample Name pH TOC Degradation Rate (%)
Formic Acid Solution 2.98 61 -
Undoped TiO2 2.99 53.8 11.8
0.05% Pd Doped TiO2 3.08 49.6 18.69
0.1% Pd Doped TiO2 3.02 34.2 43.93
0.3% Pd Doped TiO2 3.58 2.19 96.4
53.8 mg/L for 0.05%, 0.1%, 0.3% Pd doped TiO2 and
undoped TiO2, respectively under sun light irradiation
within the same time (see Table 4). The pH of the
solution also was changed from 2.98 to 3.08, 3.02, 3.58
and 2.98 for 0.05%, 0.1%, and 0.3% Pd doped TiO2 and
undoped TiO2 photocatalysts, respectively, within the
same time.
4. Conclusion
The pure and palladium doped TiO2 (Pd/TiO2) nano-
particles were prepared by the sol gel method. Samples
prepared by calcinations at 380˚C contain anatase phase
only. A mixture of anatase and rutile was obtained at
higher calcination temperatures. Doping TiO2 with
palladium in the concentration range of 0.05 to 0.3 has
no significant effect on the particle sizes and did not
result in the formation of a new crystalline phase. It was
confirmed that the incorporation of Pd in TiO2 matrix
shifts the onset wave length of absorption to higher
values (red shift). Under UV irradiation, the pure TiO2
exhibited higher efficiency than the palladium doped
TiO2 for formic acid removal from water. However,
when sun light was used as the radiation source, the
palladium doped photocatalyst exhibited higher effi-
ciency than the pure TiO2 and the photocatalytic ef-
ficiency increases with increasing palladium content up
to a concentration of 0.3% (0.3% Pd/TiO2).
REFERENCES
[1] D. A. Tryk, A. Fujishima and K. Honda, “Recent Topics
in Photoelectrochemistry: Achievements and Future Pros-
pects,” Electrochimica Acta, Vol. 45, No. 15-16, 2000, pp.
2363-2376.
http://dx.doi.org/10.1016/S0013-4686(00)00337-6
[2] M. Kunst, T. Moehl, F. Wunsch and H. Tributsch, “Opto-
electronic Properties of SnO2/TiO2 Junctions,” Super Lat-
tice Microst., Vol. 39, No. 1-4, 2006, pp. 376-380.
[3] S. M. Karvinen, “The Effects of Trace Element Doping
on the Optical Properties and Photocatalytic Activity of
Nanostructured Titanium Dioxide,” Industrial & Engi-
neering Chemistry Research, Vol. 42, No. 5, 2003, pp.
1035-1043. http://dx.doi.org/10.1021/ie020358z
[4] J. Chen, S. L. Li, Z. L. Tao, Y. T. Shen and C. X. Cui,
“Titanium Disulfide Nanotubes as Hydrogen-Storage
Materials,” Journal of the American Chemical Society,
Vol. 125, No. 18, 2003, pp. 5284-5285.
http://dx.doi.org/10.1021/ja034601c
[5] A. Fujishima, X. Zhang and D. A. Tryk, “TiO2 Photo-
catalysis and Related Surface Phenomena,” Surface Sci-
ence Reports, Vol. 63, No. 12, 2008, pp. 515-582.
[6] L. Ge and M. X. Xu, “Influences of the Pd Doping on the
Visible Light Photocatalytic Activities of InVO4-TiO2
Thin Films,” Materials Science and Engineering: B, Vol.
131, No. 1-3, 2006, pp. 222-229.
http://dx.doi.org/10.1016/j.mseb.2006.04.021
[7] B. P. Xie, Y. Xiong, R. M. Chen, J. Chen and P. X. Cai,
“Catalytic Activities of Pd-TiO2 Film towards the Oxida-
tion of Formic Acid,” Catalysis Communications, Vol. 6,
No. 11, 2005, pp. 699-704.
http://dx.doi.org/10.1016/j.catcom.2005.06.003
[8] X. Zhang, F. Zhang and K. Y. Chan, “The Synthesis of
Pt-Modified Titanium Dioxide Thin Films by Microe-
mulsion Templating, Their Characterization and Visible-
Light Photocatalytic Properties,” Materials Chemistry
and Physics, Vol. 97, No. 2-3, 2006, pp. 384-389.
http://dx.doi.org/10.1016/j.matchemphys.2005.08.060
[9] H. Li, B. L. Zhu, Y. F. Feng, S. R. Wang, S. M. Zhang
and W. P. Huang, “Synthesis, Characterization of TiO2
Nanotubes-Supported MS (TiO2NTs@MS, M = Cd, Zn)
and Their Photocatalytic Activity,” Journal of Solid State
Chemistry, Vol. 180, No. 7, 2007, pp. 2136-2142.
Open Access ANP
A. A. A. EL-RADY ET AL.
Open Access ANP
377
http://dx.doi.org/10.1016/j.jssc.2007.05.013
[10] W. T. Geng and K. S. Kim, “Interplay of Local Structure
and Magnetism in Co-Doped TiO2 Anatase,” Solid State
Communications, Vol. 129, No. 11, 2004, pp. 741-746.
http://dx.doi.org/10.1016/j.ssc.2003.12.003
[11] J. C.-S. Wu and C.-H. Chen, “A Visible-Light Response
Vanadium-Doped Titania Nanocatalyst by Sol-Gel Me-
thod,” Journal of Photochemistry and Photobiology A:
Chemistry, Vol. 163, No. 3, 2004, pp. 509-515.
http://dx.doi.org/10.1016/j.jphotochem.2004.02.007
[12] G. Strukul, R. Gavagnin, F. Pinna, E. Modaferri, S. Pera-
thoner, G. Centi, M. Marella and M. Tomaselli, “Use of
Palladium Based Catalysts in the Hydrogenation of Ni-
trates in Drinking Water: From Powders to Membranes,”
Catalysis Today, Vol. 55, No. 1-2, 2000, pp. 139-149.
http://dx.doi.org/10.1016/S0920-5861(99)00233-3
[13] S. Castillo and T. Lopez, “Catalytic Reduction of Nitric
Oxide on Pt and Rh Catalysts Supported on Alumina and
Titania Synthesized by the Sol-Gel Method,” Applied
Catalysis B: Environmental, Vol. 15, No. 3-4, 1998, pp.
203-209.
http://dx.doi.org/10.1016/S0926-3373(97)00047-7
[14] T. Lopeze, R. Gomez, G. Pecci, P. Reyes, X. Bokhimi
and O. Novaro, “Effect of pH on the Incorporation of
Platinum into the Lattice of Sol-Gel Titania Phases,” Ma-
terials Letters, Vol. 40, No. 2, 1999, pp. 59-65.
http://dx.doi.org/10.1016/S0167-577X(99)00049-X
[15] J. Matsuoka, R. Naruse, H. Nasu and K. Kamiya, “Prepa-
ration of Gold Microcrystal-Doped Oxide Optical Coat-
ings through Adsorption of Tetrachloroaurate Ions on Gel
Films,” Journal of Non-Crystalline Solids, Vol. 218, 1997,
pp. 151-155.
http://dx.doi.org/10.1016/S0022-3093(97)00164-6
[16] W. D. Kingery, H. K. Bowen and D. R. Uhlmann, “In-
troduction to Ceramics,” 2nd Edition, John Wiley and
Sons, New York, 1976, 457p.
[17] J. L. Margrave and B. D. Kybett, “Tech. Rept. AFMO-
TR-65,” Air Force Materials Laboratory, Research and
Technology Division, Air Force Systems Command,
Wright—Patterson Air Force Base, Ohio, 1965, p. 123.
[18] A. Navrostsky and O. J. Klappa, “Transformation Enthal-
pies of the TiO2 Polymorphs,” J. Am. Ceram. Soc., Vol.
62, No. 7-8, 1976, pp. 356-357.
[19] H. Tada, F. Suzuki, S. Yoneda, S. Ito and H. Kobayashi,
“The Effect of Nanometre-Sized Au Particle Loading on
TiO2 Photocatalysed Reduction of Bis(2-dipyridyl)disulfide
to 2-Mercaptopyridine by H2O,” Physical Chemistry
Chemical Physics, Vol. 3, No. 7, 2001, pp. 1376-1382.
http://dx.doi.org/10.1039/b007817o
[20] J. Krýsa, G. Waldner, H. Měšť ánková, J. Jirkovský and
G. Grabner, “Photocatalytic Degradation of Model Or-
ganic Pollutants on an Immobilized Particulate TiO2
Layer: Roles of Adsorption Processes and Mechanistic
Complexity,” Applied Catalysis B: Environmental, Vol.
64, No. 3-4, 2006, pp. 290-301.
http://dx.doi.org/10.1016/j.apcatb.2005.11.007