Paper Menu >>
Journal Menu >>
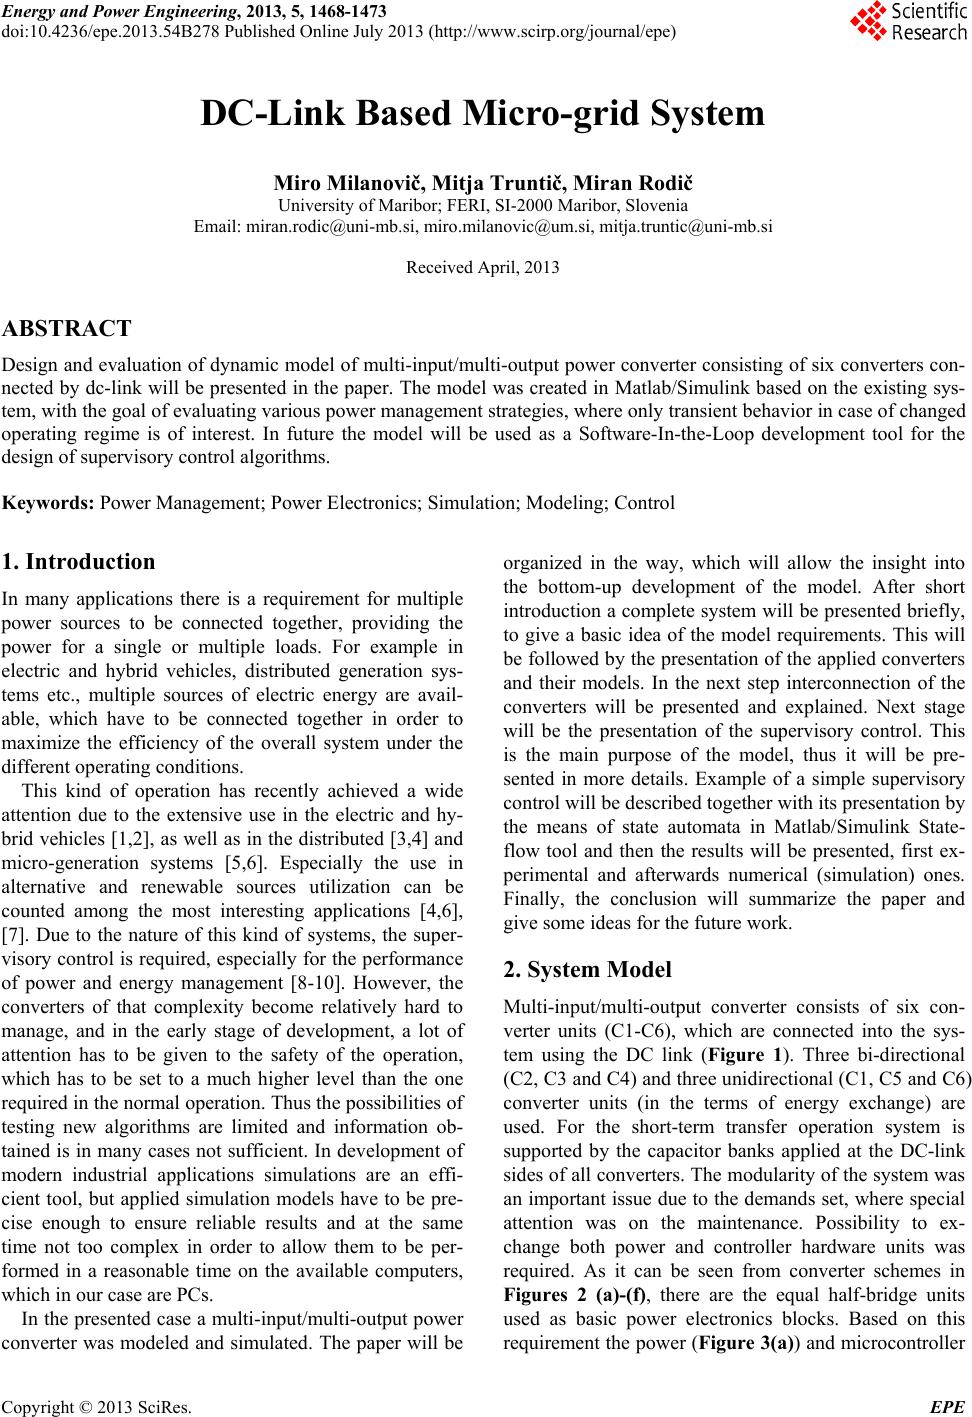 Energy and Power Engineering, 2013, 5, 1468-1473 doi:10.4236/epe.2013.54B278 Published Online July 2013 (http://www.scirp.org/journal/epe) DC-Link Based Micro-grid System Miro Milanovič, Mitja Truntič, Miran Rodič University of Maribor; FERI, SI-2000 Maribor, Slovenia Email: miran.rodic@uni-mb.si, miro.milanovic@um.si, mitja.truntic@uni-mb.si Received April, 2013 ABSTRACT Design and evaluation of dynamic model of multi-input/multi-output power converter consisting of six converters con- nected by dc-link will be presented in the paper. The model was created in Matlab/Simulink based on the existing sys- tem, with the goal of evaluating various power management strategies, where only transient behavior in case of changed operating regime is of interest. In future the model will be used as a Software-In-the-Loop development tool for the design of supervisory control algorithms. Keywords: Power Management; Power Electronics; Simulation; Modeling; Control 1. Introduction In many applications there is a requirement for multiple power sources to be connected together, providing the power for a single or multiple loads. For example in electric and hybrid vehicles, distributed generation sys- tems etc., multiple sources of electric energy are avail- able, which have to be connected together in order to maximize the efficiency of the overall system under the different operating conditions. This kind of operation has recently achieved a wide attention due to the extensive use in the electric and hy- brid vehicles [1,2], as well as in the distributed [3,4] and micro-generation systems [5,6]. Especially the use in alternative and renewable sources utilization can be counted among the most interesting applications [4,6], [7]. Due to the nature of this kind of systems, the super- visory control is required, especially for the performance of power and energy management [8-10]. However, the converters of that complexity become relatively hard to manage, and in the early stage of development, a lot of attention has to be given to the safety of the operation, which has to be set to a much higher level than the one required in the normal operation. Thus the possibilities of testing new algorithms are limited and information ob- tained is in many cases not sufficient. In development of modern industrial applications simulations are an effi- cient tool, but applied simulation models have to be pre- cise enough to ensure reliable results and at the same time not too complex in order to allow them to be per- formed in a reasonable time on the available computers, which in our case are PCs. In the presented case a multi-input/multi-output power converter was modeled and simulated. The paper will be organized in the way, which will allow the insight into the bottom-up development of the model. After short introduction a complete system will be presented briefly, to give a basic idea of the model requirements. This will be followed by the presentation of the applied converters and their models. In the next step interconnection of the converters will be presented and explained. Next stage will be the presentation of the supervisory control. This is the main purpose of the model, thus it will be pre- sented in more details. Example of a simple supervisory control will be described together with its presentation by the means of state automata in Matlab/Simulink State- flow tool and then the results will be presented, first ex- perimental and afterwards numerical (simulation) ones. Finally, the conclusion will summarize the paper and give some ideas for the future work. 2. System Model Multi-input/multi-output converter consists of six con- verter units (C1-C6), which are connected into the sys- tem using the DC link (Figure 1). Three bi-directional (C2, C3 and C4) and three unidirectional (C1, C5 and C6) converter units (in the terms of energy exchange) are used. For the short-term transfer operation system is supported by the capacitor banks applied at the DC-link sides of all converters. The modularity of the system was an important issue due to the demands set, where special attention was on the maintenance. Possibility to ex- change both power and controller hardware units was required. As it can be seen from converter schemes in Figures 2 (a)-(f), there are the equal half-bridge units used as basic power electronics blocks. Based on this requirement the power (Figure 3(a)) and microcontroller Copyright © 2013 SciRes. EPE 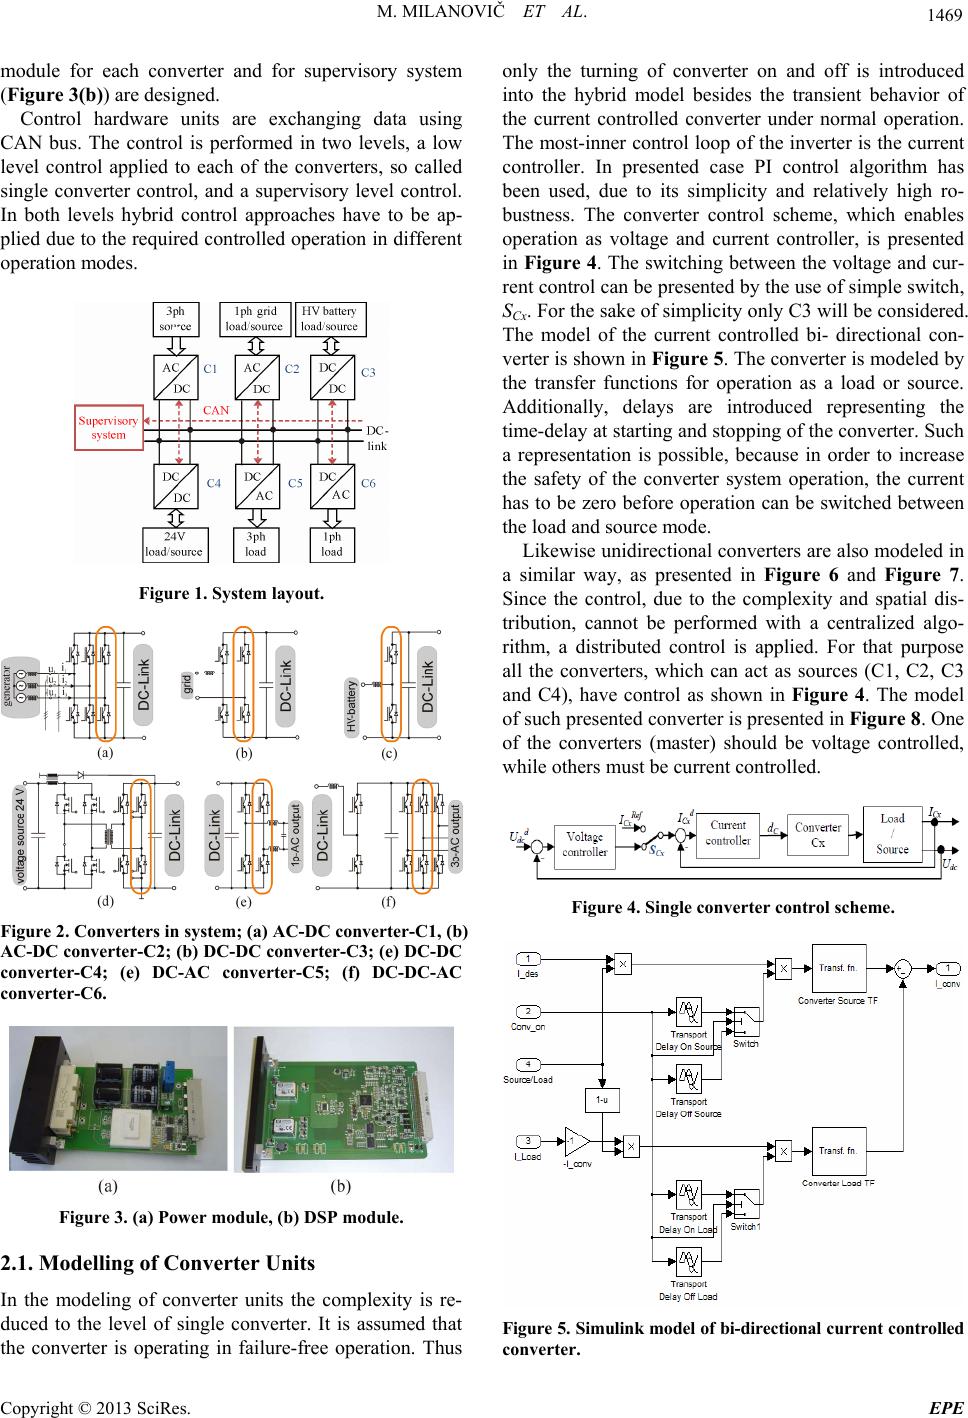 M. MILANOVIČ ET AL. 1469 module for each converter and for supervisory system (Figure 3(b)) are designed. Control hardware units are exchanging data using CAN bus. The control is performed in two levels, a low level control applied to each of the converters, so called single converter control, and a supervisory level control. In both levels hybrid control approaches have to be ap- plied due to the required controlled operation in different operation modes. Figure 1. System layout. Figure 2. Converters in system; (a) AC-DC converter-C1, (b) AC-DC converter-C2; (b) DC-DC converter-C3; (e) DC-DC converter-C4; (e) DC-AC converter-C5; (f) DC-DC-AC converter-C6. Figure 3. (a) Power module, (b) DSP module. 2.1. Modelling of Converter Units In the modeling of converter units the complexity is re- duced to the level of single converter. It is assumed that the converter is operating in failure-free operation. Thus only the turning of converter on and off is introduced into the hybrid model besides the transient behavior of the current controlled converter under normal operation. The most-inner control loop of the inverter is the current controller. In presented case PI control algorithm has been used, due to its simplicity and relatively high ro- bustness. The converter control scheme, which enables operation as voltage and current controller, is presented in Figure 4. The switching between the voltage and cur- rent control can be presented by the use of simple switch, SCx. For the sake of simplicity only C3 will be considered. The model of the current controlled bi- directional con- verter is shown in Figure 5. The converter is modeled by the transfer functions for operation as a load or source. Additionally, delays are introduced representing the time-delay at starting and stopping of the converter. Such a representation is possible, because in order to increase the safety of the converter system operation, the current has to be zero before operation can be switched between the load and source mode. Likewise unidirectional converters are also modeled in a similar way, as presented in Figure 6 and Figure 7. Since the control, due to the complexity and spatial dis- tribution, cannot be performed with a centralized algo- rithm, a distributed control is applied. For that purpose all the converters, which can act as sources (C1, C2, C3 and C4), have control as shown in Figure 4. The model of such presented converter is presented in Figure 8. One of the converters (master) should be voltage controlled, while others must be current controlled. Figure 4. Single converter control scheme. Figure 5. Simulink model of bi-directional current controlled converter. Copyright © 2013 SciRes. EPE 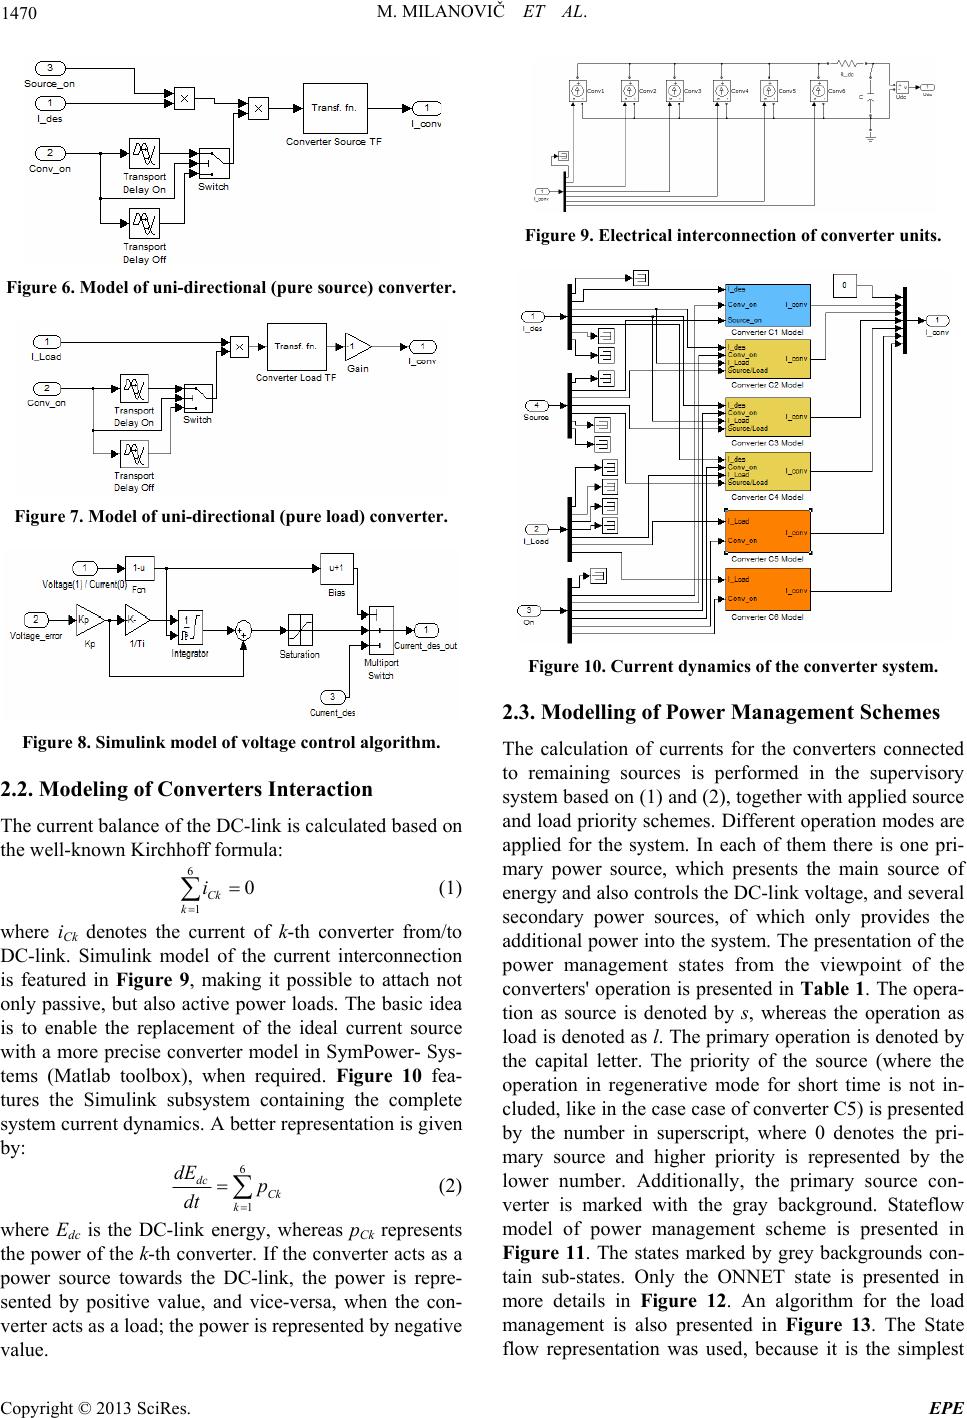 M. MILANOVIČ ET AL. 1470 Figure 6. Model of uni-directional (pure source) converter. Figure 7. Model of uni-directional (pure load) converter. Figure 8. Simulink model of voltage control algorithm. 2.2. Modeling of Converters Interaction The current balance of the DC-link is calculated based on the well-known Kirchhoff formula: 6 1 0 Ck k i (1) where iCk denotes the current of k-th converter from/to DC-link. Simulink model of the current interconnection is featured in Figure 9, making it possible to attach not only passive, but also active power loads. The basic idea is to enable the replacement of the ideal current source with a more precise converter model in SymPower- Sys- tems (Matlab toolbox), when required. Figure 10 fea- tures the Simulink subsystem containing the complete system current dynamics. A better representation is given by: 6 1 dc Ck k dE p dt (2) where Edc is the DC-link energy, whereas pCk represents the power of the k-th converter. If the converter acts as a power source towards the DC-link, the power is repre- sented by positive value, and vice-versa, when the con- verter acts as a load; the power is represented by negative value. Figure 9. Electrical interconnection of converter units. Figure 10. Current dynamics of the converter system. 2.3. Modelling of Power Management Schemes The calculation of currents for the converters connected to remaining sources is performed in the supervisory system based on (1) and (2), together with applied source and load priority schemes. Different operation modes are applied for the system. In each of them there is one pri- mary power source, which presents the main source of energy and also controls the DC-link voltage, and several secondary power sources, of which only provides the additional power into the system. The presentation of the power management states from the viewpoint of the converters' operation is presented in Table 1. The opera- tion as source is denoted by s, whereas the operation as load is denoted as l. The primary operation is denoted by the capital letter. The priority of the source (where the operation in regenerative mode for short time is not in- cluded, like in the case case of converter C5) is presented by the number in superscript, where 0 denotes the pri- mary source and higher priority is represented by the lower number. Additionally, the primary source con- verter is marked with the gray background. Stateflow model of power management scheme is presented in Figure 11. The states marked by grey backgrounds con- tain sub-states. Only the ONNET state is presented in more details in Figure 12. An algorithm for the load management is also presented in Figure 13. The State flow representation was used, because it is the simplest Copyright © 2013 SciRes. EPE 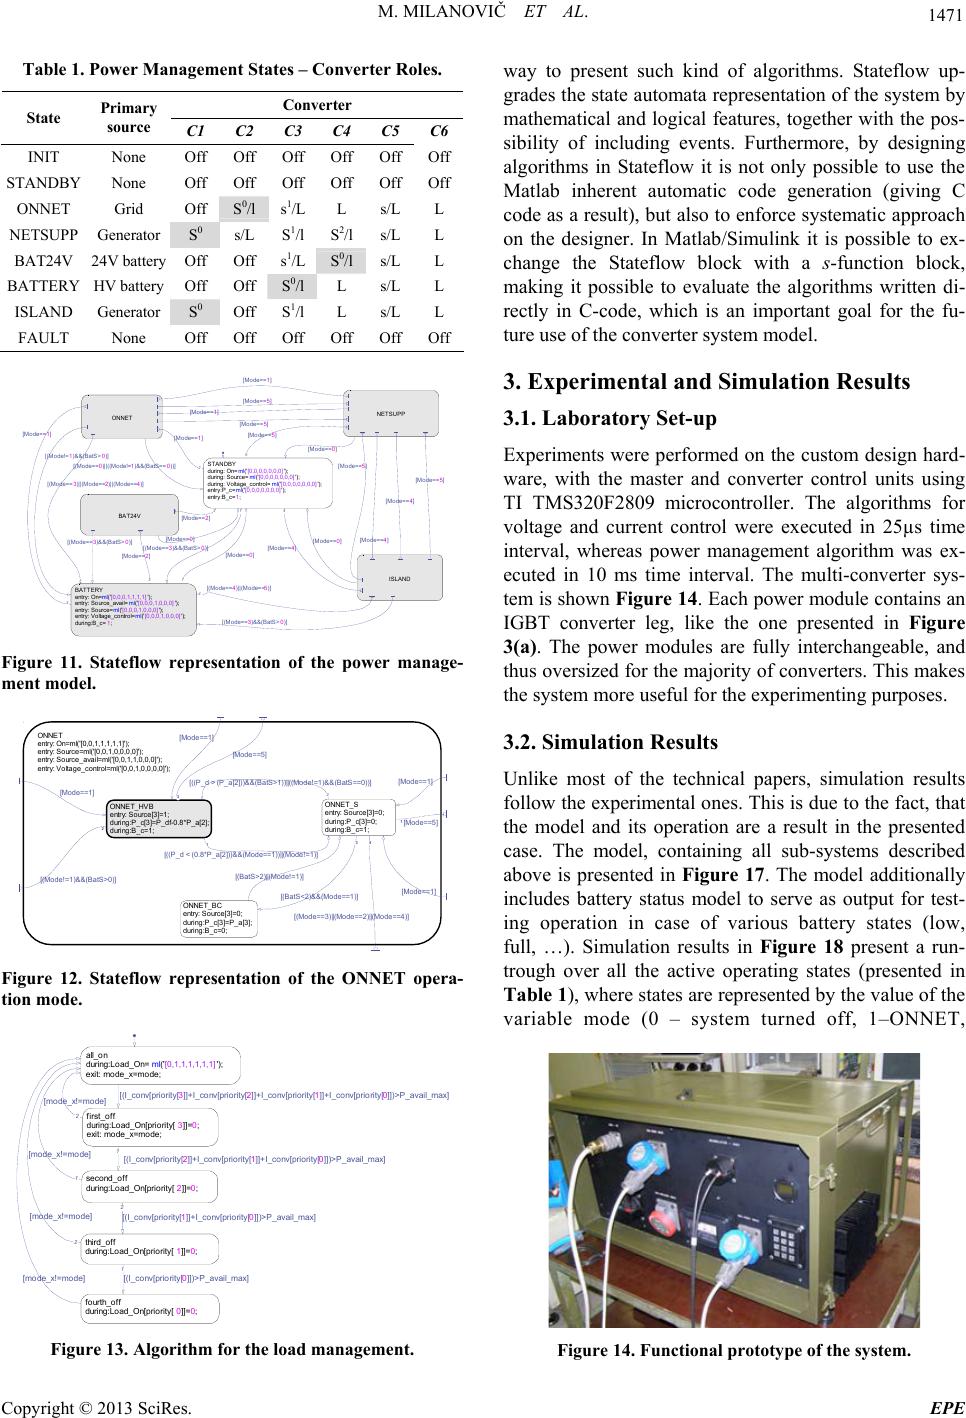 M. MILANOVIČ ET AL. 1471 Table 1. Power Management States – Converter Roles. Converter State Primary source C1 C2C3 C4 C5C6 INIT None Off Off Off Off Off Off STANDBY None Off OffOff Off Off Off ONNET Grid Off S0/l s1/L L s/LL NETSUPP Generator S0 s/L S1/l S2/l s/LL BAT24V 24V battery Off Offs1/L S0/l s/LL BATTERY HV battery Off OffS0/l L s/LL ISLAND Generator S0 Off S1/l L s/LL FAULT None Off Off Off Off Off Off NETSUPP ONNET STANDBY during: On=ml('[0,0,0,0,0,0,0]'); during: Source=ml('[0,0,0,0,0,0,0] '); during: Voltage_control=ml('[0,0,0,0,0,0,0]'); entry:P_c=ml('[0,0,0,0,0,0,0]'); entry:B_c=1; BAT24V ISLAND BATTERY entry: On=ml('[0,0,0,1,1,1,1] '); entry: Source_avail=ml('[0,0,0,1,0,0,0] '); entry: Source=ml(' [0,0,0,1,0,0,0 ]'); entry: Voltage_control=ml('[0, 0,0,1,0,0,0]'); during:B_c=1; [Mode==1] [Mode==5] [Mode==1] 3 [Mode==1] [Mode==5] [Mode==5] 5 [(Mode!=1)&&(BatS>0)] [Mode==1] 2 [Mode==5] [Mode==5] [Mode==4] [Mode==4] [(Mode==3)||(Mode==2)||(Mode==4)] [Mode==0] [(Mode==0)||((Mode!=1)&&(BatS==0))] [Mode==2] 3 [Mode==0] [Mode==0] 1 [Mode==0] [(Mode==3)&&(BatS>0)] 1 [Mode==4] 4 [Mode==2] 2 [(Mode==3)&&(BatS> 0)] [(Mode==4)||(Mode==5)] 4 [(Mode==3)&&(BatS>0)] Figure 11. Stateflow representation of the power manage- ment model. ONNET ent r y: O n=m l ( ' [0, 0, 1, 1, 1, 1,1] ') ; ent r y: Sou r ce= ml('[ 0,0,1,0,0,0, 0] ') ; ent r y: Sou r ce_avail= ml ( '[ 0, 0, 1,1, 0, 0, 0] '); ent r y: Vol t age_con t r ol= m l ( '[ 0, 0, 1, 0,0, 0, 0] ') ; ONNET_ HVB entry: Source[3]=1; during:P_c[3]=P_df-0.8 *P_a[ 2]; during:B_c=1; ONNET_ BC entry: Source[3]=0; during:P_c[3]=P_a[3]; during:B_c=0; ONNET_S entry: Source[3]=0; during:P_c[3]=0; during:B_c=1; [Mode==1] [Mode==5] 3 [Mode==1] [Mode==1] [((P_d > (P_a[2]))&&(BatS>1))|| ((Mode!=1)&&(BatS==0))] 2 [Mode==5] 1 [(Mode!=1)&&(BatS>0)] 2 [(( P_d < (0. 8*P_a[2] ) )&&(M ode==1) ) ||( Mode!=1)] 1 [(BatS >2)||(Mode!=1) ] [(BatS<2)&&(Mode==1)] 3 [(Mode==3)||(Mode==2)||(Mode==4)] 4 [Mode==1] Figure 12. Stateflow representation of the ONNET opera- tion mode. all_on during:Load_On= ml('[0,1,1,1,1,1,1]'); exit: mode_x=mode; first_off during:Load_On[priority[ 3]]=0; exit: mode_x=mode; second_off during:Load_On[priority[ 2]]=0; third_off during:Load_On[priority[ 1]]=0; fourth_off during:Load_On[priority[ 0]]=0; [mo de_x!=mode] [mode_x!=mode] 2 [mod e_x!=mode] 1 [mode _x!=mode] 2 [(I_conv[priority [3]]+I_conv[priority[2]]+I_conv[priority[1]]+I_conv[priority[0]])>P_avai l_max] [(I_conv[priority [2]]+I_conv[priority[1]]+I_conv[priority[0]])>P_avai l_max] 1 [(I_conv[priority[1]]+I_conv[priority[0]])>P_ avai l_max] 2 [(I_conv[priority[0]])>P_av ail_max] 1 Figure 13. Algorithm for the load management. way to present such kind of algorithms. Stateflow up- grades the state automata representation of the system by mathematical and logical features, together with the pos- sibility of including events. Furthermore, by designing algorithms in Stateflow it is not only possible to use the Matlab inherent automatic code generation (giving C code as a result), but also to enforce systematic approach on the designer. In Matlab/Simulink it is possible to ex- change the Stateflow block with a s-function block, making it possible to evaluate the algorithms written di- rectly in C-code, which is an important goal for the fu- ture use of the converter system model. 3. Experimental and Simulation Results 3.1. Laboratory Set-up Experiments were performed on the custom design hard- ware, with the master and converter control units using TI TMS320F2809 microcontroller. The algorithms for voltage and current control were executed in 25µs time interval, whereas power management algorithm was ex- ecuted in 10 ms time interval. The multi-converter sys- tem is shown Figure 14. Each power module contains an IGBT converter leg, like the one presented in Figure 3(a). The power modules are fully interchangeable, and thus oversized for the majority of converters. This makes the system more useful for the experimenting purposes. 3.2. Simulation Results Unlike most of the technical papers, simulation results follow the experimental ones. This is due to the fact, that the model and its operation are a result in the presented case. The model, containing all sub-systems described above is presented in Figure 17. The model additionally includes battery status model to serve as output for test- ing operation in case of various battery states (low, full, …). Simulation results in Figure 18 present a run- trough over all the active operating states (presented in Table 1), where states are represented by the value of the variable mode (0 – system turned off, 1–ONNET, Figure 14. Functional prototype of the system. Copyright © 2013 SciRes. EPE 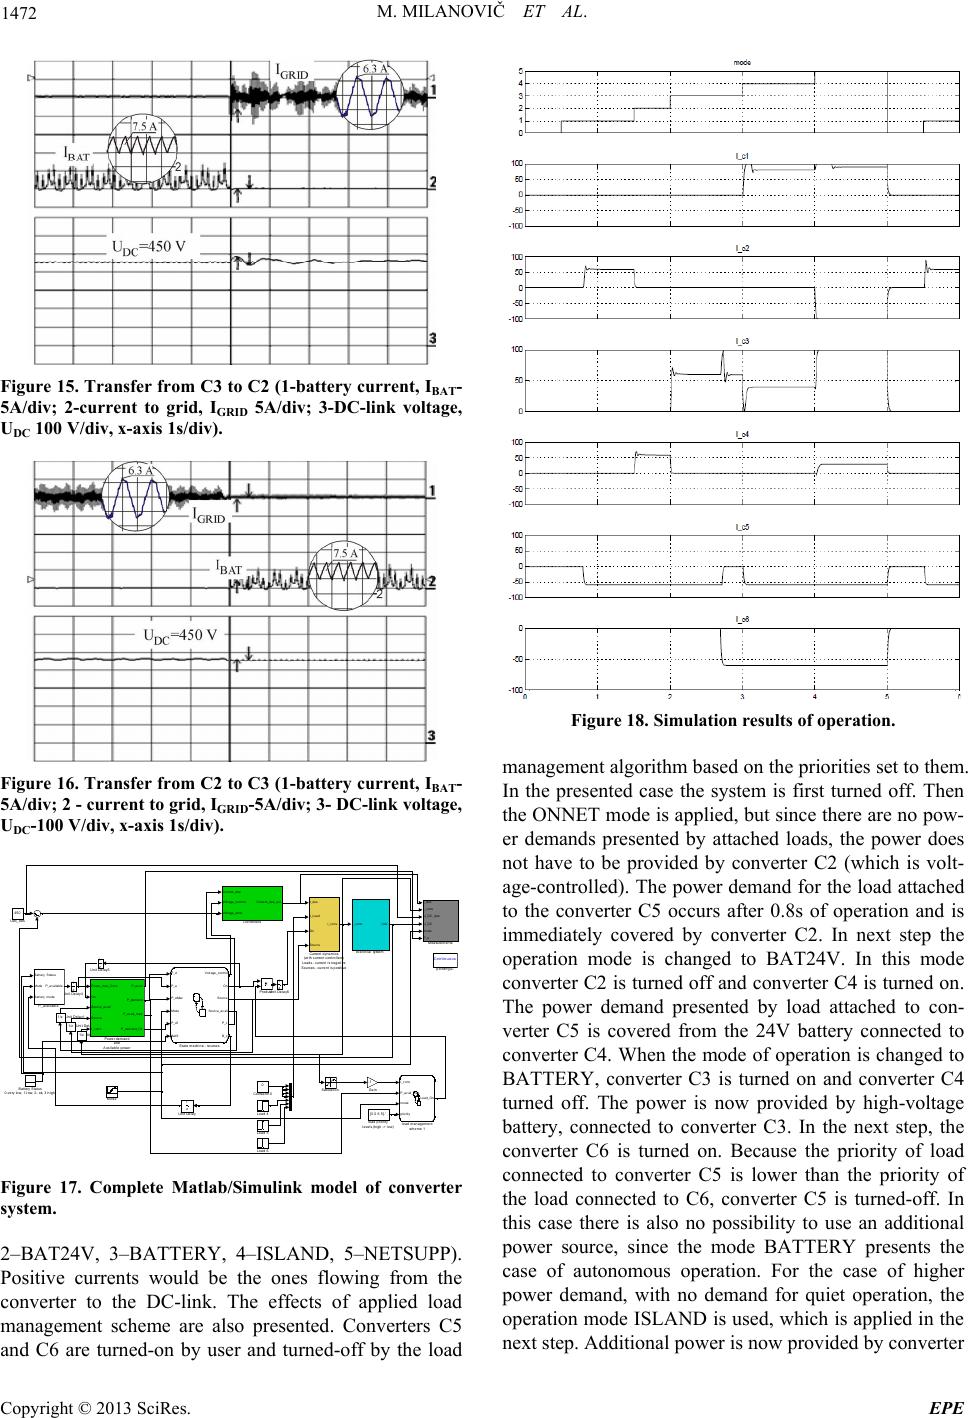 M. MILANOVIČ ET AL. 1472 Figure 15. Transfer from C3 to C2 (1-battery current, IBAT- 5A/div; 2-current to grid, IGRID 5A/div; 3-DC-link voltage, UDC 100 V/div, x-axis 1s/div). Figure 16. Transfer from C2 to C3 (1-battery current, IBAT- 5A/div; 2 - current to grid, IGRID-5A/div; 3- DC-link voltage, UDC-100 V/div, x-axis 1s/div). Continuous powergui [0 0 6 5].' load priority levels (high -> low) I_conv P_avail_max mode priority Load_On load management scheme 1 z 1 Unit Delay6 z 1 Uni t Del a y5 z 1 Uni t Del a y4 1/z Unit Delay3 1/z Unit Del ay2 1/z Unit Delay1 z 1 Unit Delay 450 Udc_des P_d P_a P_aMax Mode P_df BatS Voltage_control On Source Source_avail P_c B_c State machine - sources Saturation Product Power_max_Conv On Source_avail Source I_conv P_avail P_demand P_avail_max P_demand_filt Power demand and Available power Battery Status Mode Battery mode P_available P_available Mode I_des I_conv U_DC_des U_DC mode P_a Measurements Load 6 Load 5 Load 4 -1 Gain I_conv Udc Electrical system I_des I_Load On Source I_conv Current dynamics (with current cont rol lers) Loads - current is negative Sources - current is positive Current_des Voltage_control Voltage_error Current_des_out Controllers 0 Constant10 Battery Status 0-very low, 1-low, 2- ok, 3-high Figure 17. Complete Matlab/Simulink model of converter system. 2–BAT24V, 3–BATTERY, 4–ISLAND, 5–NETSUPP). Positive currents would be the ones flowing from the converter to the DC-link. The effects of applied load management scheme are also presented. Converters C5 and C6 are turned-on by user and turned-off by the load Figure 18. Simulation results of operation. management algorithm based on the priorities set to them. In the presented case the system is first turned off. Then the ONNET mode is applied, but since there are no pow- er demands presented by attached loads, the power does not have to be provided by converter C2 (which is volt- age-controlled). The power demand for the load attached to the converter C5 occurs after 0.8s of operation and is immediately covered by converter C2. In next step the operation mode is changed to BAT24V. In this mode converter C2 is turned off and converter C4 is turned on. The power demand presented by load attached to con- verter C5 is covered from the 24V battery connected to converter C4. When the mode of operation is changed to BATTERY, converter C3 is turned on and converter C4 turned off. The power is now provided by high-voltage battery, connected to converter C3. In the next step, the converter C6 is turned on. Because the priority of load connected to converter C5 is lower than the priority of the load connected to C6, converter C5 is turned-off. In this case there is also no possibility to use an additional power source, since the mode BATTERY presents the case of autonomous operation. For the case of higher power demand, with no demand for quiet operation, the operation mode ISLAND is used, which is applied in the next step. Additional power is now provided by converter Copyright © 2013 SciRes. EPE 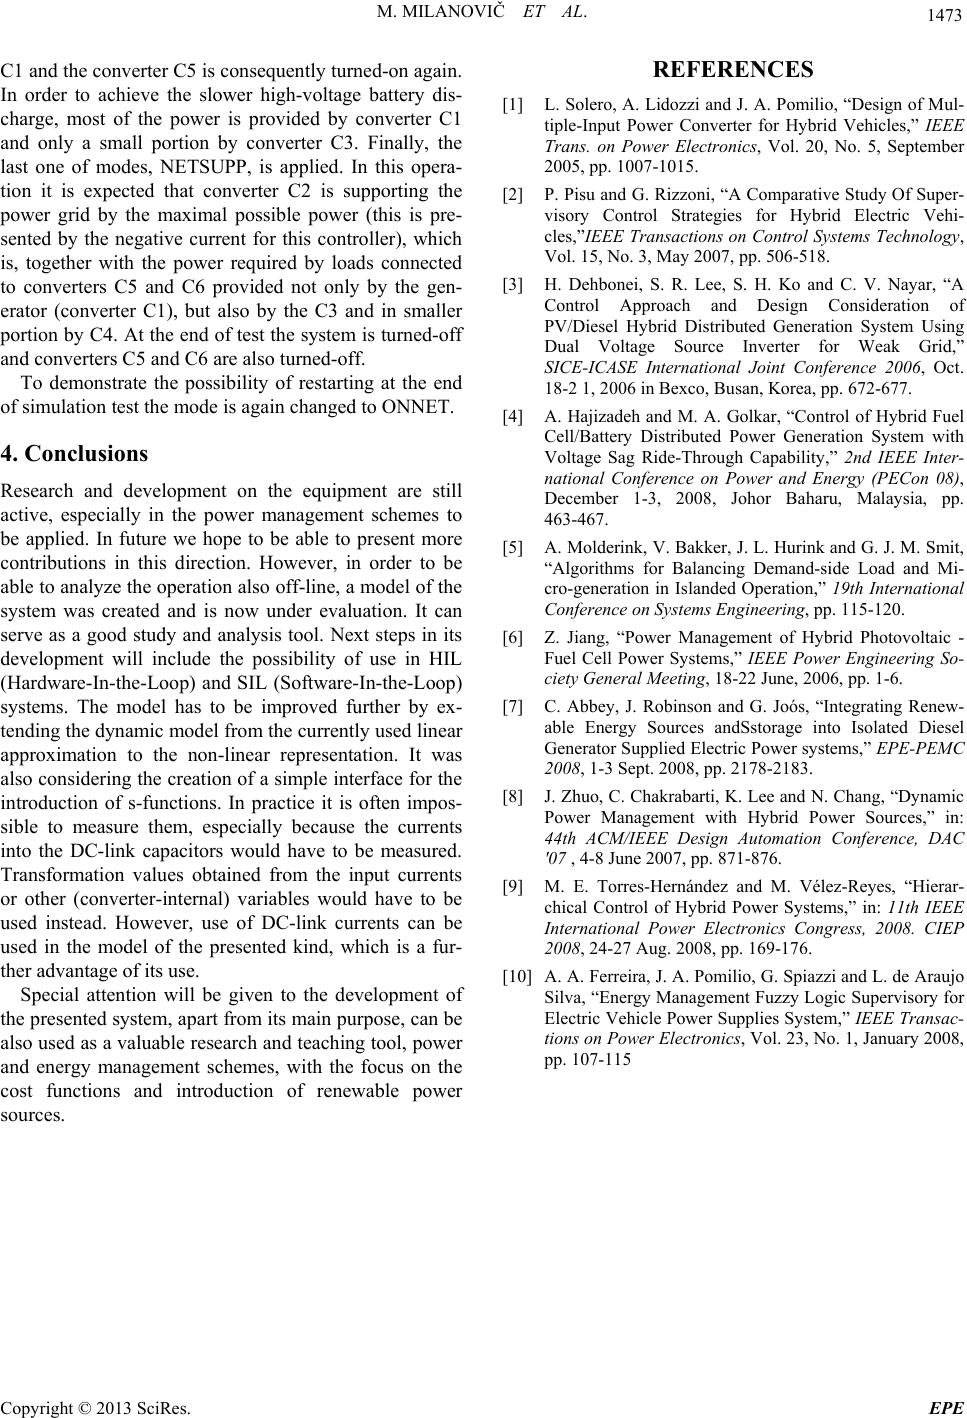 M. MILANOVIČ ET AL. Copyright © 2013 SciRes. EPE 1473 C1 and the converter C5 is consequently turned-on again. In order to achieve the slower high-voltage battery dis- charge, most of the power is provided by converter C1 and only a small portion by converter C3. Finally, the last one of modes, NETSUPP, is applied. In this opera- tion it is expected that converter C2 is supporting the power grid by the maximal possible power (this is pre- sented by the negative current for this controller), which is, together with the power required by loads connected to converters C5 and C6 provided not only by the gen- erator (converter C1), but also by the C3 and in smaller portion by C4. At the end of test the system is turned-off and converters C5 and C6 are also turned-off. To demonstrate the possibility of restarting at the end of simulation test the mode is again changed to ONNET. 4. Conclusions Research and development on the equipment are still active, especially in the power management schemes to be applied. In future we hope to be able to present more contributions in this direction. However, in order to be able to analyze the operation also off-line, a model of the system was created and is now under evaluation. It can serve as a good study and analysis tool. Next steps in its development will include the possibility of use in HIL (Hardware-In-the-Loop) and SIL (Software-In-the-Loop) systems. The model has to be improved further by ex- tending the dynamic model from the currently used linear approximation to the non-linear representation. It was also considering the creation of a simple interface for the introduction of s-functions. In practice it is often impos- sible to measure them, especially because the currents into the DC-link capacitors would have to be measured. Transformation values obtained from the input currents or other (converter-internal) variables would have to be used instead. However, use of DC-link currents can be used in the model of the presented kind, which is a fur- ther advantage of its use. Special attention will be given to the development of the presented system, apart from its main purpose, can be also used as a valuable research and teaching tool, power and energy management schemes, with the focus on the cost functions and introduction of renewable power sources. REFERENCES [1] L. Solero, A. Lidozzi and J. A. Pomilio, “Design of Mul- tiple-Input Power Converter for Hybrid Vehicles,” IEEE Trans. on Power Electronics, Vol. 20, No. 5, September 2005, pp. 1007-1015. [2] P. Pisu and G. Rizzoni, “A Comparative Study Of Super- visory Control Strategies for Hybrid Electric Vehi- cles,”IEEE Transactions on Control Systems Technology, Vol. 15, No. 3, May 2007, pp. 506-518. [3] H. Dehbonei, S. R. Lee, S. H. Ko and C. V. Nayar, “A Control Approach and Design Consideration of PV/Diesel Hybrid Distributed Generation System Using Dual Voltage Source Inverter for Weak Grid,” SICE-ICASE International Joint Conference 2006, Oct. 18-2 1, 2006 in Bexco, Busan, Korea, pp. 672-677. [4] A. Hajizadeh and M. A. Golkar, “Control of Hybrid Fuel Cell/Battery Distributed Power Generation System with Voltage Sag Ride-Through Capability,” 2nd IEEE Inter- national Conference on Power and Energy (PECon 08), December 1-3, 2008, Johor Baharu, Malaysia, pp. 463-467. [5] A. Molderink, V. Bakker, J. L. Hurink and G. J. M. Smit, “Algorithms for Balancing Demand-side Load and Mi- cro-generation in Islanded Operation,” 19th International Conference on Systems Engineering, pp. 115-120. [6] Z. Jiang, “Power Management of Hybrid Photovoltaic - Fuel Cell Power Systems,” IEEE Power Engineering So- ciety General Meeting, 18-22 June, 2006, pp. 1-6. [7] C. Abbey, J. Robinson and G. Joós, “Integrating Renew- able Energy Sources andSstorage into Isolated Diesel Generator Supplied Electric Power systems,” EPE-PEMC 2008, 1-3 Sept. 2008, pp. 2178-2183. [8] J. Zhuo, C. Chakrabarti, K. Lee and N. Chang, “Dynamic Power Management with Hybrid Power Sources,” in: 44th ACM/IEEE Design Automation Conference, DAC '07 , 4-8 June 2007, pp. 871-876. [9] M. E. Torres-Hernández and M. Vélez-Reyes, “Hierar- chical Control of Hybrid Power Systems,” in: 11th IEEE International Power Electronics Congress, 2008. CIEP 2008, 24-27 Aug. 2008, pp. 169-176. [10] A. A. Ferreira, J. A. Pomilio, G. Spiazzi and L. de Araujo Silva, “Energy Management Fuzzy Logic Supervisory for Electric Vehicle Power Supplies System,” IEEE Transac- tions on Power Electronics, Vol. 23, No. 1, January 2008, pp. 107-115 |