Paper Menu >>
Journal Menu >>
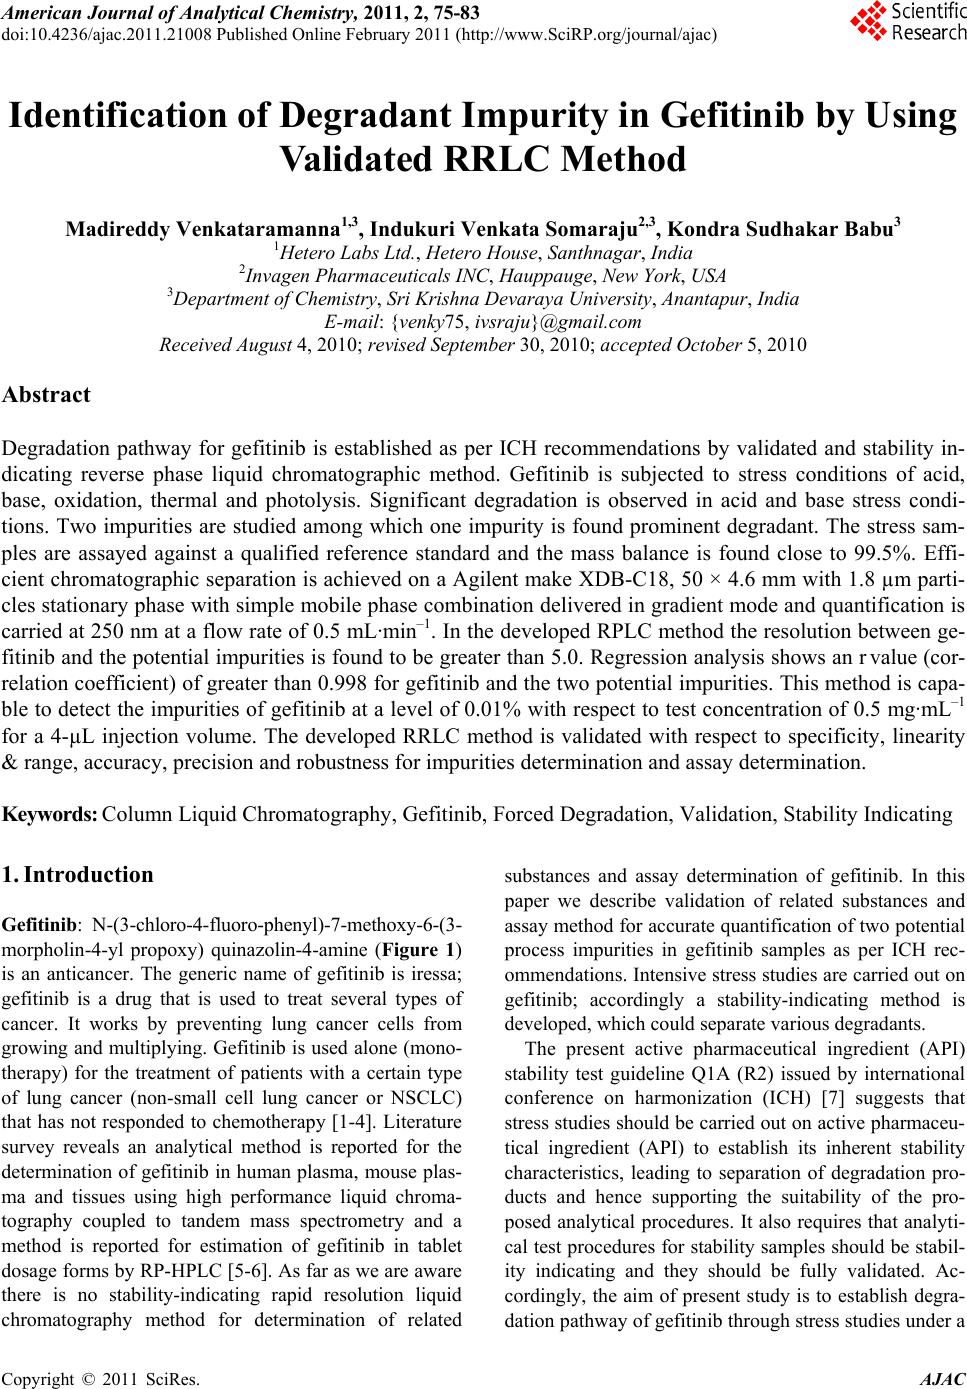 American Journal of Analyt ical Chemistry, 2011, 2, 75-83 doi:10.4236/ajac.2011.21008 Published Online February 2011 (http://www.SciRP.org/journal/ajac) Copyright © 2011 SciRes. AJAC Identification of Degradant Impurity in Gefitinib by Using Validated RRLC Method Madireddy Venkataramanna1,3, Indukuri Venkata Somaraju2,3, Kondra Sudhakar Babu3 1Hetero Labs Lt d., Hetero House, Santhnagar, India 2Invagen Pharmaceuticals INC, Hauppaug e, New York, USA 3Department of Che mistry, Sri Krishna Devaraya University, Anantapur, India E-mail: {venky75, ivsraju}@gmail.com Received August 4, 2010; revised Sept em ber 30, 2010; accepted October 5, 2010 Abstract Degradation pathway for gefitinib is established as per ICH recommendations by validated and stability in- dicating reverse phase liquid chromatographic method. Gefitinib is subjected to stress conditions of acid, base, oxidation, thermal and photolysis. Significant degradation is observed in acid and base stress condi- tions. Two impurities are studied among which one impurity is found prominent degradant. The stress sam- ples are assayed against a qualified reference standard and the mass balance is found close to 99.5%. Effi- cient chromatographic separation is achieved on a Agilent make XDB-C18, 50 × 4.6 mm with 1.8 µm parti- cles stationary phase with simple mobile phase combination delivered in gradient mode and quantification is carried at 250 nm at a flow rate of 0.5 mL·min–1. In the developed RPLC method the resolution between ge- fitinib and the potential impurities is found to be greater than 5.0. Regression analysis shows an r value (cor- relation coefficient) of greater than 0.998 for gefitinib and the two potential impurities. This method is capa- ble to detect the impurities of gefitinib at a level of 0.01% with respect to test concentration of 0.5 mg·mL–1 for a 4-µL injection volume. The developed RRLC method is validated with respect to specificity, linearity & range, accuracy, precision and robustness for impurities determination and assay determination. Keywords: Column Liquid Chromatography, Gefitinib, Forced Degradation, Validation, Stability Indicating 1. Introduction Gefitinib: N-(3-chloro-4-fluoro-phenyl)-7-methoxy-6-(3- morpholin-4-yl propoxy) quinazolin-4-amine (Figure 1) is an anticancer. The generic name of gefitinib is iressa; gefitinib is a drug that is used to treat several types of cancer. It works by preventing lung cancer cells from growing and multiplying. Gefitinib is used alone (mono- therapy) for the treatment of patients with a certain type of lung cancer (non-small cell lung cancer or NSCLC) that has not responded to chemotherapy [1-4]. Literature survey reveals an analytical method is reported for the determination of gefitinib in human plasma, mouse plas- ma and tissues using high performance liquid chroma- tography coupled to tandem mass spectrometry and a method is reported for estimation of gefitinib in tablet dosage forms by RP-HPLC [5-6]. As far as we are aware there is no stability-indicating rapid resolution liquid chromatography method for determination of related substances and assay determination of gefitinib. In this paper we describe validation of related substances and assay method for accurate quantification of two potential process impurities in gefitinib samples as per ICH rec- ommendations. Intensive stress studies are carried out on gefitinib; accordingly a stability-indicating method is developed, which could separate various degradants. The present active pharmaceutical ingredient (API) stability test guideline Q1A (R2) issued by international conference on harmonization (ICH) [7] suggests that stress studies should be carried out on active pharmaceu- tical ingredient (API) to establish its inherent stability characteristics, leading to separation of degradation pro- ducts and hence supporting the suitability of the pro- posed analytical procedures. It also requires that analyti- cal test procedures for stability samples should be stabil- ity indicating and they should be fully validated. Ac- cordingly, the aim of present study is to establish degra- dation pathway of gefitinib through stress studies under a 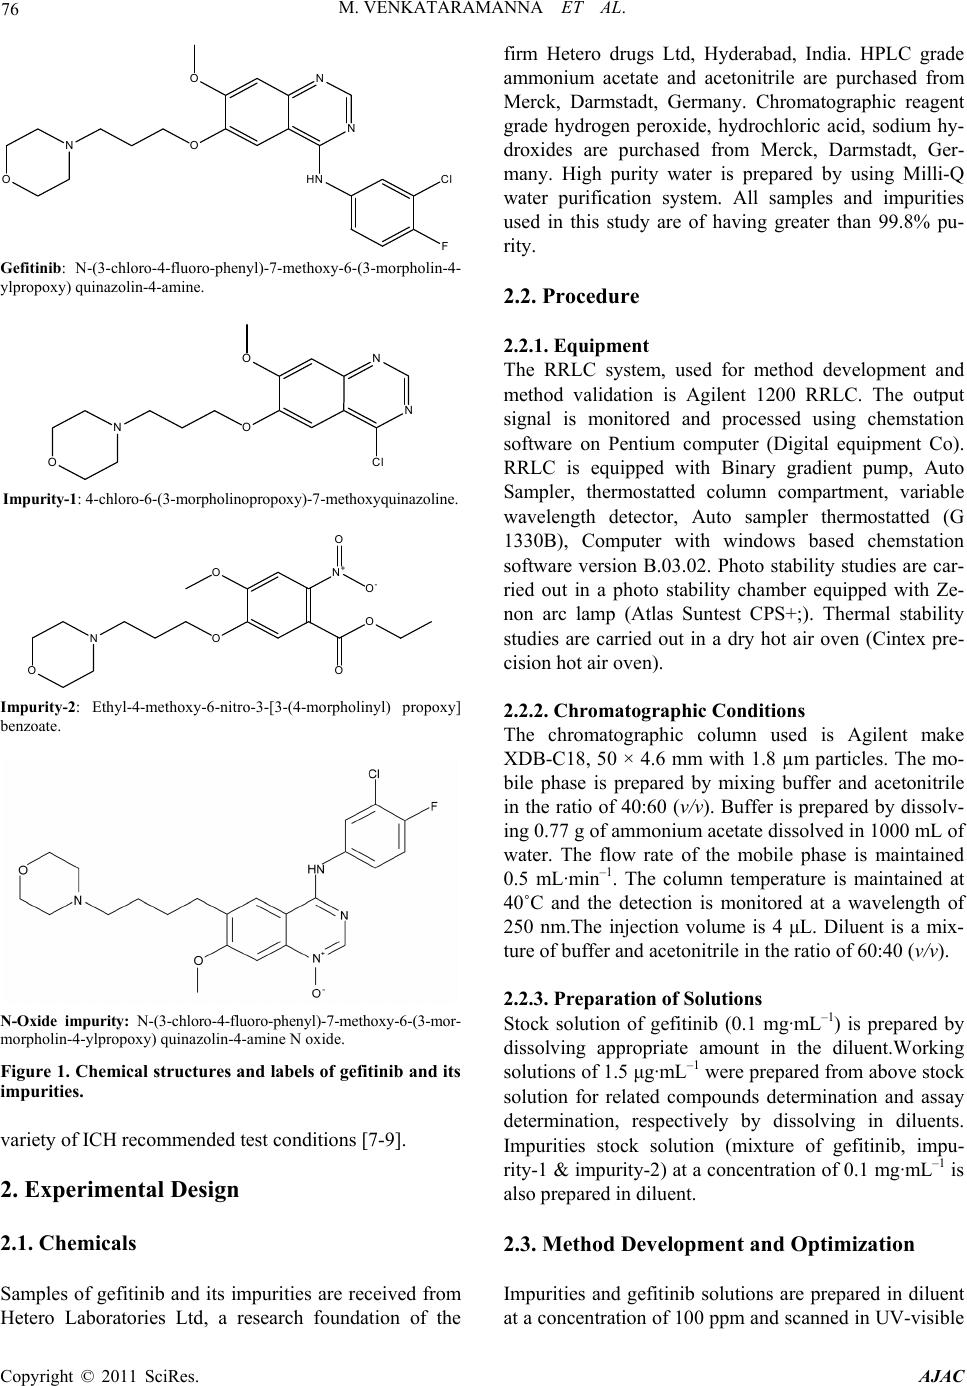 76 M. VENKATARAMANNA ET AL. N N HN ON O O F Cl Gefitinib: N-(3-chloro-4-fluoro-phenyl)-7-methoxy-6-(3-morpholin-4- ylpropoxy) quinazolin-4-amine. N N O O O N Cl Impurity-1: 4-chloro-6-(3-morpholinopropoxy)-7-methoxyquinazoline. O O ON O N+ O O- O Impurity-2: Ethyl-4-methoxy-6-nitro-3-[3-(4-morpholinyl) propoxy] benzoate. N-Oxide impurity: N-(3-chloro-4-fluoro-phenyl)-7-methoxy-6-(3-mor- morpholin-4-ylpropoxy) quinazolin-4-amine N oxide. Figure 1. Chemical structures and labels of gefitinib and its impurities. variety of ICH recommended test conditions [7-9]. 2. Experimental Design 2.1. Chemicals Samples of gefitinib and its impurities are received from Hetero Laboratories Ltd, a research foundation of the firm Hetero drugs Ltd, Hyderabad, India. HPLC grade ammonium acetate and acetonitrile are purchased from Merck, Darmstadt, Germany. Chromatographic reagent grade hydrogen peroxide, hydrochloric acid, sodium hy- droxides are purchased from Merck, Darmstadt, Ger- many. High purity water is prepared by using Milli-Q water purification system. All samples and impurities used in this study are of having greater than 99.8% pu- rity. 2.2. Procedure 2.2.1. Equipment The RRLC system, used for method development and method validation is Agilent 1200 RRLC. The output signal is monitored and processed using chemstation software on Pentium computer (Digital equipment Co). RRLC is equipped with Binary gradient pump, Auto Sampler, thermostatted column compartment, variable wavelength detector, Auto sampler thermostatted (G 1330B), Computer with windows based chemstation software version B.03.02. Photo stability studies are car- ried out in a photo stability chamber equipped with Ze- non arc lamp (Atlas Suntest CPS+;). Thermal stability studies are carried out in a dry hot air oven (Cintex pre- cision hot air oven). 2.2.2. Chromatographic Conditions The chromatographic column used is Agilent make XDB-C18, 50 × 4.6 mm with 1.8 µm particles. The mo- bile phase is prepared by mixing buffer and acetonitrile in the ratio of 40:60 (v/v). Buffer is prepared by dissolv- ing 0.77 g of ammonium acetate dissolved in 1000 mL of water. The flow rate of the mobile phase is maintained 0.5 mL·min–1. The column temperature is maintained at 40˚C and the detection is monitored at a wavelength of 250 nm.The injection volume is 4 μL. Diluent is a mix- ture of buffer and acetonitrile in the ratio of 60:40 (v/v). 2.2.3. Preparation of Solutions Stock solution of gefitinib (0.1 mg·mL–1) is prepared by dissolving appropriate amount in the diluent.Working solutions of 1.5 μg·mL–1 were prepared from above stock solution for related compounds determination and assay determination, respectively by dissolving in diluents. Impurities stock solution (mixture of gefitinib, impu- rity-1 & impurity-2) at a concentration of 0.1 mg·mL–1 is also prepared in diluent. 2.3. Method Development and Optimization Impurities and gefitinib solutions are prepared in diluent at a concentration of 100 ppm and scanned in UV-visible Copyright © 2011 SciRes. AJAC  M. VENKATARAMANNA ET AL. Copyright © 2011 SciRes. AJAC 77 Figure 2. Typical chromatograms of specification level impurities spiking in 100% sample and stress samples.  M. VENKATARAMANNA ET AL. Copyright © 2011 SciRes. AJAC 78 are analysed for an extended run time of 10 min to check .4.2. Precision the related substance method is checked e method is .4.3. Sensitivity mined by establishing the limit of de- .4.4. Linearity and Range LOQ to 150% with respect .4.5. Accuracy of the impurity stock solutions are .4.6. Robustness obustness of the developed method, experimental conditions are deliberately changed and the spectrometer; the two impurities and gefitinib are having UV maxima at 250 nm which is selected for method de- velopment purpose. To achieve separation of gefitinib from its impurities and degradation products chroma- tographic method is developed using various stationary phases like C8 and C18, different mobile phases con- taining buffers like phosphate and acetate and using or- ganic modifiers like acetonitrile and methanol in the mo- bile phase across the pH 2 to 8. Mobile phase of ammo- nium acetate and acetonitrile (60:40, v/v) is selected for initial trial on a BEH C18, 50 × 4.6 mm with 1.8 µm particles and flow rate at 1.0 mL·min–1. Spike sample analysis revealed that principal peak retention time is late and impurities 1 and 2 are not resolved properly. Similar results are obtained with Agilent XDB, C8 50 × 4.6 mm with 1.8 µm particles, with the 250 mm the tailing factor is observed more than 3 (broad shape). To increase the resolution between each component Agilent XDB C18 column with the dimensions 50 × 4.6 with 1.8 µm particles is selected. After several other tri- als satisfactory results (retention time of gefitinib is ~5.935 min and the resolution between all the impurities is >5.0) are obtained. In the optimized conditions gefit- inib, impurity-1, impurity-2 are well separated with a resolution greater than 5.0 and the typical retention times of gefitinib, impurity-1 and impurity-2, are about 5.923, 2.978 and 4.575 min respectively meeting the chroma- tographic system suitability requirements. In XDB C18 column with the dimensions 50 × 4.6 mm with 1.8 µm particles the components are separated with resolution above 5. In the optimized conditions tailing factor for all the components is observed between 0.8-1.5. Theorical plates are observed above 8000. 2.4. Analytical Method Validation The developed chromatographic method is validated for specificity and stress studies, sensitivity, linearity & range, precision, accuracy, robustness and system suit- ability [10-15]. 2.4.1. Specificity and Stress Studies Specificity is the ability of the method to measure the analyte response in the presence of its potential impuri- ties. The specificity [10-11] of the developed LC method for gefitinib is determined in the presence of its impuri- ties namely impurity-1 and impurity-2 at a concentration of 1.5 µg·mL–1 and degradants. The stress conditions employed for degradation study includes photolytic (car- ried out as per ICH Q1B), thermal (100˚C), acid hy- drolysis (1M HCl), base hydrolysis (2 M NaoH) and oxidation (6% H2O2). All stressed samples of gefitinib the late eluting degradants. Assays are carried out for stress samples against qualified reference standard and the mass balance (% assay + % of impurities + % of degradation products) is calculated for all the samples. 2 The precision of by injecting six individual preparations of (0.5 mg·mL–1) gefitinib spiked with 0.03% each impurity. The % RSD for percentage of each impurity is calculated. The intermediate precision (ruggedness) of th evaluated by different analyst using different column, different day and different analyst in the same laboratory. Precision is determined through repeatability (intra-day) and intermediate (inter-day) precision and calculated the % RSD for the area of each component. 2 Sensitivity is deter tection (LOD) and limit of quantification (LOQ) for ge- fitinib, impurity-1 and impurity-2 estimated based on signal-to-noise ratio method, by injecting a series of di- lute solutions with known concentration. The precision study is also carried out at the LOQ level by injecting six individual preparations of impurity-1 and impurity-2 and calculated the % RSD for the areas of each component. 2 Linearity test solutions from to test concentration are prepared by diluting the impu- rity stock solution to the required concentrations. For assay method test solutions from 50% to 150% with re- spect to test concentration are prepared by diluting the stock solution to the required concentrations. The corre- lation coefficient, slope and Y-intercept of the calibration curve are calculated for the both related substances and assay methods. 2 A known amount spiked to the previously analysed samples at LOQ (100% sample + 0.03% impurities), 100 (100% sample + 0.15% impurities) and 150% (100% sample + 0.225% impuri- ties) of the analyte concentration (0.5 mg·mL–1). The percentage of recoveries for impurity-1, impurity-2 are calculated. A known amount of gefitinib stock solution spiked to the sucrose at 50%, 100% and 150% of the analyte concentration (0.5 mg·mL–1). Each concentration level is prepared for three times. The percentage of re- coveries is calculated. 2 To determine the r  M. VENKATARAMANNA ET AL. 79 ty he solution stability of gefitinib and its related impuri- in dies ent stress condi- ons suggested the following degradation behavior. Ta- egradation in Acid Stress Condition efitinib is exposed for degradation with time in 1 M observed. efitinib is exposed for degradation with time in 2 M on is ob- resolution between each component is evaluated. The flow rate of the mobile phase is 0.5 mL·min–1. To study the effect of flow rate on the resolution, 0.03 units changed i.e. 0.3 and 0.7 mL·min–1. The effect of column temperature on resolution is studied at 35˚C and 45˚C instead of 40˚C. In the all above varied conditions, the components of the mobile phase are held constant. 2.4.7. Solution Stability and Mobile Phase Stabili T ties are carried out by leaving spiked sample solution tightly capped volumetric flask at room temperature for 48 h. Impurity content is determined for every 6 h inter- val up to the study period. Mobile phase stability is also carried out for 48 h by injecting the freshly prepared sample solutions for every 6 h interval. Impurity content is checked in the test solutions. Mobile phase prepared is kept constant during the study period. 3. Results and Discussion 3.1. Specificity and Stress Stu Stress studies on gefitinib under differ ti ble 2. 3.1.1. D G HCl upon heating for 6 h and no degradation is 3.1.2. Degradation in Base Stress Condition G NaOH upon heating for 6 h and no degradati served. 3.1.3. Degradation in Peroxide Stress Condition Gefitinib is gradually undergone degradation with time in 6% H2O2 upon heating for 2 h and prominent degrada- tion is observed as gefitinib N-Oxide. Gefitinib is sensi- tive to oxidative condition and is degraded into unknown impurities by oxidation using 6% H2O2. Gefitinib has shown significant sensitivity towards oxidative treatment. The drug gradually undergone degradation with time and degraded into unknown (~14.0%). The positive electro spray ionization (ESI) spectrum of the RT ~ 20.0 min impurity showed peaks at m/z 463.11(M + 1) which in- dicate the N-Oxide of gefitinib. The chemical name of the degradant at RT ~ 20.0 min could be N-(3-chloro-4- fluoro-phenyl)-7-methoxy-6-(3-morpholin-4-ylpropoxy) quinazolin-4-amine N oxide (Figure 4). 3.1.4. Degradation in Neutral Water Stress Condition Gefitinib is exposed water heating for 8 hours at 80˚C, no degradation is observed. 3.1.5. Photolytic Stress Condition Gefitinib is exposed to light for an overall illumination of 1.2 million Klux hours and an integrated near ultraviolet energy of 200-watt hours/square meter (w/mhr) (in photo stability chamber), no degradation is observed. Table 1. System suitability report. Compound USP resolution (RS ) USP tailing factor No. of theoretical plates (USP tangent method) Impurity-1--- 1.2 9998 Impurity-210.842 1.4 12115 Gefitinib 6.440 1.2 9099 Table 2. Summary of forced degradation results. Stress condition %Total impuriactive substance ance purities + % degradation p Remarks ties Study time % Assay of Mass bal (% assay + % im roducts) Acid hydrolysis (1 M HCI ) No degraducts were formed 0.15% 6 h 99.4 99.6 ation prod Base hydrolysis (2 M NaOH) 0.15% 6 h 99.4 99.6 No degradation product is formed Oxidation (15% H202) 14.0% 2 h 86.2 100.2 served fied as Th ) 0.16% 168 h 99.5 99.7 1200 /HrNs One major degradation ob- and identi N-oxide impurity of gefitnib by LC-MS No degradation products formed ermal (100˚C Light (photolytic degradation) 0.15% KLUX99.7 99.7 o prominent degradation i observed Copyright © 2011 SciRes. AJAC  M. VENKATARAMANNA ET AL. 80 3.1.6ss Condi efitin to dry heat at 0˚C fono d tinib, impurity-1 and impu- of area% of each impurity in precision veloped analytical method ediate pre study for gefiturity-1, efitinib, impurity-1 and impu- .01% (of analyte concentration, i.e. . Thermal Stretion 10Gib exposedr 168 hours, degradation is observed. The mass balance of stresse samples is close to 99.5%. The assay of gefitinib is unaffected in the presence of two impurities and its degradants confirm the stability indicating power of the developed method. 3.2. Method Validation 3.2.1. Precision he %RSD of area of gefiT rity-2 and %RSD study are less than 5.0 confirming the good precision of impurity-2 are less than 5.0, confirming the intermediate precision of the method. 3.2.2. Sensitivity he limit of detection of g the de interm . The %RSD obtained in inib, impcision T rity-2 is 0.01 and 0 –1 0.50 mg·mL) respectively for 4 L injection volume. The limit of quantification of gefitinib, impurity-1 and impurity-2 is 0.03 and 0.03% (of analyte concentration, i.e. 0.50 mg·mL–1) respectively for 4 L injection vol- ume. The % RSD for area of impurity-1 and impurity-2 are less than 5.0 for precision at LOQ level. Figure 3. Linearity chart for gefitinib and its impurities. Copyright © 2011 SciRes. AJAC  M. VENKATARAMANNA ET AL. 81 3.2.3. Linearity and Range Calibration curve obtained by the least square regression analysis between peak area and concentration exhibited linear relationship with a correlation coefficient of 0.998 over the ranges tested. Linear calibration plot for related substance method is obtained over the ranges tested, i.e. LOQ to 0.225% for Impurity-1, Impurity-2 and LOQ to 0.15% for gefitinib. The correlation coefficient obtained is greater than 0.998 for the two impurities and gefitinib. % Y-intercept is below 5.0 as per acceptable validation practices. The result shows an excellent correlation ex- isted between the peak area and concentration of gefit- inib and impurities. Linear calibration plot for assay de- termination method is obtained over the calibration ranges tested, i.e. 50% to 150% for gefitinib and the cor- relation coefficient is found more than 0.999.The results show an excellent correlation existed between the peak area and concentration of gefitinib in assay determination Figure 4. Mass spectrum of oxidation degradation impurity (Gefitinib N-oxide impurity) N-(3-chloro-4-fluoro-phenyl)-7- methoxy-6-(3-morpholin-4-ylpropoxy) quinazolin-4-amine N oxide. Copyright © 2011 SciRes. AJAC  M. VENKATARAMANNA ET AL. 82 Table 3. Linearity, regression results for impurities and gefitinib. Impurity-1 I mpurit y-2 Parameter Gefitinib Trend line equation Y = 221.31x − 4758 Y = 147.38x − 0.3698 Y = 307.72x − 1.0334 Range 0.03% - 0.15% 0.03% - 0.15% 0.03% - 0.15% Regression Coefficient 0.999 0.998 0.998 Slope 221.31 147.38 307.72 Intercept −0.4758 −0.3698 −1.0334 %Intercept with respect to 100% conc. response −1.84 −2.22 −2.99 Residual sum of Squares 0.5688 0.5562 2.7990 method (Figure 4, Table 3). 3.2.4. Accuracy The percentage recovery of impurity-1 and impurity-2 in bulk drug samples ranged from 97.35-101.91. HPLC chromatogram of Gefitinib bulk drug sample spiked with the two impurities is shown in Figure 2 (Table 4). 3.2.5. Robustness Analysis results for deliberately changed chromatogra- phic conditions (flow rate and column temperature) re- vealed that the resolution between closely eluting impu- rities, namely gefitinib and impurity-2 is greater than 5.0, illustrating the robustness of the method. Repeatability and reproducibility results also within the % RSD of 5.0. 3.2.6. Solution Stability and Mobile Phase Stability The %RSD of assay of gefitinib during solution stability and mobile phase stability experiments is within 1.0. No significant changes are observed in the content of impu- rity-1 and impurity-2 during solution stability and mobile phase stability experiments. The solution stability and mobile phase stability experiments data confirms that sample solutions and mobile phase used related sub- stance determination are stable up to the study period of 48 h. Analysis is performed for different samples of gefit- Table 4. Results study for related s. inib (n = 3). The two impurities in these samples are less than 0.1%. of accuracycompound Amount of impurity added (μg) to the 100% sample (n) % Recovery of impurity-1 % Recovery of impurity-2 0.03 99.80 101.91 0.10 99.08 101.77 0.15 101.23 97.35 n = 3, number of determinations. 4. Conclusion The degradation pathway of gefitinib is established as per ICH recommendations. The proposed method is validated as per ICH requirements. The isocratic RRLC method developed can be used for stress studies and for quantitative determination of related substance and assay of gefitinib. The developed method is stability indicative and can be employed in routine analysis of gefitinib production samples and also to analyze stability samples. 5. Acknowledgements The authors grateful to the management of Hetero labs limited for the extensive support in achieving this work. 6. References [1] D. H. Lee, J. Y. Han, H. T. Kim and J. S. Lee, “Gefitinib is of More Benefit in Chemotherapy-Naive Patients with Good Performance Status and Adenocarcinoma Histology: Retrospective Analysis of 575 Korean Patients,” Lung Cancer, Vol. 53, No. 3, 2006, pp. 339-345. doi:10.1016/j.lungcan.2006.05.015 [2] K. Kataoka, H. Taniguchi, Y. Hasegawa, Y. Kondoh, T. Kimura, O. Nishiyama, K. Imaizumi, T. Kawabe, H sociated with Gefitinib,” Respiratory Medicine, Vol. 100, doi:10.1016/j.rmed.2005.07.015 [3] Y. . T. Geng, X. D.Hu, X. F. Chen, . Shuib as a Trewith Ad- mall Lung Cl of Nanjing Medica versity, Vol. 23, No009, pp. 392-397. doi:10.1016/S1007-4376(09)600 [4] J. AOkamoto, R. Suto, Ywa and J. Sasaki, “Efthe Tyrosine Kinaor Gefitinib in a Patient Metastatic Small Cr,” Lung . Kume and K. Shimokata, “Interstitial Lung Disease As- No. 4, 2006, pp. 698-704. M. Yin, Y Li, X. L. W. Li and Y. Q First-Line Single Agent , “Efficacy of Gefitin atment in Patients vanced Non Sancer,” Journa l Uni. 6, 2 88-5 raki, I. . Ichika ficacy of with se Inhibit ell Lung Cance Copyright © 2011 SciRes. AJAC  M. VENKATARAMANNA ET AL. 83 Can 144. doi:10.10164.10.012 [5] V. K. Begum, J. S. d T. Satyanarayana, “The Estimation of Gefitinib in Tablet Research Journal of y, Vol. 2, No. 2, 2009, pp. 341-343. . Prenen, G. De Boeck, W. Van Dongen, E. 2. gs [11] M. Bakshi and S. Singh, “Development of Validated Stabdicating Assay Methods-Critical Review,” Journal of Pharmaceutical and Biomedical Analysis, Vol. 28, . 1011-1040. doi:10.1016/S0731-7085(02)00047-X 3] “Validation of Compendial Methods,” The United States , 12601 Twinbrook Parkway, >, 2009, pp. 2622-2625. r, “Method Validation in l Analysis: A Guide to Best Practice,” Wiley-VCH, GmbH & Co. KGaA, Weinheim, 2005, pp. tability Prin- Marcel Dekker, New cer, Vol. 48, No. 1, 2005, pp. 141- /j.lungcan.200 Kumar, N. A. Raju, S.Rao an Dosage Forms by RP-HPLC,” Pharmacy and Technolog [6] G. Guetens, H Esmans, F. Lemiere, A. Van Oosterome, P. Schoffski and E. De Bruijn, “Sensitive and Specific Quantification of the Anticancer Agent ZD1839 (Iressa) in Plasma by On-Column Focusing Capillary Liquid Chromatography-Tandem Mass Spectrometry,” Journal of Chromatography A, Vol. 1 No. 2-5, 2005, p.108 [7] “Stability Testing of New Drug Substances and Prod- ucts,” ICH, Q1A (R2), 2005. [8] “Photo Stability Testing of New Drug Substances and Products”, ICH, Q1B, 2005. [9] “Validation of Analytical Procedures: Text and Method- ology”, ICH Q2 (R1), 2005 10] S. W. Baertschi, K. Alsante and R. A. Reed, “Pharmaceu-[ tical Stress Testing: Predicting Drug Degradation,” Dru and the Pharmaceutical Sciences, Informa Healthca 205 re, 2005. ility In 2002, pp [12] “Guidance for Industry: Analytical Procedures and Meth- ods Validation,” US FDA, 2000. [1 Pharmacopeia Convention Rockville, MD, 20852, ch<1225 [14] M. E. Swartz and I. S. Krull, “Developing and Validating Stability Indicating Methods,” Pharmaceutical Technol- ogy, Vol. 23, No. 6, 2006, p. 46. [15] J. Ermer and J. H. M. Mille Pharmaceutica -208. [16] D. M. Bliesner, “Validating Chromatographic Methods: A Practical Guide,” Wiley-VCH, GmbH & Co. KGaA, Weinheim, 2006. [17] J. T. Carstensen and C. T. Rhodes, “Drug S ciples and Practices,” 3rd Edition, York, 2000. Copyright © 2011 SciRes. AJAC |