P. SOWA, K. ŁUSZCZ
Copyright © 2013 S ciRes. EPE
impression ab out the suitab ility of a particular method in
comparison to the others.
Pessimistic statement is that, despite many years of
research so far has not found a universal equivalent sys-
tem that would faithfully reproduce the behavior of the
electromagnetic power system transients. It seems that is
necessary to distinguish between the structure and the
search process parameter identification.
6. Final Remarks
To obtain reliable results in reduced system containing a
large number o f transmission lines will be subject to f ul-
fillment of conditions:
• Trans mission line, for which transient current
and/or voltage should be determined, must be modeled
taking into account the depending on the frequency pa-
rameters and withou t a ny simplifications.
S
P
K
BE
A
JV
Z
System SPM
System E
Sy st em B JSy st em A
M
Sy st em V Z
~
~
R
zs1
X
zs2
R
zs2
X
zs1
EQUIVALENT 1EQUIVALENT 2
Z
v1
= Z
f
/n
1
Z
v1
= Z
f
/n
2
Transmission
line model
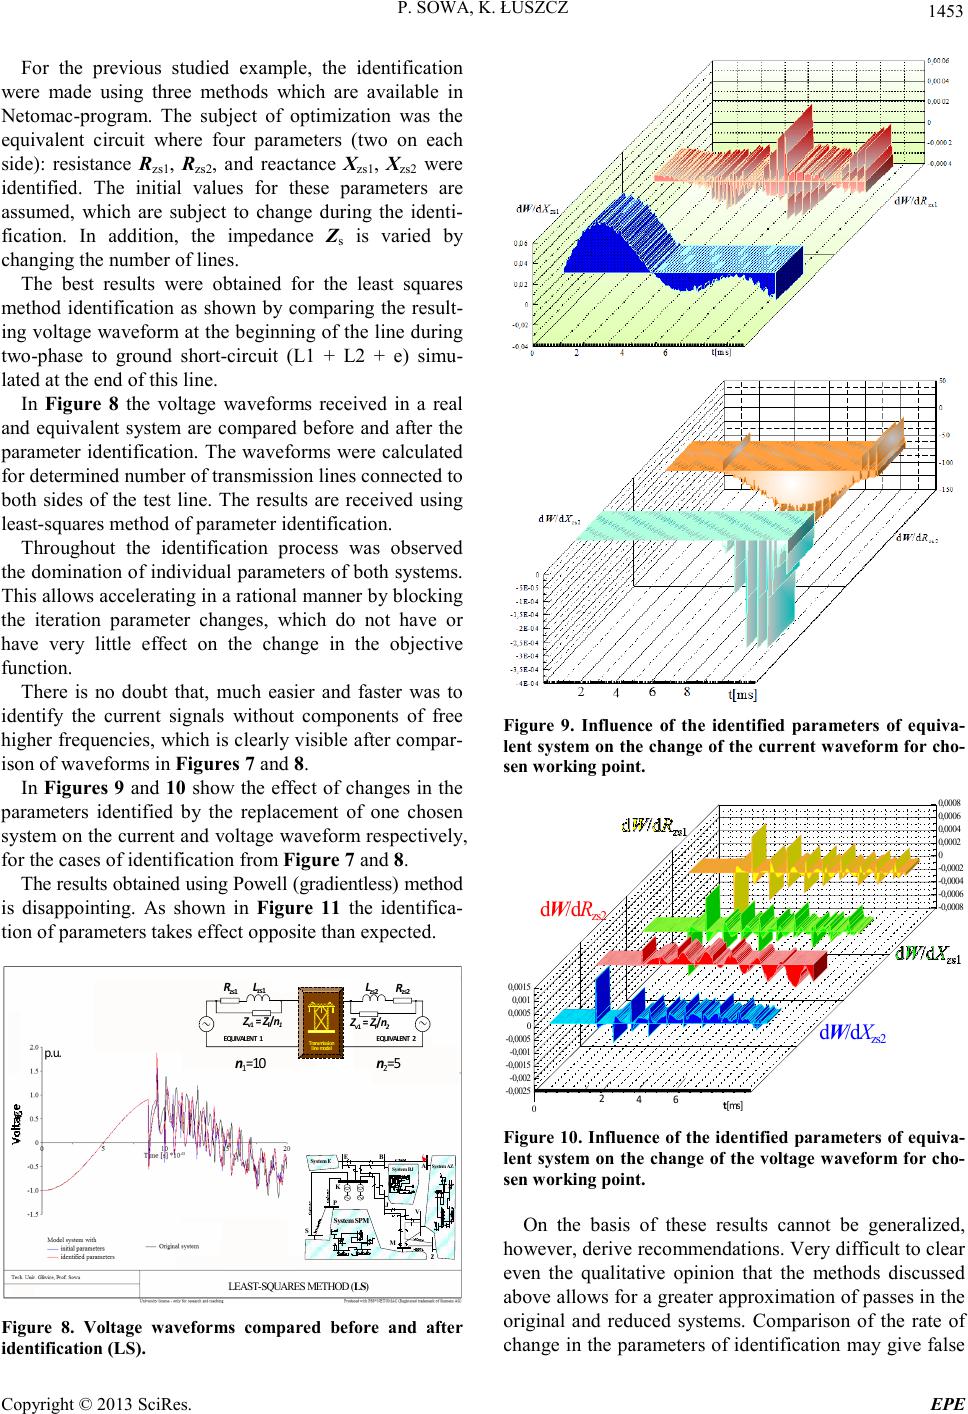
Powell- method
p.u.
n
1
=10 n
2
=5
Figure 11. Voltage waveforms compared before and after
identification (Powell).
Table 2. Recommendations for e quivalents during study of electromagnetic t ransient.
Action Knowledge of the structure
of the original system Finding structure
in doma in Parameter identification Reducti on Starting struc ture
YES
Simply supply or
non-connected system
lm frequency
obligate
static
redundant
all time inadvisable
connected lm frequency dynamic
all time inadvisable
NO
Results f rom mea surements
redundant redundant
or ANN
Only short circuit capacity
(determined number of lines)
5 or AN N
• Remaining part of the system which have to be re-
duced must be represented by equivalent whose parame-
ters are ide ntified by an appropriate optimization method.
Table 2 summarizes the recommended procedures in
the search for equivalents for the analysis of electromag-
netic t ransient phenomena .
REFERENCES
[1] GIGRE WG 13-05 III, “Transmission Line Representa-
tion for Energization and Reenergization Studies with
Complex Feeding Networks,” Electra, Vol. 62, 1979, pp.
45-78.
[2] P. Sowa, “Over voltage and Overcorrect During
Non-Simultaneous Faults in Transmission Lines,” IPST
95 International Conference on Power Systems Tran-
sients, Lisbon, 1 99 5, pp. 161-166
[3] J. R. Marti, “Accurate Modeling of F requency-Dependent
Transmission Lines in Electromagnetic Transient Simula-
tions,” IEEE Transactions on Power Apparatus and Sys-
tems, Vol. PAS-101, No. 1, 1982, pp. 147-152.
doi:10.1109/TPAS.1982.317332
[4] F. Castellanos and J. R. Marti, “Full Frequen-
cy-Dependent Phase-Domain Transmission Line Model,”
IEEE Transactions on Power Systems, Vol. 12, No. 3,
1997, pp . 1331-1339
[5] CIGRE Working Group 02 (SC 33), “Guidelines for Re-
presentation of Network Elements when Calculating
Transien t s,” CIGRE Brochure 39, 1990.
[6] M. Tran, “Transients Analysis Program for Personal
Computers,” MicroTran Power System Analysis Corpo-
ration, Published, 1991, Vancouver, B.C., Canada
[7] B. Kulicke, “Simulationsprogram Netomac: Differen-
zen-Leitwertverfahren bei kontinuierlichen und diskonti-
nuierlichen Systemen,” Siemens Forsch. and Entwickl.
Ber Bd., Vol. 10, No. 5, 1981 pp. 299-302.
[8] P. Sowa, “Dynamic Equivalent by Investigation of Elec-
tromagnetic Transients (in Polish),” Wydawnictwo Poli-
techniki Śląskiej, Gliwice 2011, p. 218.
[9] P. Sowa, “Replacement Diagrams of Systems with A
Large Number of Transmission Lines (in Polish),” Elec-
trical Review, No. 9, 2011, pp. 197-201.
[10] P. Sowa, A. M. Azmy and I. Erlich, “Dynamic Equiva-
lents for Calculation of Power System Restoration,”
Energetyka, 2004, pp. 104-108.
[11] P. Sowa, “Representation of Power System for Electro-