Paper Menu >>
Journal Menu >>
 Energy and Power Engineering, 2013, 5, 1421-1424 doi:10.4236/epe.2013.54B269 Published Online July 2013 (http://www.scirp.org/journal/epe) Date Conversion in BPA and PSS/E Based on China Southern Power Grid Kezhen Liu, Qinzhi Wang, Hongchun Shu, Hao Hu School of Electrical Engineering, Kunming University of Science and Technology, Kunming, China Email: liukzh@sina.com.cn, qin1988912@126.com Received March, 2013 ABSTRACT This paper undertakes transference of BPA date of the China Southern Power Grid into PSS/E data, covering a com- parison between DC data and calculated results of power flow which excluded DC data, testing the accuracy of trans- ference of power flow data, and demonstrating the transference program in data conversion is applicative. The results show that the two results fundamentally resemble each other, which indicates the transferred data is correct. Keywords: Flow Calculation; BPA; PSS/E; Date Conversion 1. Introduction PSS/E software with its powerful function of the simula- tion calculation has been more and more popular among domestic research institutions. In the past, to complete the BPA and PSS/E data transformation, manually change conversion method is usually used or write the corre- sponding data conversion program for a particular grid data [1,2]. This paper takes the southern power grid in 2015 high flow operation mode as an example, carrying on the conversion between BPA and PSS/E with the data conversion software, and compares the results of pure AC and hybrid AC/DC system. 2. The Data Description of the Southern Power Grid Southern power grid is a typical large capacity, long dis- tance, multi-area and interconnected power grid, com- posed of the five provinces of Guangdong, Guangxi, Hainan, Guizhou, Yunnan, power grid and the company directly under it, and connect the power grid of Hong Kong and Macao by the Guangdong power grid [3-5]. The BPA data of Southern power grid 2015 High flow operation mode include 1158 generators, 6405 AC nodes, 7636 branches and SanGuang, TianGuang, GuiGuang double circuits, YunGuang, Nuozhadu DC, Xiluodu DC, Jinzhong, Lanshang nine HVDC transmission system [6]. In the BPA data of Southern power grid 2015 High flow operation mode, the generators adopt sub-transient model, considering the role of excitation system, the prime motor, governor and power system stabilizer(PSS), the load adopt static ZIP mode[7-9]. The data contain EA, EK, EC, FK/FZ, FJ/FZ, FQ/F+, and FV/F+ seven excita- tion system models, GS+TA, GS+TB, GG, GH four prime motor and governor models, and SS, SG, SP, SI/SI+ four PSS models, DC circuit adopt steady-state model. For such a giant and complex network, the cost of manpower and material resources in the writing of BPA data is enormous. This paper converts it to PSS/E data with the help of BPA TO PSS/E data conversion soft- ware, greatly reducing the difficulty of manually filling original data and its stability data, saving a lot of man- power and resources, and reduces the risk of input errors. 3. The Flow Calculation Comparison of Pure AC Network Correct flow data conversion is the premise and basis for transient stability analysis, this paper makes flow calcu- lation of Southern power grid DC circuit using BPA and PSS/E separately to compare the correctness of the flow data conversion in the case of pure AC network. Due to space limitations, these paper only randomly select ten nodes as shown in Table 1(a), the largest node voltage amplitude difference is 0.0006, and the maximum phase difference is 0.06°. The result shows that the converted PSS/E flow data is very accurate and reliable. As shown in Table 1(b), the flow calculation results of BPA and PSS/E are consistent, which proves the BPA TO PSS/E data conversion software can convert the flow data of pure AC system. 4. The Comparison of Flow Calculation in Hybrid AC/DC System In the case of correct conversion in the pure AC system, Copyright © 2013 SciRes. EPE 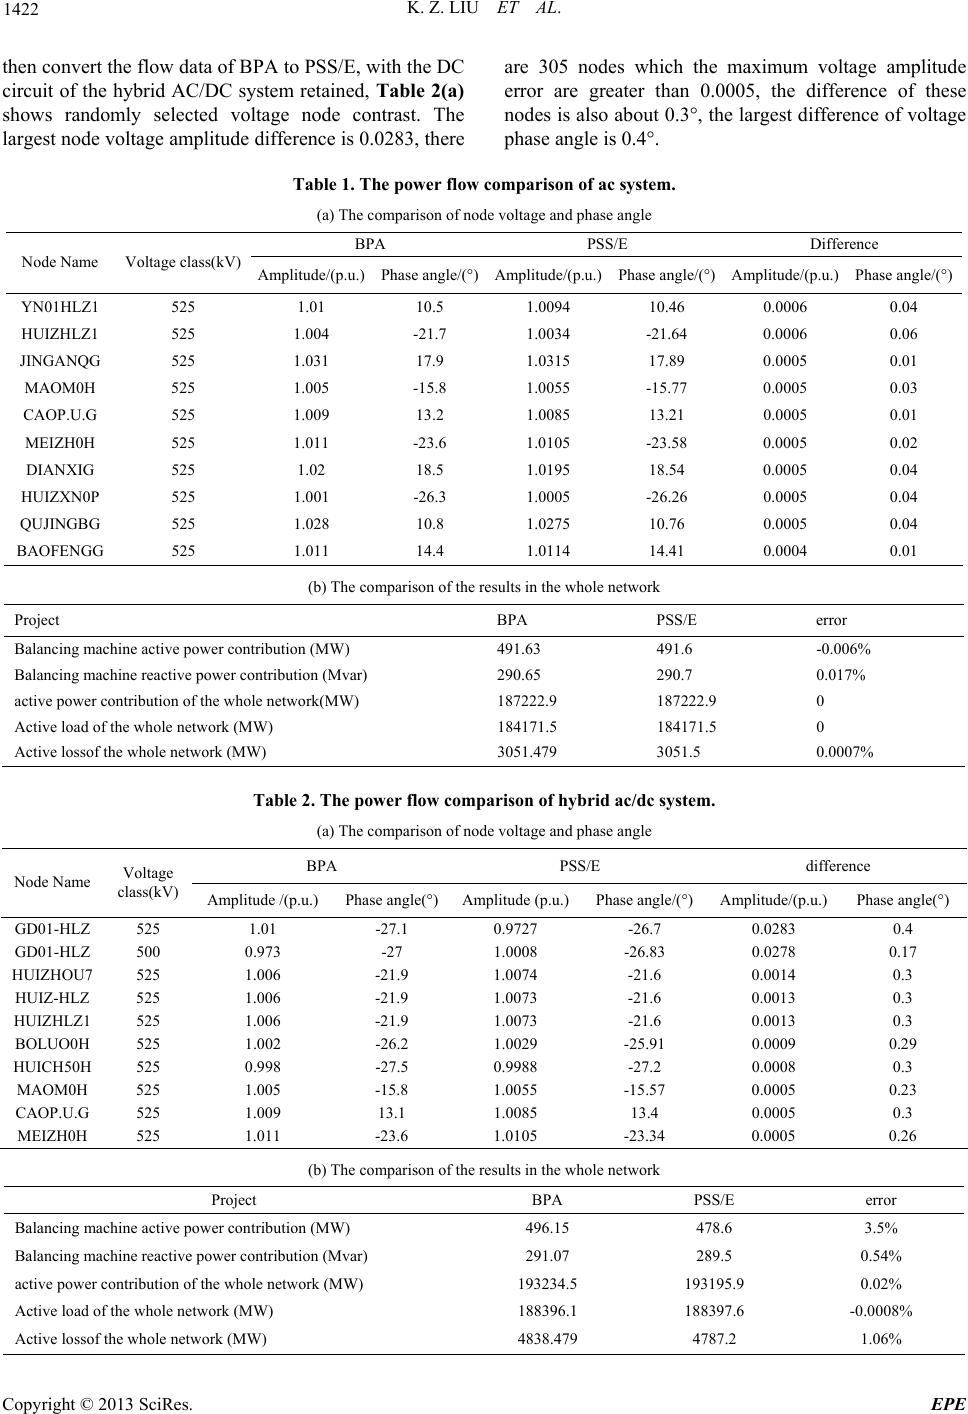 K. Z. LIU ET AL. 1422 then convert the flow data of BPA to PSS/E, with the DC circuit of the hybrid AC/DC system retained, Table 2(a) shows randomly selected voltage node contrast. The largest node voltage amplitude difference is 0.0283, there are 305 nodes which the maximum voltage amplitude error are greater than 0.0005, the difference of these nodes is also about 0.3°, the largest difference of voltage phase angle is 0.4°. Table 1. The power flow comparison of ac system. (a) The comparison of node voltage and phase angle BPA PSS/E Difference Node Name Voltage class(kV)Amplitude/(p.u.) Phase angle/(°)Amplitude/(p.u.) Phase angle/(°)Amplitude/(p.u.) Phase angle/(°) YN01HLZ1 525 1.01 10.5 1.0094 10.46 0.0006 0.04 HUIZHLZ1 525 1.004 -21.7 1.0034 -21.64 0.0006 0.06 JINGANQG 525 1.031 17.9 1.0315 17.89 0.0005 0.01 MAOM0H 525 1.005 -15.8 1.0055 -15.77 0.0005 0.03 CAOP.U.G 525 1.009 13.2 1.0085 13.21 0.0005 0.01 MEIZH0H 525 1.011 -23.6 1.0105 -23.58 0.0005 0.02 DIANXIG 525 1.02 18.5 1.0195 18.54 0.0005 0.04 HUIZXN0P 525 1.001 -26.3 1.0005 -26.26 0.0005 0.04 QUJINGBG 525 1.028 10.8 1.0275 10.76 0.0005 0.04 BAOFENGG 525 1.011 14.4 1.0114 14.41 0.0004 0.01 (b) The comparison of the results in the whole network Project BPA PSS/E error Balancing machine active power contribution (MW) 491.63 491.6 -0.006% Balancing machine reactive power contribution (Mvar) 290.65 290.7 0.017% active power contribution of the whole network(MW) 187222.9 187222.9 0 Active load of the whole network (MW) 184171.5 184171.5 0 Active lossof the whole network (MW) 3051.479 3051.5 0.0007% Table 2. The power flow comparison of hybrid ac/dc system. (a) The comparison of node voltage and phase angle BPA PSS/E difference Node Name Voltage class(kV) Amplitude /(p.u.) Phase angle(°)Amplitude (p.u.)Phase angle/(°)Amplitude/(p.u.) Phase angle(°) GD01-HLZ 525 1.01 -27.1 0.9727 -26.7 0.0283 0.4 GD01-HLZ 500 0.973 -27 1.0008 -26.83 0.0278 0.17 HUIZHOU7 525 1.006 -21.9 1.0074 -21.6 0.0014 0.3 HUIZ-HLZ 525 1.006 -21.9 1.0073 -21.6 0.0013 0.3 HUIZHLZ1 525 1.006 -21.9 1.0073 -21.6 0.0013 0.3 BOLUO0H 525 1.002 -26.2 1.0029 -25.91 0.0009 0.29 HUICH50H 525 0.998 -27.5 0.9988 -27.2 0.0008 0.3 MAOM0H 525 1.005 -15.8 1.0055 -15.57 0.0005 0.23 CAOP.U.G 525 1.009 13.1 1.0085 13.4 0.0005 0.3 MEIZH0H 525 1.011 -23.6 1.0105 -23.34 0.0005 0.26 (b) The comparison of the results in the whole network Project BPA PSS/E error Balancing machine active power contribution (MW) 496.15 478.6 3.5% Balancing machine reactive power contribution (Mvar) 291.07 289.5 0.54% active power contribution of the whole network (MW) 193234.5 193195.9 0.02% Active load of the whole network (MW) 188396.1 188397.6 -0.0008% Active lossof the whole network (MW) 4838.479 4787.2 1.06% Copyright © 2013 SciRes. EPE 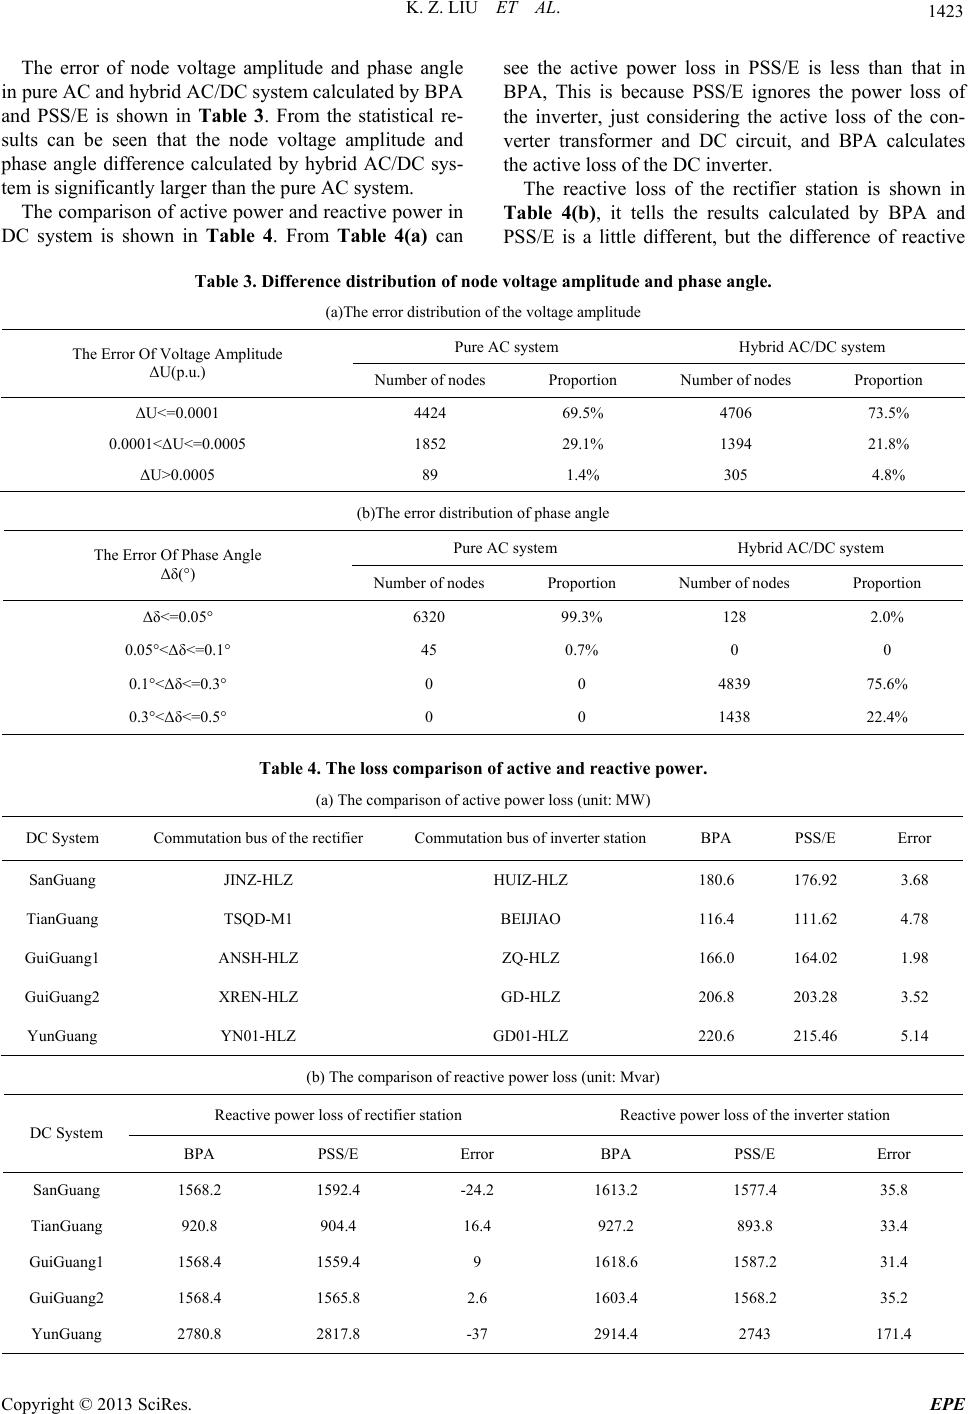 K. Z. LIU ET AL. 1423 The error of node voltage amplitude and phase angle in pure AC and hybrid AC/DC system calculated by BPA and PSS/E is shown in Table 3. From the statistical re- sults can be seen that the node voltage amplitude and phase angle difference calculated by hybrid AC/DC sys- tem is significantly larger than the pure AC system. The comparison of active power and reactive power in DC system is shown in Table 4. From Table 4(a) can see the active power loss in PSS/E is less than that in BPA, This is because PSS/E ignores the power loss of the inverter, just considering the active loss of the con- verter transformer and DC circuit, and BPA calculates the active loss of the DC inverter. The reactive loss of the rectifier station is shown in Table 4(b), it tells the results calculated by BPA and PSS/E is a little different, but the difference of reactive Table 3. Difference distribution of node voltage amplitude and phase angle. (a)The error distribution of the voltage amplitude Pure AC system Hybrid AC/DC system The Error Of Voltage Amplitude ΔU(p.u.) Number of nodes Proportion Number of nodes Proportion ΔU<=0.0001 4424 69.5% 4706 73.5% 0.0001<ΔU<=0.0005 1852 29.1% 1394 21.8% ΔU>0.0005 89 1.4% 305 4.8% (b)The error distribution of phase angle Pure AC system Hybrid AC/DC system The Error Of Phase Angle Δδ(°) Number of nodes Proportion Number of nodes Proportion Δδ<=0.05° 6320 99.3% 128 2.0% 0.05°<Δδ<=0.1° 45 0.7% 0 0 0.1°<Δδ<=0.3° 0 0 4839 75.6% 0.3°<Δδ<=0.5° 0 0 1438 22.4% Table 4. The loss comparison of active and reactive power. (a) The comparison of active power loss (unit: MW) DC System Commutation bus of the rectifier Commutation bus of inverter station BPA PSS/E Error SanGuang JINZ-HLZ HUIZ-HLZ 180.6 176.92 3.68 TianGuang TSQD-M1 BEIJIAO 116.4 111.62 4.78 GuiGuang1 ANSH-HLZ ZQ-HLZ 166.0 164.02 1.98 GuiGuang2 XREN-HLZ GD-HLZ 206.8 203.28 3.52 YunGuang YN01-HLZ GD01-HLZ 220.6 215.46 5.14 (b) The comparison of reactive power loss (unit: Mvar) Reactive power loss of rectifier station Reactive power loss of the inverter station DC System BPA PSS/E Error BPA PSS/E Error SanGuang 1568.2 1592.4 -24.2 1613.2 1577.4 35.8 TianGuang 920.8 904.4 16.4 927.2 893.8 33.4 GuiGuang1 1568.4 1559.4 9 1618.6 1587.2 31.4 GuiGuang2 1568.4 1565.8 2.6 1603.4 1568.2 35.2 YunGuang 2780.8 2817.8 -37 2914.4 2743 171.4 Copyright © 2013 SciRes. EPE  K. Z. LIU ET AL. 1424 loss of inverter station is large, it has some reasons as followed: 1) in the calculation process of PSS/E, the in- verter station is given the γ angle control, but BPA adopts the given voltage control; 2) BPA equivalently calculates each level of the bridge converter transformer. It is because there is difference between BPA and PSS/E in calculation method and DC system model, which leads to the calculation difference about reactive loss in in- verter station between both of the software. 5. Conclusions This paper introduces data conversion software for BPA TO PSS/E, and makes conversion of BPA date of the China Southern Power Grid into PSS/E data, through the test of the data between pure AC system and hybrid AC/DC system, presenting the BPA TO PSS/E software is feasible. The most important is that it reduces the dif- ficulty of manually filling original data and its stability data, saving a lot of manpower and resources, and re- duces the risk of input errors. REFERENCES [1] R. J. Zu and Y. S. Fu, “Digestion and Application of Ad- vanced Simulating Software PSS/E for Power System,” East China Electric Power, Vol. 2, 2001, pp. 8-11 [2] P. KUNDER, “Power System Stability and Control,” Beijing: China Electric Power Press, 2001 [3] H. Cheng and Z. Xu, “Comparison of Mathematical Mod- els For Transient Stability Calculation In Psasp and PSS/E Corresponding Calculation Results,” Power Sys- tem Technology, Vol. 28, No. 5, 2004, pp. 1-5 [4] Program Operation Manual of PSS/E-30. America: Power Technologies Inc(PTI), 2004 [5] Program Application Guide of PSS/E-30. America Power Technologies Inc(PTI),2004 [6] User Manual of PSS/E-30. America: Power Technologies Inc(PTI),2004 [7] L. Zhao, B. Li, G. Q. Bu, Z. G. Chen and J. F. Zhong, “Study on Dynamic Equivalence of ±800 kV DC Trans- mission System from Yunnan to Guangdong,” Power System Technology, Vol. 30, No. 16, 2006, pp. 6-10 [8] Y. Huang, Z. Xu and H. He, “HVDC Models Of PSS/E And Their Applicability In Simulations,” Power System Technology, Vol. 28, No. 5, 2004, pp. 25-29 [9] R. Yang, “Studies on Comparison of Models and Calcu- lation Results in BPA and PSS/E and Data Interface Pro- gram Developing,” Beijing: North China Electric Power University,2006 Copyright © 2013 SciRes. EPE |