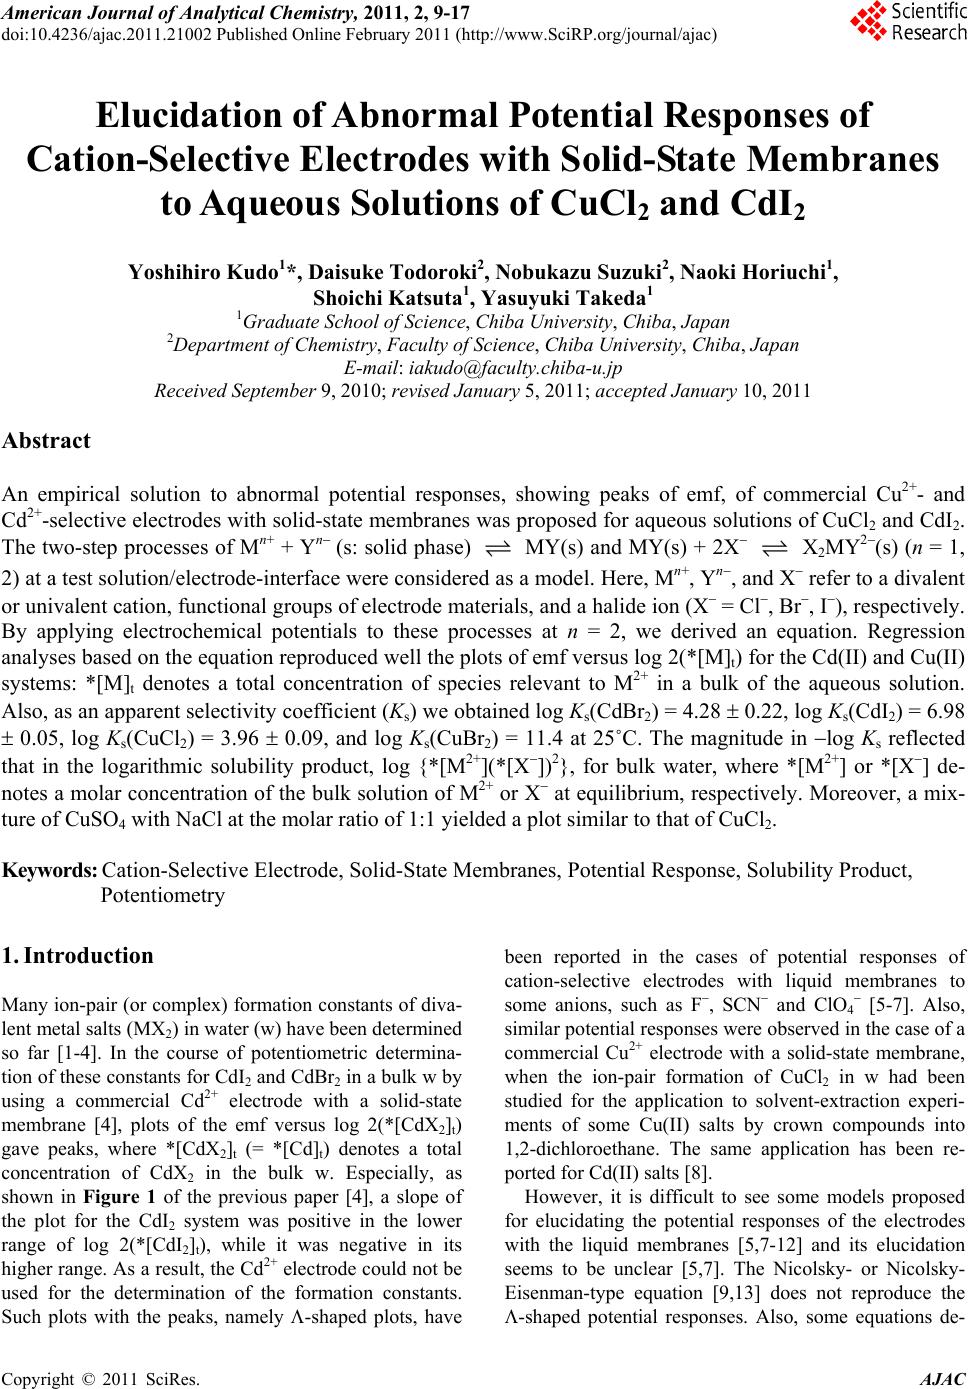
 American Journal of Analyt ical Chemistry, 2011, 2, 9-17 doi:10.4236/ajac.2011.21002 Published Online February 2011 (http://www.SciRP.org/journal/ajac) Copyright © 2011 SciRes. AJAC Elucidation of Abnormal Potential Responses of Cation-Selective Electrodes with Solid-State Membranes to Aqueous Solutions of CuCl2 and CdI2 Yoshihiro Kudo1*, Daisuke Todoroki2, Nobukazu Suzuki2, Naoki Horiuchi1, Shoichi Katsuta1, Yasuyuki Takeda1 1Graduate School of Sci ence, Chiba University, Chiba, Japan 2Department of Che mistry, Faculty of Science, Chiba University, Chiba, Japan E-mail: iakudo@faculty.chiba-u.jp Received September 9, 2010; revised January 5, 2011; accepted January 10, 2011 Abstract An empirical solution to abnormal potential responses, showing peaks of emf, of commercial Cu2+- and Cd2+-selective electrodes with solid-state membranes was proposed for aqueous solutions of CuCl2 and CdI2. The two-step processes of Mn+ + Yn (s: solid phase) MY(s) and MY(s) + 2X X2MY2(s) (n = 1, 2) at a test solution/electrode-interface were considered as a model. Here, Mn+, Yn, and X refer to a divalent or univalent cation, functional groups of electrode materials, and a halide ion (X = Cl, Br, I), respectively. By applying electrochemical potentials to these processes at n = 2, we derived an equation. Regression analyses based on the equation reproduced well the plots of emf versus log 2(*[M]t) for the Cd(II) and Cu(II) systems: *[M]t denotes a total concentration of species relevant to M2+ in a bulk of the aqueous solution. Also, as an apparent selectivity coefficient (Ks) we obtained log Ks(CdBr2) = 4.28 0.22, log Ks(CdI2) = 6.98 0.05, log Ks(CuCl2) = 3.96 0.09, and log Ks(CuBr2) = 11.4 at 25˚C. The magnitude in log Ks reflected that in the logarithmic solubility product, log {*[M2+](*[ X ])2}, for bulk water, where *[M2+] or *[X] de- notes a molar concentration of the bulk solution of M2+ or X at equilibrium, respectively. Moreover, a mix- ture of CuSO4 with NaCl at the molar ratio of 1:1 yielded a plot similar to that of CuCl2. Keywords: Cation-Selective Electrode, Solid-State Membranes, Potential Response, Solubility Product, Potentiometry 1. Introduction Many ion-pair (or complex) formation constants of diva- lent metal salts (MX2) in water (w) have been determined so far [1-4]. In the course of potentiometric determina- tion of these constants for CdI2 and CdBr2 in a bulk w by using a commercial Cd2+ electrode with a solid-state membrane [4], plots of the emf versus log 2(*[CdX2]t) gave peaks, where *[CdX2]t (= *[Cd]t) denotes a total concentration of CdX2 in the bulk w. Especially, as shown in Figure 1 of the previous paper [4], a slope of the plot for the CdI2 system was positive in the lower range of log 2(*[CdI2]t), while it was negative in its higher range. As a result, the Cd2+ electrode could not be used for the determination of the formation constants. Such plots with the peaks, namely -shaped plots, have been reported in the cases of potential responses of cation-selective electrodes with liquid membranes to some anions, such as F, SCN and ClO4 [5-7]. Also, similar potential responses were observed in the case of a commercial Cu2+ electrode with a solid-state membrane, when the ion-pair formation of CuCl2 in w had been studied for the application to solvent-extraction experi- ments of some Cu(II) salts by crown compounds into 1,2-dichloroethane. The same application has been re- ported for Cd(II) salts [8]. However, it is difficult to see some models proposed for elucidating the potential responses of the electrodes with the liquid membranes [5,7-12] and its elucidation seems to be unclear [5,7]. The Nicolsky- or Nicolsky- Eisenman-type equation [9,13] does not reproduce the -shaped potential responses. Also, some equations de- 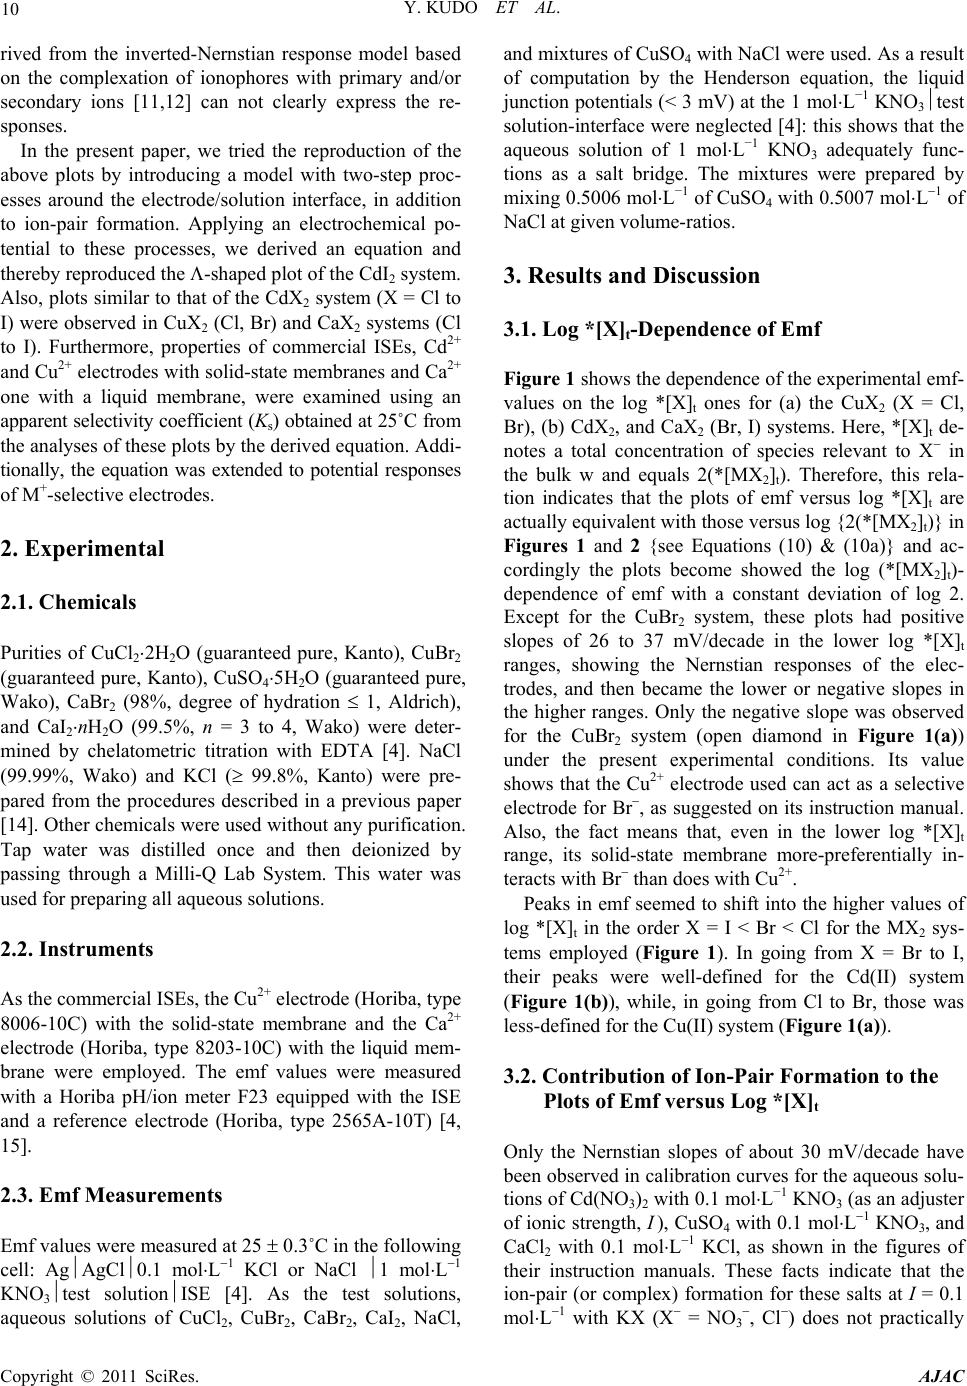 10 Y. KUDO ET AL. rived from the inverted-Nernstian response model based on the complexation of ionophores with primary and/or secondary ions [11,12] can not clearly express the re- sponses. In the present paper, we tried the reproduction of the above plots by introducing a model with two-step proc- esses around the electrode/solution interface, in addition to ion-pair formation. Applying an electrochemical po- tential to these processes, we derived an equation and thereby reproduced the -shaped plot of the CdI2 system. Also, plots similar to that of the CdX2 system (X = Cl to I) were observed in CuX2 (Cl, Br) and CaX2 systems (Cl to I). Furthermore, properties of commercial ISEs, Cd2+ and Cu2+ electrodes with solid-state membranes and Ca2+ one with a liquid membrane, were examined using an apparent selectivity coefficient (Ks) obtained at 25˚C from the analyses of these plots by the derived equation. Addi- tionally, the equation was extended to potential responses of M+-selective electrodes. 2. Experimental 2.1. Chemicals Purities of CuCl22H2O (guaranteed pure, Kanto), CuBr2 (guaranteed pure, Kanto), CuSO45H2O (guaranteed pure, Wako), CaBr2 (98%, degree of hydration 1, Aldrich), and CaI2nH2O (99.5%, n = 3 to 4, Wako) were deter- mined by chelatometric titration with EDTA [4]. NaCl (99.99%, Wako) and KCl ( 99.8%, Kanto) were pre- pared from the procedures described in a previous paper [14]. Other chemicals were used without any purification. Tap water was distilled once and then deionized by passing through a Milli-Q Lab System. This water was used for preparing all aqueous solutions. 2.2. Instruments As the commercial ISEs, the Cu2+ electrode (Horiba, type 8006-10C) with the solid-state membrane and the Ca2+ electrode (Horiba, type 8203-10C) with the liquid mem- brane were employed. The emf values were measured with a Horiba pH/ion meter F23 equipped with the ISE and a reference electrode (Horiba, type 2565A-10T) [4, 15]. 2.3. Emf Measurements Emf values were measured at 25 0.3˚C in the following cell: AgAgCl0.1 molL1 KCl or NaCl 1 molL1 KNO3test solutionISE [4]. As the test solutions, aqueous solutions of CuCl2, CuBr2, CaBr2, CaI2, NaCl, and mixtures of CuSO4 with NaCl were used. As a result of computation by the Henderson equation, the liquid junction potentials (< 3 mV) at the 1 molL−1 KNO3test solution-interface were neglected [4]: this shows that the aqueous solution of 1 molL−1 KNO3 adequately func- tions as a salt bridge. The mixtures were prepared by mixing 0.5006 molL−1 of CuSO4 with 0.5007 molL1 of NaCl at given volume-ratios. 3. Results and Discussion 3.1. Log *[X]t-Dependence of Emf Figure 1 shows the dependence of the experimental emf- values on the log *[X]t ones for (a) the CuX2 (X = Cl, Br), (b) CdX2, and CaX2 (Br, I) systems. Here, *[X]t de- notes a total concentration of species relevant to X in the bulk w and equals 2(*[MX2]t). Therefore, this rela- tion indicates that the plots of emf versus log *[X]t are actually equivalent with those versus log {2(*[MX2]t)} in Figures 1 and 2 {see Equations (10) & (10a)} and ac- cordingly the plots become showed the log (*[MX2]t)- dependence of emf with a constant deviation of log 2. Except for the CuBr2 system, these plots had positive slopes of 26 to 37 mV/decade in the lower log *[X]t ranges, showing the Nernstian responses of the elec- trodes, and then became the lower or negative slopes in the higher ranges. Only the negative slope was observed for the CuBr2 system (open diamond in Figure 1(a)) under the present experimental conditions. Its value shows that the Cu2+ electrode used can act as a selective electrode for Br, as suggested on its instruction manual. Also, the fact means that, even in the lower log *[X]t range, its solid-state membrane more-preferentially in- teracts with Br than does with Cu2+. Peaks in emf seemed to shift into the higher values of log *[X]t in the order X = I < Br < Cl for the MX2 sys- tems employed (Figure 1). In going from X = Br to I, their peaks were well-defined for the Cd(II) system (Figure 1(b)), while, in going from Cl to Br, those was less-defined for the Cu(II) system (Figure 1(a)). 3.2. Contribution of Ion-Pair Formation to the Plots of Emf versus Log *[X]t Only the Nernstian slopes of about 30 mV/decade have been observed in calibration curves for the aqueous solu- tions of Cd(NO3)2 with 0.1 molL−1 KNO3 (as an adjuster of ionic strength, I ), CuSO4 with 0.1 molL1 KNO3, and CaCl2 with 0.1 molL1 KCl, as shown in the figures of their instruction manuals. These facts indicate that the ion-pair (or complex) formation for these salts at I = 0.1 molL1 with KX (X = NO3 , Cl) does not practically Copyright © 2011 SciRes. AJAC  Y. KUDO ET AL. 11 (a) (b) Figure 1. Plots of emf versus log *[X]t for the CuX2 (X = Cl : ○; Br: ◊), CdX2 {Br: □; I: + [4]}, and CaX2 systems (Br: ; I:). influence the linearity of the calibration curves. For ex- ample, the calibration curve for the aqueous solution of CuSO4 is expressed as emf = a + b log *[Cu2+] = a + b log [*[Cu]t/{1 + KCuSO4(*[SO2– 4])}] a’ + b log *[Cu]t, being the experimental equation of the calibration curve, where KCuSO4 = *[CuSO4]/(*[Cu2+])*[SO2– 4] ( 251 molL1 [16]), *[Cu]t = *[Cu2+] + *[CuSO4], and a’ a b log {1 + KCuSO4(*[SO2– 4])}. The symbol *[Cu2+] or *[CuSO4] refers to a molar concentration of Cu2+ or CuSO4 in the bulk w at equilibrium, respectively. This relation of emf to log *[Cu]t suggests that, in spite of the larger KCuSO4 value, the condition of either 1 >> KCuSO4 (*[SO2– 4]) or 1 + KCuSO4(*[SO2– 4]) constant holds actually. In other words, the condition indicates that the Figure 2. Plots of emf versus log *[Cl]t for the CuCl2 sys- tem. ion-pair formation is less effective for the b (slope) value of the calibration curve, while it is somewhat effective for the a (intercept) value. Also, it is predicted that its effects on the Cd(NO3)2 and CaCl2 (KCaCl 41 molL1 at 25˚C [4,15]) solutions are lower than that on the CuSO4 solution. In comparison with the KCuSO4 value(s) [16], the above condition should hold for the CdI2 system with KCdI 308 molL1 at 25˚C [4]: emf = a + b log *[Cd2+] a + b log [*[Cd]t/{1 + KCdI(*[I])}] a’ + b log *[Cd]t in the log *[Cd]t range of 5 to 2 at least [4], where *[Cd]t *[Cd2+] + *[CdI+] = *[Cd2+] + KCdI(*[Cd2+])*[I]. These results indicate that the condition of 1 >> KMX(*[X]) holds for the present MIIXn (n = 1, 2) systems. The same discussion should be true of *[X]t because of *[X]t = 2(*[M]t). The above results may be similar to that clari- fied by Kakiuchi: when the volume ratio of the mem- brane to the test solution approaches zero, the potential generated at its interface does not affected by the ion-pair formation in the membrane [17]. 3.3. Semi-Theoretical Treatment for Potential Response of M2+-Selective Electrodes to X We considered here the following three processes around the test solution/ISE-interface for the electrode response, neglecting the formation of MX2. 22 MYs:solid phaseMYs (1) 2 2 MYs2XX MYs (2) 2 MX MX (3) Here, taking the easy formation of four-coordinated Cu(II) and Cd(II) complexes with X into account, we neglected the formation of XMY species in Equation (2). Copyright © 2011 SciRes. AJAC  12 Y. KUDO ET AL. For the overall process of the electrode processes (1) and (2), therefore, the corresponding equilibrium-constant was defined as 2 222 2ss 2 22 2 2ss XMYM YX XMYYMX K (4) and those for the process (1) to (3) were 22 1ss MY MYK , (1a) 2 2 22 s s XMYMY XK (2a) and +2 MX +2 MXM X *MX*M*X, K (3a) where [j] and *[j] refer to molar concentrations of spe- cies j (= M2+, MX+, X) around the electrode interface and j in a bulk of the test solution, respectively. The subscript (or superscript) “s” means the solid phase of the electrode and can be replaced by “o”, which means an organic phase, for the liquid membrane ISE. We used here the molar concentrations instead of the activities, because they render the theoretical treatment compli- cated and also the experimental calibration curves keep linearity in the ranges of 10−5 (or 10−6) to 10−1 molL−1 for Cu2+ in w, 10−6 to 10−1 molL−1 for Cd2+, and 2.5 10−5 to 0.25 (or 1) molL−1 for Ca2+, as shown in the specifications [18-20] of a Website. The above electrode processes (1) and (2) at the inter- face were also expressed by electrochemical potentials ( ) as follows. ss MY MY (1b) s MYX X2MY 2 s (2b) Arranging Equations (1b) and (2b) by the properties of [21], we have easily 0s 00s s2 YMMY YM ln M 22 RT F (5) 0 YM ln M 2 RT 2 (5a) 0s0 0s sX2MYXMY X2MY X2 2ln 22 RT F (6) 0 X2MY X2 ln 2 RT . (6a) Here, j, 0 j , and 0 denote an inner potential for the species j (= M2+, Y2, X2MY2) in each phase, a standard electrode potential, and a standard chemical potential corresponding to j, respectively. R, T and F have the usual meanings. By the sum of Equations (5a) and (6a), we could express the emf value in question as 020 YMX2MYX 2 emfln Mln 22 RT RT F . (7) Also, the following relations were derived from mass balance equations around the test solution/electrode- interface. 22 2 ts s 22 2s 2 22 s MMMXMYX MY MMXXMY M1YXK (8) by assuming that 1 >> K2[X]2 and then 1 + K[Y2]s[X]2 >> KMX[X] (see above for 1 >> KMX[X]) and 2 2 ts 222 MX s XX MX2XMY X1M2YMX X KK g (8a) with g = 1 + KMX[M2+] + 2K[Y2]s[M2+][X]. Rearrang- ing Equation (8) as * M 2t 2 2 st * M t 2 * 2 2 X st M M 1Y X M 1Y X D Kg D KDg (9) with DM = [M]t/*[M]t { ([M2+] + [MX+] + [MY]s + [X2MY2]s)/(*[M2+] + *[MX+])} and DX = [X]t/*[X]t { ([X] + [MX+] + 2[X2MY2]s)/(*[X] + *[MX+])} and then introducing Equation (9) into Equation (7), we have easily * 00 m YM X2MYXt 2 * st emflnln X 222 ln1X 2 K RT RT FF RT K F (10) * 00 YM X2MYXmt 2 * st lnln M 22 ln14M 2 RT RT K FF RT K F (10a) with DMK2 = Km, K[Y2]s(DX/g)2 {= K[Y2]s([X]/*[X]t)2 = ([X2MY2]s/[M2+]) /(* [X]t)2} = Ks, and *[X]t = 2(*[M]t) {= 2(*[MX2]t)}. Here, the DM and DX values like distri- bution ratios at the test solution/electrode-interface were assumed to be much smaller than unity and the term Copyright © 2011 SciRes. AJAC 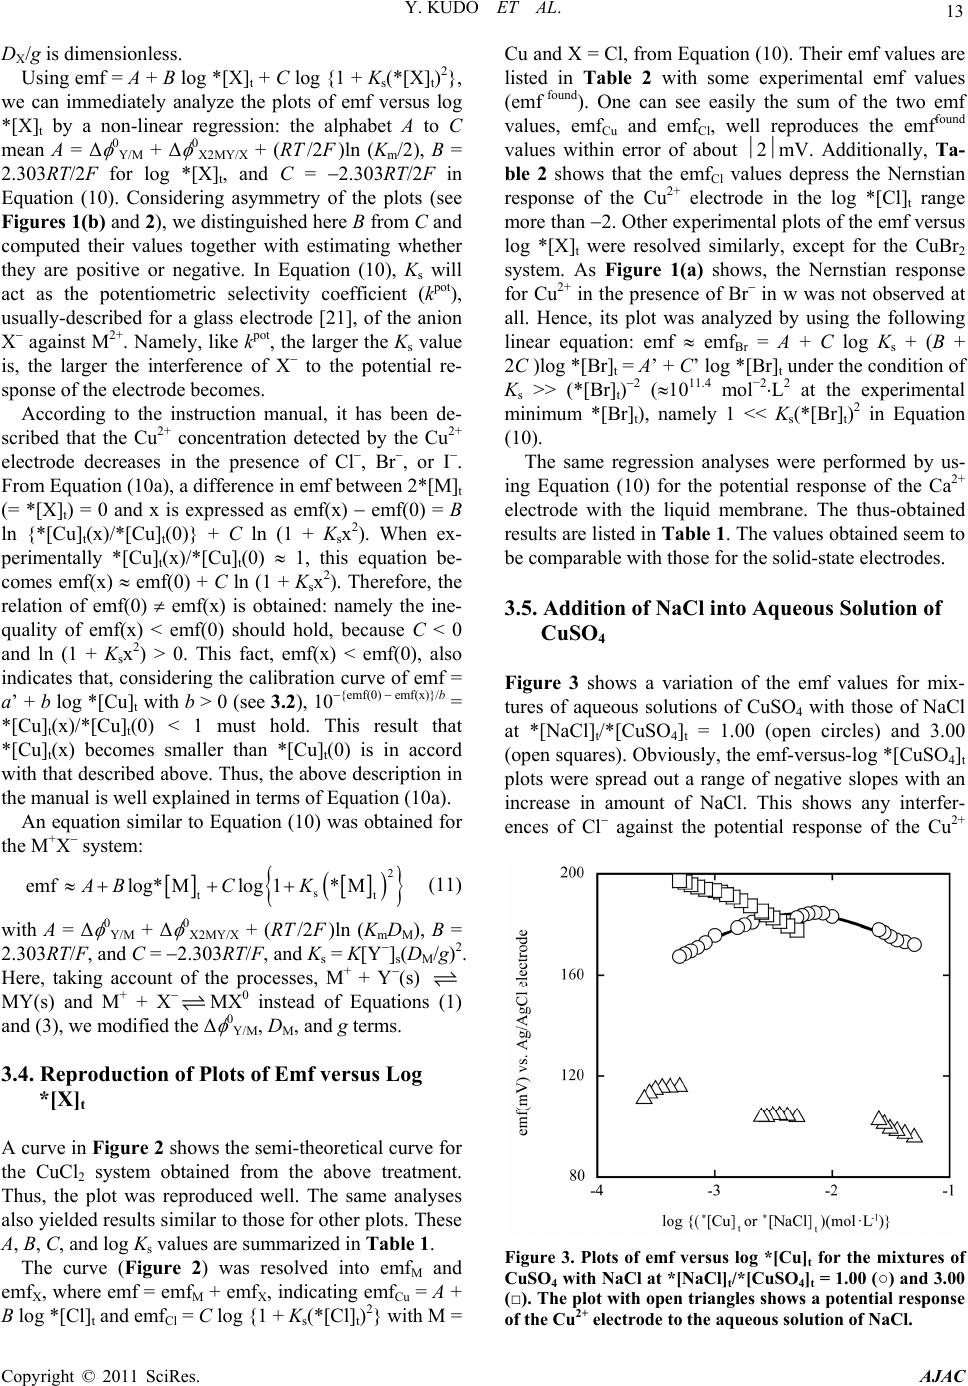 Y. KUDO ET AL. 13 DX/g is dimensionless. Using emf = A + B log *[X]t + C log {1 + Ks(*[X]t)2}, we can immediately analyze the plots of emf versus log *[X]t by a non-linear regression: the alphabet A to C mean A = Δ 0 Y/M + Δ 0 X2MY/X + (RT /2F )ln (Km/2), B = 2.303RT/2F for log *[X]t, and C = 2.303RT/2F in Equation (10). Considering asymmetry of the plots (see Figures 1(b) and 2), we distinguished here B from C and computed their values together with estimating whether they are positive or negative. In Equation (10), Ks will act as the potentiometric selectivity coefficient (kpot), usually-described for a glass electrode [21], of the anion X against M2+. Namely, like kpot, the larger the Ks value is, the larger the interference of X to the potential re- sponse of the electrode becomes. According to the instruction manual, it has been de- scribed that the Cu2+ concentration detected by the Cu2+ electrode decreases in the presence of Cl, Br, or I. From Equation (10a), a difference in emf between 2*[M]t (= *[X]t) = 0 and x is expressed as emf(x) emf(0) = B ln {*[Cu]t(x) /* [ Cu ] t(0)} + C ln (1 + Ksx2). When ex- perimentally *[Cu]t(x)/*[Cu]t(0) 1, this equation be- comes emf(x) emf(0) + C ln (1 + Ksx2). Therefore, the relation of emf(0) emf(x) is obtained: namely the ine- quality of emf(x) < emf(0) should hold, because C < 0 and ln (1 + Ksx2) > 0. This fact, emf(x) < emf(0), also indicates that, considering the calibration curve of emf = a’ + b log *[Cu]t with b > 0 (see 3.2), 10{emf(0) emf(x)}/b = *[Cu]t(x)/*[Cu]t(0) < 1 must hold. This result that *[Cu]t(x) becomes smaller than *[Cu]t(0) is in accord with that described above. Thus, the above description in the manual is well explained in terms of Equation (10a). An equation similar to Equation (10) was obtained for the M+X system: 2 s tt emflog* Mlog1* MABC K (11) with A = Δ 0 Y/M + Δ 0 X2MY/X + (RT /2F )ln (KmDM), B = 2.303RT/F, and C = 2.303RT/F, and Ks = K[Y]s(DM/g)2. Here, taking account of the processes, M+ + Y(s) MY(s) and M+ + XMX0 instead of Equations (1) and (3), we modified the Δ 0 Y/M, DM, and g terms. 3.4. Reproduction of Plots of Emf versus Log *[X]t A curve in Figure 2 shows the semi-theoretical curve for the CuCl2 system obtained from the above treatment. Thus, the plot was reproduced well. The same analyses also yielded results similar to those for other plots. These A, B, C, and log Ks values are summarized in Table 1. The curve (Figure 2) was resolved into emfM and emfX, where emf = emfM + emfX, indicating emfCu = A + B log *[Cl]t and emfCl = C log {1 + Ks(*[Cl]t)2} with M = Cu and X = Cl, from Equation (10). Their emf values are listed in Table 2 with some experimental emf values (emf found). One can see easily the sum of the two emf values, emfCu and emfCl, well reproduces the emffound values within error of about 2mV. Additionally, Ta- ble 2 shows that the emfCl values depress the Nernstian response of the Cu2+ electrode in the log *[Cl]t range more than 2. Other experimental plots of the emf versus log *[X]t were resolved similarly, except for the CuBr2 system. As Figure 1(a) shows, the Nernstian response for Cu2+ in the presence of Br in w was not observed at all. Hence, its plot was analyzed by using the following linear equation: emf emfBr = A + C log Ks + (B + 2C )log *[Br]t = A’ + C’ log *[Br]t under the condition of Ks >> (*[Br]t)2 (1011.4 mol−2L2 at the experimental minimum *[Br]t), namely 1 << Ks(*[Br]t)2 in Equation (10). The same regression analyses were performed by us- ing Equation (10) for the potential response of the Ca2+ electrode with the liquid membrane. The thus-obtained results are listed in Table 1. The values obtained seem to be comparable with those for the solid-state electrodes. 3.5. Addition of NaCl into Aqueous Solution of CuSO4 Figure 3 shows a variation of the emf values for mix- tures of aqueous solutions of CuSO4 with those of NaCl at *[NaCl]t/*[CuSO 4]t = 1.00 (open circles) and 3.00 (open squares). Obviously, the emf-versus-log *[CuSO4]t plots were spread out a range of negative slopes with an increase in amount of NaCl. This shows any interfer- ences of Cl against the potential response of the Cu2+ Figure 3. Plots of emf versus log *[Cu]t for the mixtures of CuSO4 with NaCl at *[NaCl]t/*[CuSO4]t = 1.00 (○) and 3.00 (□). The plot with open triangles shows a potential response of the Cu2+ electrode to the aqueous solution of NaCl. Copyright © 2011 SciRes. AJAC  Y. KUDO ET AL. Copyright © 2011 SciRes. AJAC 14 Table 1. Some electrochemical parameters obtained from the plots of emf versus log 2(*[MX2]t) at 25˚C. MX2 Membrane type A (mV) B (mV/decade) C (mV/decade) log Ks R CdBr2 Solid-state 143 7 26 2 13 1 4.28 0.22 0.959 CdI2 Solid-state 104 7 35 2 44 1 6.98 0.05 0.994 CuCl2 Solid-state 274 7 37 3 37 1 3.96 0.09 0.981 CuBr2 Solid-state 19 3a ---b 40 1a 11.4c 0.987 CaBr2 Liquid 69 1 26 1 16 2 1.87 0.19 0.999 CaI2 Liquid 76 17 29 5 11 2 6.00 0.38 0.976 aDetermined by using emf = A’ + C’ log *[X]t. bThe Nernstian response was not observed. cEstimated from the condition of Ks 1/(*[Br]t)2 at the experimental minimum *[Br]t. Table 2. Comparison of calculated emf valuesa with the experimental values for the CuCl2 system at 25˚C. Calculated values (mV) log *[Cl]t emfCu emfCl emfCu + emfCl emf found b(mV) 2.959 164.5 0.2 164 165.7 2.804 170.3 0.4 170 169.7 2.539 180.1 1.2 179 176.6 2.260 190.4 3.9 186 186.8 2.038 198.6 9.1 189 191.0 1.699 211.1 24.7 186 186.2 1.503 218.4 37.0 181 179.5 1.214 229.1 57.1 172 171.7 aCalculated from the data of CuCl2 in Table 1. bEmf vs. Ag/AgCl electrode. electrode. In addition to the fact, the peak seems to shift into the lower log *[CuSO4]t values in going from *[NaCl]t/*[CuSO4]t = 1 to 3. These facts also support the validity of the semi-theoretical treatment described above. Moreover, the Cu2+ electrode did not respond clearly aqueous solutions of NaCl (see the plot at the open trian- gles in Figure 3): the C’ value analyzed by emfCl was less than 8 mV/decade at R = 0.948. This fact indicates that the presence of only the Cl ion is not adequate for the potential response of the Cu2+-selective electrode to Cl, namely, the response of the electrode to Cl needs the presence of Cu2+ in the test solutions. This result is not inconsistent with the presence of the [Cl2 = Cu-Y]2 unit in the electrode process (2). Since a washing of the electrode with w resets the electrode potential into an initial condition, it can be supposed that an interaction of M2+ (or X2M) with Y2(s) is weaker than or comparable with that of M2+ with H2O. The same can be true of the Cd(II) system. Using Equation (10a), we analyzed the plot at *[NaCl]t/ *[CuSO4]t = 1 in the same manner. The A, B, C and log Ks values at R = 0.994 were 247 5 mV, 24 1 mV/decade, 21 1 mV/decade, and 4.10 0.09, re- spectively (see the curve in Figure 3). The log Ks value was the same as that for CuCl2 within the experimental errors (see Table 1). Also, a difference in A between the mixture at *[NaCl]t/*[CuSO4]t = 1 and the aqueous solu- tion of CuCl2 was + 30 mV (= ACuCl2 A1:1). That is, the difference between the log Km(CuCl2) and log Km(1:1) values was 1.31 [= log {Km(CuCl2)/Km(1:1)} (2 0.030/0.05916) + log 2], where the (Δ 0 Y/Cu + Δ 0 Cl2CuY/Cl) term was assumed to be constant between the two sys- tems. These facts suggest that the Km value is dependent on the *[Cl]t value, while the Ks value is independent of the present *[Cl]t value at least. The strong *[Cl]t-depen- dence of Km can be easily supposed by the reaction (3) with the reaction of Cl, in other words, an increase in [CuCl+] + [Cl2CuY2]s in [Cu]t and/or [Cl2CuY2]s in K2, based on the relation Km = ([Cu]t/*[Cu]t)K2. On the other hand, the *[Cl]t-dependence of Ks may be depressed by the presence of the (DCl/g)2 term in Ks: [Cl2CuY2]s/ [Cu2+](*[Cl]t)2 = Ks {see the above Ks definition at Equa-  Y. KUDO ET AL. 15 tions (10) and (10a)}. 3.6. Application of the Present Model to Other Liquid Membrane ISEs In the same manner as that (see 3.4) for the potential responses measured by the commercial Ca2+ electrode, we analyzed data [5] reported by Morf and Simon for a potential response of the neutral carrier-based Ca2+ elec- trode with o-nitrophenyl octyl ether to an aqueous solu- tion of Ca(SCN)2. The A, B, C, and log Ks values at R = 0.998 were > (85 5) mV, 18 1 mV/decade, 22 2 mV/decade, and 4.27 0.22, respectively (from Figure 1 in [5]). Also, data [7] reported by Egorov and Lushchik for the potential response of a H+ electrode based on a neutral amine-type carrier in dioctyl phthalate-PVC membrane to the hydrofluoric acid solution was analyzed by using Equation (11): A > (233 21) mV, B = 74 7 mV/decade, C = 67 5 mV/decade, and log Ks = 4.09 0.19 at R = 0.991 (from Figure 4 in [7]). The same val- ues were obtained from the analysis with Equation (17) [7] proposed by them: emf = A + B log aH+ + (C/2) log {2Kex(aH+)2 + (Kex)2(aH+)4 + 1} under the conditions of aH+ = aF and tot tot Am R CC and then this equation is eas- ily arranged into A + B log aH+ + C log {Kex(aH+)2 + 1}, being equivalent to Equation (11). Here, aj ( j = H+, F), tot Am C, and tot R C denote an activity of j in the test solu- tion, total concentrations of amine (Am) and a lipophilic univalent anion R included in a liquid membrane, re- spectively. The term Kex is an extraction constant (mol2L2) of H+F by Am into the liquid membrane and so corresponds to the Ks value in unit. At least, the re- sults for the two Ca2+ electrodes suggest essential simi- larity in model between the solid-state membrane ISE and the liquid membrane ISE [7,9]. Also, a model sug- gesting the formation of X2MY2 in a liquid membrane has been proposed [12], where Y2 means a basic iono- phore. However, its detailed description was not found [12]. Furthermore, another model with the formation of XMIY(s) in Equation (2) could reproduce the -shaped plot at R = 0.983 for the above H+ electrode. This R value was smaller than that (0.991) of the model with X2MIY2(s), showing the advantage of the X2MY2(s) formation. 3.7. X Concentration at Peak Potential The concentration (*[X]t peak) at the peak potential was estimated from the derivative of Equation (10) under the condition of * t 0 X demf d, where * t X demf d = B/*[X]t + 2CKs(*[X]t)/{1 + Ks(*[X]t)2} and then *[X]t peak = s 2 B BCK {= 2(*[M]t peak) for Equation (10a)}. The *[X]t peak values were 2.6 10−4 and 0.010 mol L−1 for the CdI2 and CuCl2 systems, respectively. These values are in good agreement with those of the peaks shown in Figures 1 and 2. The same result was also obtained for the Ca(SCN)2 system with the experimental log *[Ca]t peak of about 2.5 [5]. Similarly, the log *[HF]t peak value (= 2.0) was in good agreement with the experimental up- per limit of the proton response [7]. These results indi- cate well the reproducibility of the plots based on Equa- tions (10) and (11). 3.8. For Properties of the M2+ Electrodes Employed The Ks values were calculated to be {Ks(CdCl2) <} Ks(CdBr2) < Ks(CdI2). This fact indicates that the selec- tivity of the Cd2+ electrode (Horiba, type 8007-10C with a solid-state membrane) against X is in the order X = I < Br < Cl. The same is partly true of the Cu2+ electrode (type 8006-10C): Ks(CuCl2) << Ks(CuBr2) (Table 1). Predicting [j]s (j = Y2, X2MY2) to be unity in Equation (4), then the log Ks value can be proportional to the logarithmic solubility product, log Ksp [=log {*[M2+] (*[X])2}]. From solubility (S) data [22] at 25˚C in w, the estimated values were in the orders CdI2 {log (Ksp/mol3 L3) = log 4S 3 = 0.908} < CdBr24H2O (1.162) < CdCl2 (5/2)H2O (1.739) and CuBr2 (1.795) CuCl22H2O (1.801), where it was assumed that 100 g of aqueous solutions equals 0.100 L and then the S data in a %(w/w) unit was converted to that in a mol L−1 one. This order suggests that the smaller the log Ksp(MX2) value is, the more easy MX2 interacts with the electrode, and then the larger the interference of X against the electrode becomes. The same discussion can hold for the CaX2 system with the liquid membrane, as follows. The log Ksp(CaX2) values in w at 25˚C were estimated to be 1.549 for CaCl26H2O, 1.482 for CaBr26H2O, 1.293 for CaI26H2O, and 1.865 for Ca(NCS)24H2O from the S data [22]. The log Ksp order for X = Cl, Br and I was in good agreement with the log Ks one, although the log Ks(CaCl2) value could not be determined. A deviation of the Ca(SCN)2 system from the order suggests that an incorporation of Ca2+ in com- plex formation with the neutral carrier (L) around the test solution/liquid membrane-interface strongly contributes an increase in Ks, namely a transfer of CaL2+, XCaL+, X2CaL and so on [8] into the o phase. 4. Conclusion It was demonstrated that the present model based on the Copyright © 2011 SciRes. AJAC  16 Y. KUDO ET AL. balances among the electrochemical potentials reproduce well the potential responses of the commercial Cd2+ and Cu2+ electrodes with the solid-state membranes in the presence of only the counter halide ions. Also, one could see that the phenomena for the Ca2+ and H+ electrodes with the liquid membranes are similarly treated. These facts suggest that the present model contains essential processes being important for the potential responses of electrodes with liquid membranes at least. Further stud- ies will be required for this agreement in potential re- sponse between the electrodes with the solid-state mem- branes and those with the liquid membranes, because the latter electrodes respond under the more-complicated experimental conditions. Not taking account of so-called interfering ions in the test solutions, Equations (10) and (10a) do not reach the general equations derived before. However, Equations (10) and (10a) could directly esti- mate the parameters, Ks and A (with Km). By these equa- tions, one can relate properties of the M2+ and M+ elec- trodes with Ksp, although their applications are limited to the solid-state membrane ISEs showing the -shaped potential responses. 5. References [1] D. N. Hume, D. D. DeFord and G. C. B. Cave, “A Pola- rographic Study of the Cadmium Thiocyanate Com- plexes,” Journal of American Chemical Society, Vol. 73, 1951, pp. 5323-5325. doi:10.1021/ja01155a094 [2] C. E. Vanderzee and H. J. Dawson Jr., “The Stability Constants of Cadmium Chloride Complexes: Variation with Temperature and Ionic Strength,” Journal of American Chemical Society, Vol. 75, 1953, pp. 5659- 5663. doi:10.1021/ja01118a056 [3] P. Gerding, “Thermochemical Studies on Metal Com- plexes I. Free Energy, Enthalpy, and Entropy Changes for Stepwise Formation of Cadmium(II) Halide Complexes in Aqueous Solution at 25˚C,” Acta Chimca Scandinavica, Vol. 20, No. 1, 1966, pp. 79-94. doi:10.3891/acta.chem.scand.20-0079 [4] Y. Kudo, D. Todoroki, N. Horiuchi, S. Katsuta and Y. Takeda, “Ion-Pair Formation of Sodium Salts of Several Oxo Anions and Cadmium Halides in Water and the Dis- tribution of Monovalent Sulfate Ion Pairs in Nitroben- zene,” Journal of Chemical and Engineering Data, Vol. 55, No. 7, 2010, pp. 2463-2469. doi:10.1021/je900861h [5] W. E. Morf and W. Simon, “Cation-Response Mecha- nism of Neutral Carrier Based Ion-Selective Electrode Membranes,” Helvetica Chimica Acta, Vol. 69, 1986, pp. 1120-1131. doi:10.1002/hlca.19860690520 [6] E. Lindner, E. Gráf, Z. Niegreisz, K. Tóth, E. Pungor and R. P. Buck, “Responses of Site-Controlled, Plasticized Membrane Electrodes,” Analytical Chemistry, Vol. 60, No. 4, 1988, pp. 295-301. doi:10.1021/ac00155a004 [7] V. V. Egorov and Y. F. Lushchik, “H+-Selective Elec- trodes Based on Neutral Carriers: Specific Features in Behaviour and Quantitative Description of the Electrode Response,” Talanta, Vol. 37, No. 5, 1990, pp. 461-469. doi:10.1016/0039-9140(90)80071-M [8] Y. Kudo, Y. Kobayashi, S. Katsuta and Y. Takeda, “Ion- pair Formation of Cadmium-18-Crown-6 Ethers Complex Ions with Picrate and Chloride Ions in Water and Distri- bution of Its Picrate Ion-pair Complexes into Benzene,” Journal of Molecular Liquids, Vol. 146, 2009, pp. 60-65. doi:10.1016/j.molliq.2009.02.004 [9] T. Kakiuchi and M. Senda, “The Theory of Liquid Ion Exchange Membrane Ion-Selective Electrodes Based on the Concept of the Mixed Ion-Transfer Potential,” Bulle- tin of the Chemical Society of Japan, Vol. 57, No. 7, 1984, pp. 1801-1808. doi:10.1246/bcsj.57.1801 [10] A . Jyo, K. Fukamachi, W. Koga and N. Ishibashi, “The Influence of a Co-ion on the Potential of a Liquid -Exchanger Membrane Electrode,” Bulletin of the Chemical Society of Japan, Vol. 50, No. 3, 1977, pp. 670-672. doi:10.1246/bcsj.50.670 [11] P. Bühlmann and Y. Umezawa, “Apparently ‘Non-Nern- stian’ Equilibrium Responses Based on Complexation Between the Primary Ion and a Secondary Ion in the Liq- uid ISE Membrane,” Electroanalysis, Vol. 11, No. 10-11, 1999, pp. 687-693. doi:10.1002/(SICI)1521-4109(199907) 11:10/11<687::AID-ELAN687>3.0.CO;2-C [12] S. Amemiya, P. Bühlmann and K. Odashima, “A Gener- alized Model for Apparently ‘Non-Nernstian’ Equilib- rium Responses of Ionophore-Based Ion-Selective Elec- trodes. 1. Independent Complexation of the Ionophore with Primary and Secondary Ions,” Analytical Chemistry, Vol. 75, No. 14, 2003, pp. 3329-3339. doi:10.1021/ac026471g [13] G. D. Christian, “Analytical Chemistry,” 5th Edition, John Wiley & Sons, New York, 1994, p. 335. [14] Y. Kudo, R. Fujihara, T. Ohtake, S. Katsuta and Y. Ta- keda, “Evaluation of the Hydrophilic Property of Sodium Ion-Pair Complexes with 3m-Crown-m Ethers (m = 5, 6) and Their Benzo-Derivatives by Solvent Extraction,” Analytical Sciences, Vol. 24, 2008, pp. 999-1003. doi:10.2116/analsci.24.999 [15] Y. Kudo, S. Takeuchi, Y. Kobayashi, S. Katsuta and Y. Takeda, “Potentiometric Determination of Ion-Pair For- mation Constants for Cadmium, Calcium Salts, and Cad- mium-18-Crown-6 Ether Derivative Complexes with a Sulfate Ion in Water,” Journal of Chemical and Engi- neering Data, Vol. 52, No. 5, 2007, pp. 1747-1752. doi:10.1021/je700135j [16] S. Wasylkiewicz, “Ion Association in Aqueous Solutions of Electrolytes. II. Mathematical Model for Sulphates of Bivalent Metals,” Fluid Phase Equilibria, Vol. 57, 1990, pp. 277-296. doi:10.1016/0378-3812(90)85127-V [17] T. Kakiuchi, “Limiting Behanior in Equilibrium Parti- tioning of Ionic Components in Liquid-Liquid Two-Phase Systems,” Analytical Chemistry, Vol. 68, No. 20, 1996, pp. 3658-3664. doi:10.1021/ac960032y Copyright © 2011 SciRes. AJAC  Y. KUDO ET AL. Copyright © 2011 SciRes. AJAC 17 [18] Internet Available: http://www.horiba.com/us/en/applica- tion/material-property -characterization/water-analysis/wa- ter-quality-electrochemistry-instrumentation/electrodes/ion- electrodes/details/copper-ion-electrode-8006-10c-9511/ [19] Internet Available: http://www.horiba.com/us/en/applica- tion/material-property -characterization/water-analysis/wa- ter-quality-electrochemistry-instrumentation/electrodes/ion- electrodes/details/cadmium-ion-electrode-8007-10c-9515/ [20] Internet Available: http://www.horiba.com/us/en/applica- tion/material-property-characterization/water-analysis/wa- ter-quality-electrochemistry-instrumentation/electrodes/ion- electrodes/details/calcium-ion-electrode-8203-10c-9587/ [21] A. J. Bird and L. R. Faulkner, “Electrochemical Methods: Fundamentals and Applications,” 2nd Edition, John Wiley & Sons, New York, 2001, pp. 60-62; 74-81. [22] K. A. Inaba, S. Takagi, K. Tajima, H. Tohara, K. Naka- tsuka, K. Nakanishi, H. Nakayama, T. Makita and M. Muramatsu, “Handbook of Chemistry, Fundamentals II”, In: H. Chihara, Ed., 3rd Edition, The Chemical Society of Japan, Maruzen, Tokyo, 1984, pp. II-166; II-177.
|