Paper Menu >>
Journal Menu >>
 Applied Mathematics, 2011, 2, 241-246 doi:10.4236/am.2011.22027 Published Online February 2011 (http://www.SciRP.org/journal/am) Copyright © 2011 SciRes. AM Mathematical Modeling of Diffusion Phenomenon in a Moderately Constricted Geometry Shailesh Mishra, Narendra Kumar Verma, Shafi Ullah Siddiqui Department of Mathematics, Harcourt Butler Technological Institute, Kanpur, India E-mail: shailesh27sep@rediffmail.com Received October 30, 2010; revised December 19, 2010; accepted December 24, 2010 Abstract The incorporation of fluid flow through modelled normal and stenosed capillary-tissue exchange system has highlighted issues that may have major applications for the study of diffusion phenomenon. Results clearly demonstrate the important roles played by various physiological characteristics and diffusion variables in- volved in the analysis on blood flow. Assessment of the severity of the disease could be made possible through the variation of a parameter named as retention parameter. An attempt has been made to study the effects of local variation of viscosity on flow, wall-shearing stress and distribution of dissolved material in diseased artery as compared to the normal. Keywords: Stenosis, Diffusion, Wall Shear Stress, Viscosity, Retention Parameter 1. Introduction Atherosclerosis is a chronic disease which involves the build up of cholestero l and othe r fatty deposits within the arterial wall leading to the narrowing of the blood vessel lumen (Figure 1). This has the consequence of restrict- ing blood flow to vital organs which can eventually lead to various clinical syndromes such as heart attacks and strokes. These events are the leading causes of death in the developed world [1,2]. The early events leading to atherosclerosis occur in the space between the endothelial cells and the smooth mus- cle cells, a region of the blood vessel known as the sub- endothelium or intima. The process leading to the cho- lesterol deposits begins with the formation of fatty str- eaks. Accumulation of cholesterol within cells leads to the formation of ‘foam cells’ which reside in this intimal region of the vessel wall and constitute the fatty streak. At this stage no symptoms will be observed and in fact symptoms of atherosclerosis often do not reveal them- selves until complications such as angina and coronary artery disease arise. The fatty streaks are often present in childhood and may not always progress to form the pla- ques which can be found in affected adults [3]. The dis- ease may remain asymptomatic for many years. However, critical restriction of blood flow or thrombosis leading to total occlusion of the vessel may lead to cardiovascular events such as heart attack or stroke later in life. While modeling blood flow in a stenosed tube, it was initially assumed that, the flow obeys Newtonian hypo- thesis and the flow variables have been computed by using basic Navier-Stoke’s equation [4,5]. Later, the model has been extended by assuming that, it obeys non- Newtonian hypothesis and showed that under low shear rates, the model could be best described by this represen- tation. The papers [6-10] provide a small sample of the re- search on non-Newtonian effects on blood flo w. Perkkio and Keskinen [11] studied the effects of the concentra- tion on viscosity and the effects of the concentration on blood flow through a vessel with stenosis and found it an important aspect from physiological point of view. Kang and Eringen [12] have also discussed the effects of the variation of the concentration of the suspended cells of the blood. Viscosity depending on the local variation of the concentration of the suspended cells has been intro- duced by Tandon et al. [13,14]. In the present analysis an attempt has been made to study the effects of local varia- tion of viscosity on flow, wall shearing stress and diffu- sion of dissolved material (nutrients) in diseased artery as compared to the normal. This work may help in early identification, diagnosis and treatment of cardiovascular disorders. Increasing values of M represent growth of new cells which interns increases the viscosity. The re- sistance to flow ( ) increases with the growth of steno- sis and with the increasing values of the parameter  S. MISHRA ET AL. Copyright © 2011 SciRes. AM 242 (a) (b) Figure 1. (a) Cross section of a normal artery lumen. The endothelial cells neighbour the lumen and no intimal thick- ening is present; (b) Sever atherosclerosis. On the right a calcified plaque has formed pushing against the endothelial cells them to bulge into the lumen restricting blood flow. and M . Variation of wall shearing stress ( s ) with the developing stenosis for different values of parameter are similar as for resistance to flow. It is seen that in- creasing values of N describe the increase in retention of the solutes within the cap illary. Consider the flow of blood through a circular tube of radius R(z) whose viscosity varies along the radial direc- tion. In the capillary segment the geometry of the steno- sis is given by 1 0 0 1 1 m m o A Lzd zddzdL Rz Rotherwise (1) Here the parameter A is expressed as 1 0 01 mm m Lm ARm (2) where denotes the maximum height of the stenosis at 0 /1mm L zdm such that 0 1 R .()Rz and 0 R is the radius of capillary with and without stenosis respec- tively (see Figure 2). 2. Formulation of the Problem The flow is considered to be steady, fully develop ed and laminar viscous flow of suspensions of cells. For dilute suspensions, a reasonable approximation to the viscosity of the suspension may be described as 01C (3) where and 0 denote the viscosity of blood and plasma respectively. The concentration C is determined by the governing diffusion equation 2 2 10 CC DM rr r (4) where D is the diffusion coefficient and M is the rate of production or degeneration. The concentration equation for the solute is expressed as 2 11 11 12 1 CC CC uD tz rr r (5) where 1 C represents the concentration of the solute, u is the axial velocity and 1 D the diffusion coefficient for the solute under cons ideration in the blood. The equations governing the flow of blood in the ar- terial system are given by 0pu r zrrr (6) 0p r (7) To solve the above system of equations, the following boundary and matching conditions are introduced: Figure 2. Flow geometry of stenosed capillary.  S. MISHRA ET AL. Copyright © 2011 SciRes. AM 243 1 1 11 0 0, at0 ., at 0, at0 0, at 0, at0 .. , at ,at 0 ,at L Cr r C DVCrR r ur r urR Cr r C DVNCrR r pp z pp zL (8) 3. Solution of the Problem The expression for concentration C is obtained by solv- ing Equation (4) using the boundary conditions given in Equation (8) as 222 4 M CVRrDR DV (9) The expression for the viscosity is given by 2 01 2 A rA (10) where 14 M AD and 2 212 4 M A VR DR DV . On solving Equation (6) with the help of boundary conditions mentioned in Equation (8) we obtained the velocity distribution 22 44 1 20 2 1 42 Ap uRrRr A Az (11) The volumetric rate of flow is defined as 2 0 Rdu Qr dr dr (12) By performing the integration of Equation (12), using Equation (11), one obtains 6 41 20 2 243 AR Rp Q A Az (13) The pressure gradi ent is thus obtained as 2 () dp Q dzI z (14) where 3 0 Rrdr Iz r . Integrating Equation (14) and using the boundary con- dition give n in Equat i on (8) , we have 00 2L L Qdz pp I z (15) The resistance to flow is defined by 0 L pp Q (16) which on solving gives 0 0 0 2dL d LL dz I Iz (17) where 03 00 Rr I dr r . The wall shearing stress is given by () R rRz du rdr (18) which on using Equation (11) and Equation (15) gives s , given by () () s RzQ I z (19) Following Tandon and Pal [13] the apparent viscosity is expressed as 1 6 412 02 2 4 3 app AR R AA (20) To solve the concentration equation for the solute given by Equation (5), following non-dimensional quan- tities are introduced: 1 1 1000 ,,, ,, zut C tLr R ttC R tuLRC R (21) so that Equation (5) becomes 2 1 111 1 22 10 CDC C Ct tLR (22) together with the boundary conditions: 11 11 0 0, at0;..,at CCR DVNC R (23) where uu , N is the retention parameter and 42 0 20 4 RR p uAL (24) and V is the radial velocity of the wall, given by dR Vdt  S. MISHRA ET AL. Copyright © 2011 SciRes. AM 244 If the Taylor’s longitudinal condition is valid in this problem, the partial equilibrium may be assumed at any cross-section of the artery and the variation in 1 C with r is obtained from Equation (22), which may be written in the form 2 211 1 0 21 1R CC C DL (25) To solve Equation (25), we use boundary condition given in Equation (23) and obtain 446 22 1 0 13 2 2 1 20 16 8 144 2 RpRC CA R ADL (26) where 33 1 00 1 321 20 10 1 2144 RRVNRR C p AAL D . 4. Results and Discussions In this paper the concentration profiles and associated physiological diffusion variables involved in the analysis for normal and diseased system associated with stenosis due to the local deposition of lipids have been deter- mined. Such mo dels may help in id entification , diag nosis and treatment of many cardiovascular di s o rd ers. The results are shown in the Figures 3 to 9 by taking the value of parameters based on experimental data in a capillary. 0(cm) 1;(cm) 1,2,5LL;00.2,0.3,0.4, 0.8R ; 0.5,1.0,1.5, 2.0α; 1,2, 3M; m = 2 (for symmetric stenosis). Figure 3 shows the variation of apparent viscosity (0 ) with the stenosis size (0 R ) for different val- ues of . It is seen that increase in , increases the apparent viscosity as the stenosis develops. Figure 3. Variation of apparent viscosity with stenosis for different value of α. The effects of variations of M representing the gen- eration or degradation of the cells on apparent viscosity (0 ) has been depicted in Figure 4. Increasing values of M represent growth of new cel ls , i.e. generation. This in turn increases the viscosity. The effect of increasing values of stenosis size (0 R ) is also obvious because narrowing the arteries would increase concentration of the suspended cells ow ing to the flow of plasma through the stenotic region due to the growing stenosis. This ef- fect is similar to that of collapsing walls symmetrically. Figure 5 and Figure 6 describe the variation of the re- sistance to flow ( ) with stenosis size (0 R ) for dif- ferent values of parameters and M . The resistance to flow ( ) increases with the growth of stenosis and with the increasing values of the parameter and M . Variation of resistance to flow with developing stenosis is similar to that obtained by Shukla et al. [15] and Mi- shra et al. [16]. Variation of wall shearing stress ( s ) with the devel- oping stenosis for different values of parameter is presented in Figure 7. As the stenosis grows, the wall Figure 4. Variation of apparent viscosity with stenosis size for different values of M. Figure 5. Variation of resistance to flow with stenosi size for different values of α. 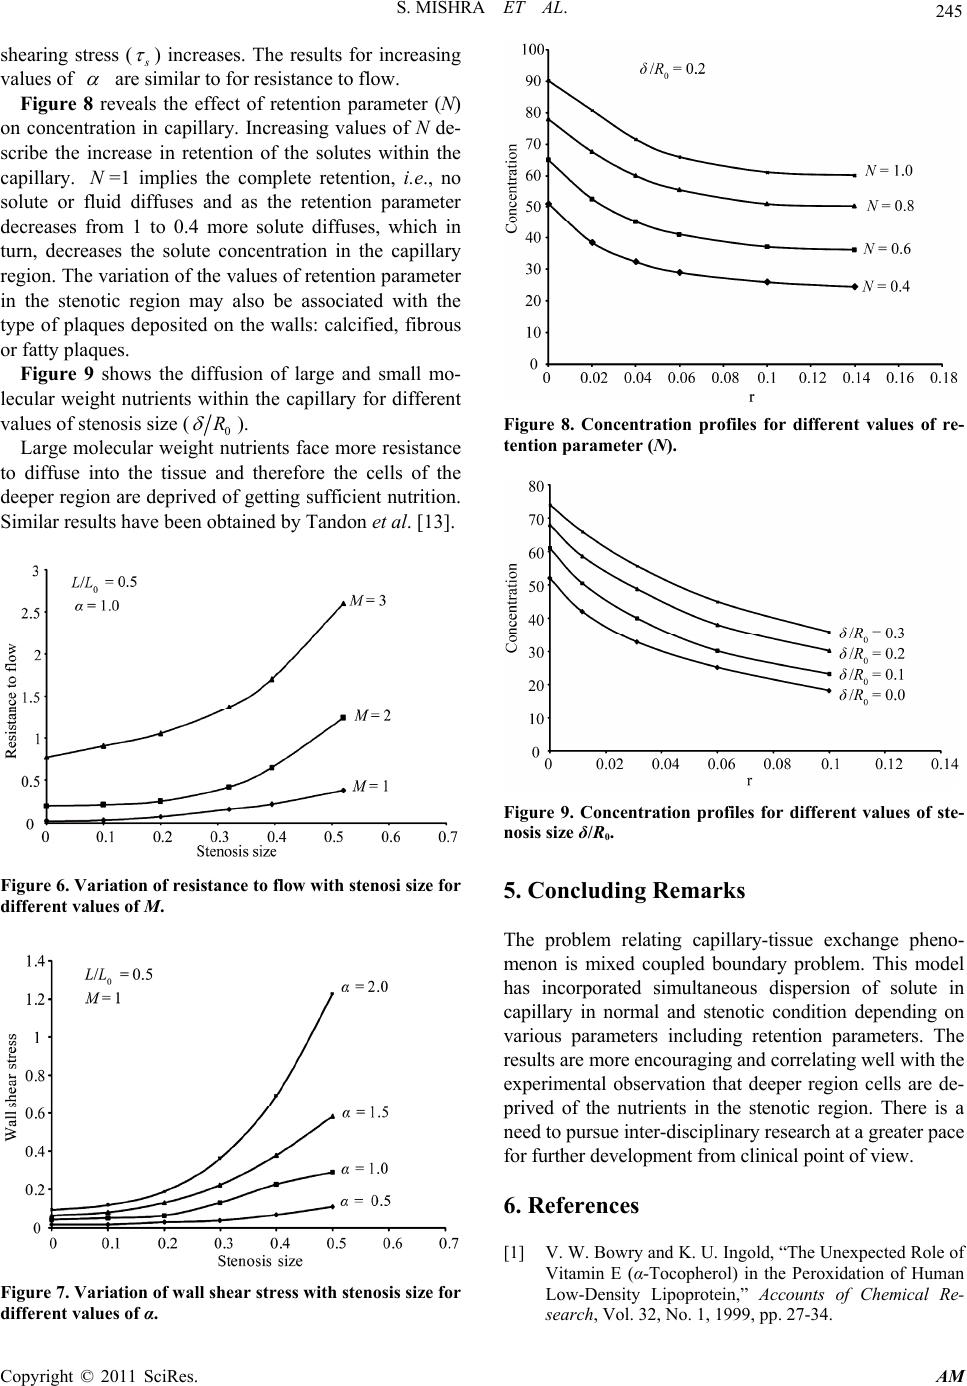 S. MISHRA ET AL. Copyright © 2011 SciRes. AM 245 shearing stress ( s ) increases. The results for increasing values of are similar to for resistance to flow. Figure 8 reveals the effect of retention parameter (N) on concentration in capillary. Increasing values of N de- scribe the increase in retention of the solutes within the capillary. N=1 implies the complete retention, i.e., no solute or fluid diffuses and as the retention parameter decreases from 1 to 0.4 more solute diffuses, which in turn, decreases the solute concentration in the capillary region. The variation of the values of retention parameter in the stenotic region may also be associated with the type of plaques deposited on the walls: calcified, fibrous or fatty plaques. Figure 9 shows the diffusion of large and small mo- lecular weight nutrients within the capillary for different values of stenosis size (0 R ). Large molecular weight nutrients face more resistance to diffuse into the tissue and therefore the cells of the deeper region are deprived of getting sufficient nutritio n. Similar results have been obtained by Tandon et al. [13]. Figure 6. Variation of resistance to flow with stenosi size for different values of M. Figure 7. Variation of wall shear stress with stenosis size for different values of α. Figure 8. Concentration profiles for different values of re- tention parameter (N). Figure 9. Concentration profiles for different values of ste- nosis size δ/R0. 5. Concluding Remarks The problem relating capillary-tissue exchange pheno- menon is mixed coupled boundary problem. This model has incorporated simultaneous dispersion of solute in capillary in normal and stenotic condition depending on various parameters including retention parameters. The results are more encouraging and correlating well with the experimental observation that deeper region cells are de- prived of the nutrients in the stenotic region. There is a need to pursue inter-disciplinary research at a greater pace for further de v el opment from cli ni c al poi nt o f vi ew. 6. References [1] V. W. Bowry and K. U. Ingold, “The Unexpected Role of Vitamin E (α-Tocopherol) in the Peroxidation of Human Low-Density Lipoprotein,” Accounts of Chemical Re- search, Vol. 32, No. 1, 1999, pp. 27-34. 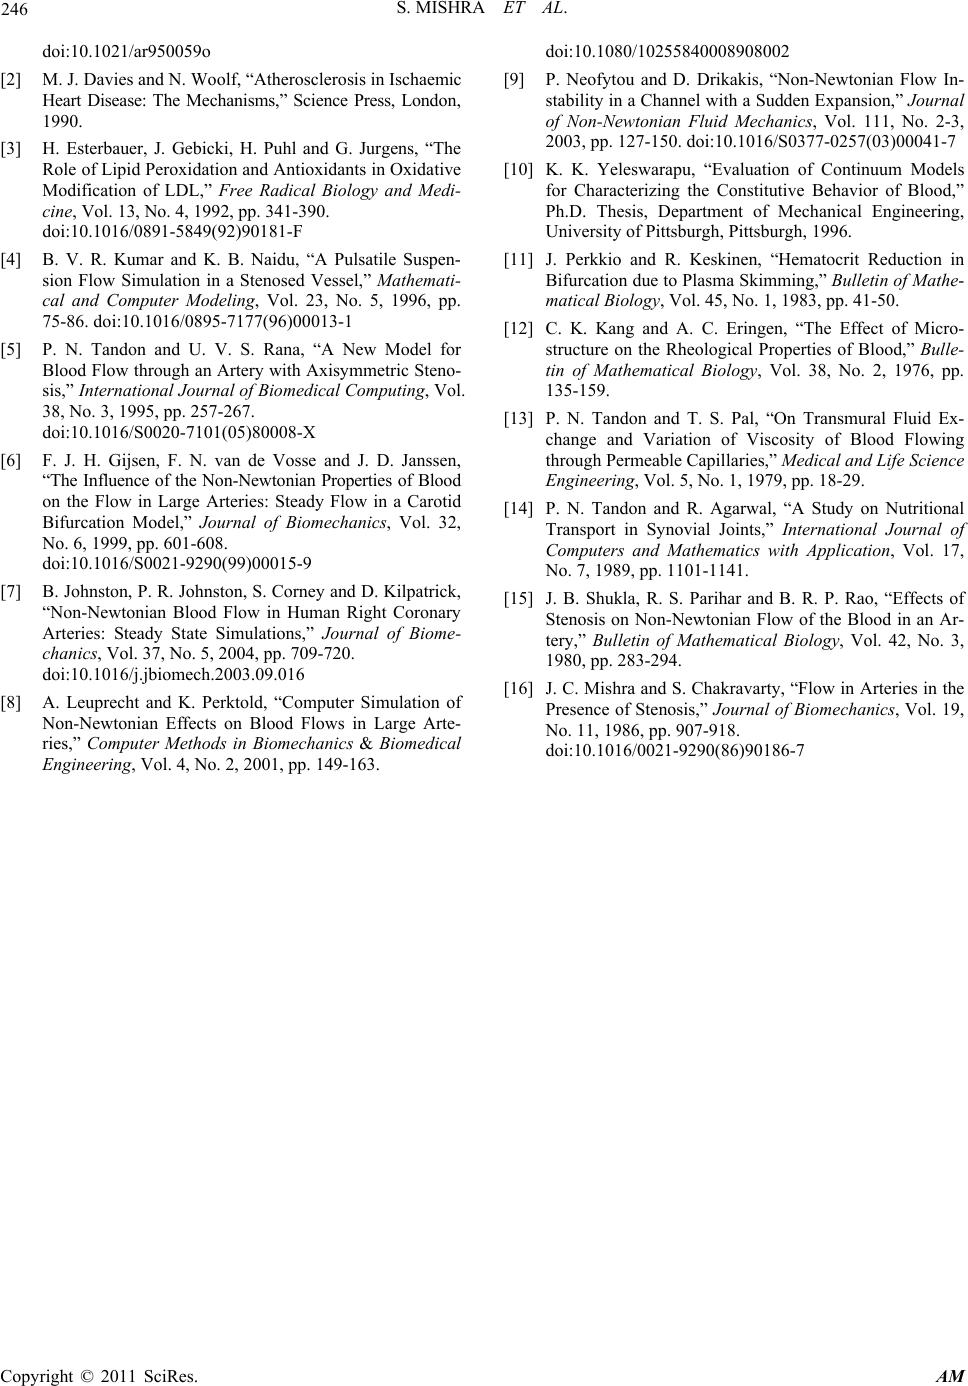 S. MISHRA ET AL. Copyright © 2011 SciRes. AM 246 doi:10.1021/ar950059o [2] M. J. Davies and N. Woolf, “Atherosclerosis in Ischaemic Heart Disease: The Mechanisms,” Science Press, London, 1990. [3] H. Esterbauer, J. Gebicki, H. Puhl and G. Jurgens, “The Role of Lipid Peroxidation and Antioxidants in Oxidative Modification of LDL,” Free Radical Biology and Medi- cine, Vol. 13, No. 4, 1992, pp. 341-390. doi:10.1016/0891-5849(92)90181-F [4] B. V. R. Kumar and K. B. Naidu, “A Pulsatile Suspen- sion Flow Simulation in a Stenosed Vessel,” Mathemati- cal and Computer Modeling, Vol. 23, No. 5, 1996, pp. 75-86. doi:10.1016/0895-7177(96)00013-1 [5] P. N. Tandon and U. V. S. Rana, “A New Model for Blood Flow through an Artery with Axisymmetric Steno- sis,” International Journal of Biomedical Computing, Vol. 38, No. 3, 1995, pp. 257-267. doi:10.1016/S0020-7101(05)80008-X [6] F. J. H. Gijsen, F. N. van de Vosse and J. D. Janssen, “The Influence of the Non-Newtonian Properties of Blood on the Flow in Large Arteries: Steady Flow in a Carotid Bifurcation Model,” Journal of Biomechanics, Vol. 32, No. 6, 1999, pp. 601-608. doi:10.1016/S0021-9290(99)00015-9 [7] B. Johnston, P. R. Johnston, S. Corney and D. Kilpatrick, “Non-Newtonian Blood Flow in Human Right Coronary Arteries: Steady State Simulations,” Journal of Biome- chanics, Vol. 37, No. 5, 2004, pp. 709-720. doi:10.1016/j.jbiomech.2003.09.016 [8] A. Leuprecht and K. Perktold, “Computer Simulation of Non-Newtonian Effects on Blood Flows in Large Arte- ries,” Computer Methods in Biomechanics & Biomedical Engineering, Vol. 4, No. 2, 2001, pp. 149-163. doi:10.1080/10255840008908002 [9] P. Neofytou and D. Drikakis, “Non-Newtonian Flow In- stability in a Channel with a Sudden Expansion,” Journal of Non-Newtonian Fluid Mechanics, Vol. 111, No. 2-3, 2003, pp. 127-150. doi:10.1016/S0377-0257(03)00041-7 [10] K. K. Yeleswarapu, “Evaluation of Continuum Models for Characterizing the Constitutive Behavior of Blood,” Ph.D. Thesis, Department of Mechanical Engineering, University of Pittsburgh, Pittsburgh, 1996. [11] J. Perkkio and R. Keskinen, “Hematocrit Reduction in Bifurcation due to Plasma Skimming,” Bulletin of Mathe- matical Biology, Vol. 45, No. 1, 1983, pp. 41-50. [12] C. K. Kang and A. C. Eringen, “The Effect of Micro- structure on the Rheological Properties of Blood,” Bulle- tin of Mathematical Biology, Vol. 38, No. 2, 1976, pp. 135-159. [13] P. N. Tandon and T. S. Pal, “On Transmural Fluid Ex- change and Variation of Viscosity of Blood Flowing through Permeable Capillaries,” Medical and Life Science Engineering, Vol. 5, No. 1, 1979, pp. 18-29. [14] P. N. Tandon and R. Agarwal, “A Study on Nutritional Transport in Synovial Joints,” International Journal of Computers and Mathematics with Application, Vol. 17, No. 7, 1989, pp. 1101-1141. [15] J. B. Shukla, R. S. Parihar and B. R. P. Rao, “Effects of Stenosis on Non-Newtonian Flow of the Blood in an Ar- tery,” Bulletin of Mathematical Biology, Vol. 42, No. 3, 1980, pp. 283-294. [16] J. C. Mishra and S. Chakravarty, “Flow in Arteries in the Presence of Stenosis,” Journal of Biomechanics, Vol. 19, No. 11, 1986, pp. 907-918. doi:10.1016/0021-9290(86)90186-7 |