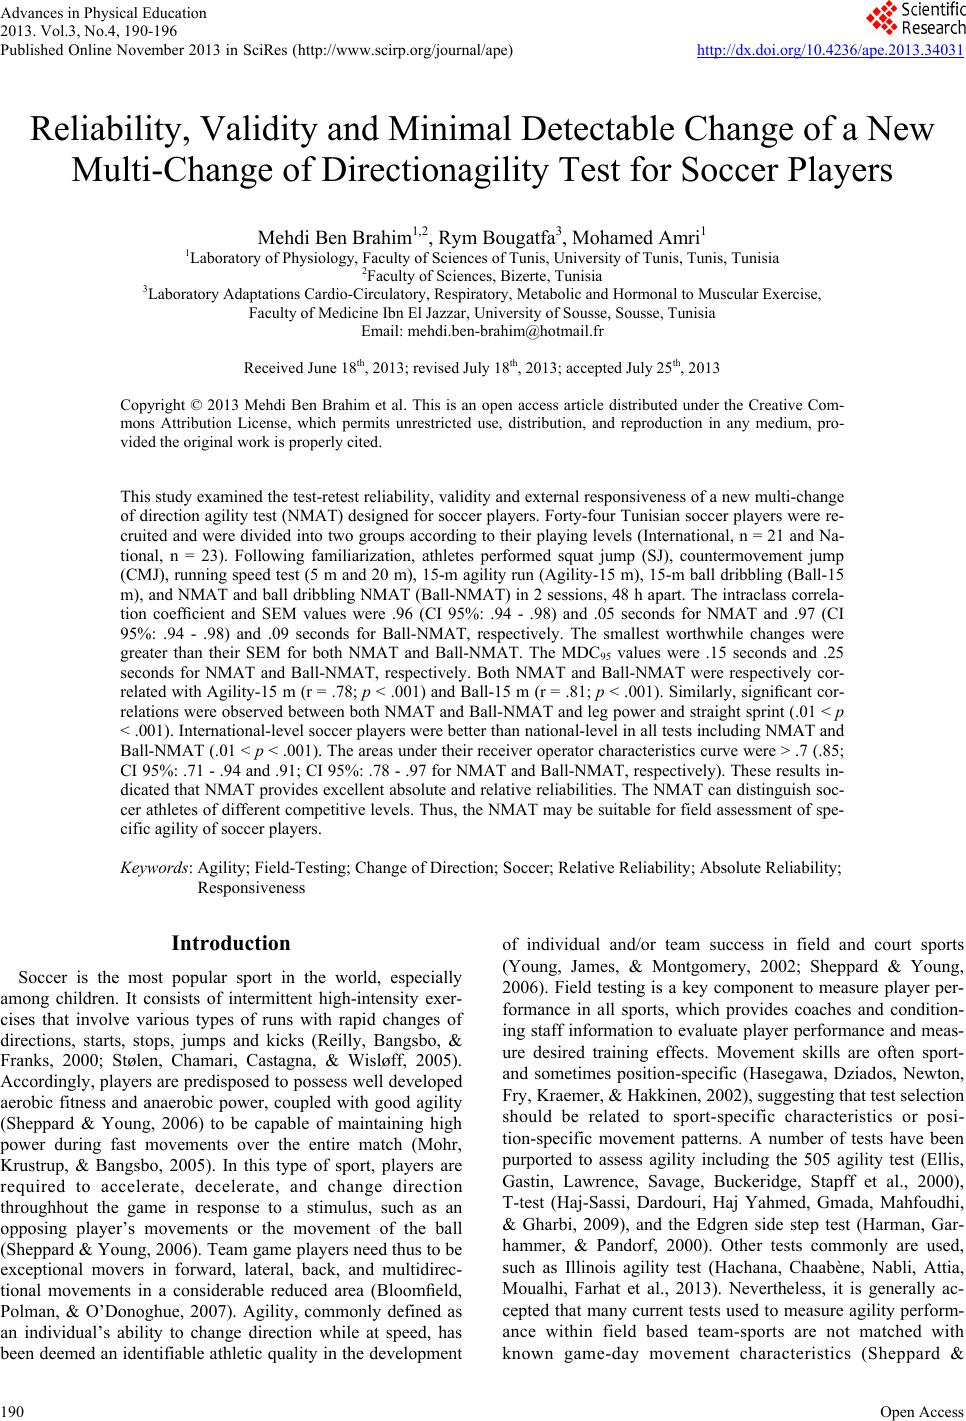
 Advances in Physical Education 2013. Vol.3, No.4, 190-196 Published Online November 2013 in SciRes (http://www.scirp.org/journal/ape) http://dx.doi.org/10.4236/ape.2013.34031 Open Access 190 Reliability, Validity and Minimal Detectable Change of a New Multi-Change of Directionagility Test for Soccer Players Mehdi Ben Brahim1,2, Rym Bougatfa3, Mohamed Amri1 1Laboratory of Physiology, Faculty of Sciences of Tunis, University of Tunis, Tunis, Tunisia 2Faculty of Sciences, Bizerte, Tunisia 3Laboratory Adaptations Cardio-Circulatory, Respiratory, Metabolic and Hormonal to Muscular Exercise, Faculty of Medicine Ibn El Jazzar, University of Sousse, Sousse, Tunisia Email: mehdi.ben-brahim@hotmail.fr Received June 18th, 2013; revised July 18th, 2013; accepted July 25th, 2013 Copyright © 2013 Mehdi Ben Brahim et al. This is an open access article distributed under the Creative Com- mons Attribution License, which permits unrestricted use, distribution, and reproduction in any medium, pro- vided the original work is properly cited. This study examined the test-retest reliability, validity and external responsiveness of a new multi-change of direction agility test (NMAT) designed for soccer players. Forty-four Tunisian soccer players were re- cruited and were divided into two groups according to their playing levels (International, n = 21 and Na- tional, n = 23). Following familiarization, athletes performed squat jump (SJ), countermovement jump (CMJ), running speed test (5 m and 20 m), 15-m agility run (Agility-15 m), 15-m ball dribbling (Ball-15 m), and NMAT and ball dribbling NMAT (Ball-NMAT) in 2 sessions, 48 h apart. The intraclass correla- tion coefficient and SEM values were .96 (CI 95%: .94 - .98) and .05 seconds for NMAT and .97 (CI 95%: .94 - .98) and .09 seconds for Ball-NMAT, respectively. The smallest worthwhile changes were greater than their SEM for both NMAT and Ball-NMAT. The MDC95 values were .15 seconds and .25 seconds for NMAT and Ball-NMAT, respectively. Both NMAT and Ball-NMAT were respectively cor- related with Agility-15 m (r = .78; p < .001) and Ball-15 m (r = .81; p < .001). Similarly, significant cor- relations were observed between both NMAT and Ball-NMAT and leg power and straight sprint (.01 < p < .001). International-level soccer players were better than national-level in all tests including NMAT and Ball-NMAT (.01 < p < .001). The areas under their receiver operator characteristics curve were > .7 (.85; CI 95%: .71 - .94 and .91; CI 95%: .78 - .97 for NMAT and Ball-NMAT, respectively). These results in- dicated that NMAT provides excellent absolute and relative reliabilities. The NMAT can distinguish soc- cer athletes of different competitive levels. Thus, the NMAT may be suitable for field assessment of spe- cific agility of soccer players. Keywords: Agility; Field-Testing; Change of Direction; Soccer; Relative Reliability; Absolute Reliability; Responsiveness Introduction Soccer is the most popular sport in the world, especially among children. It consists of intermittent high-intensity exer- cises that involve various types of runs with rapid changes of directions, starts, stops, jumps and kicks (Reilly, Bangsbo, & Franks, 2000; Stølen, Chamari, Castagna, & Wisløff, 2005). Accordingly, players are predisposed to possess well developed aerobic fitness and anaerobic power, coupled with good agility (Sheppard & Young, 2006) to be capable of maintaining high power during fast movements over the entire match (Mohr, Krustrup, & Bangsbo, 2005). In this type of sport, players are required to accelerate, decelerate, and change direction throughhout the game in response to a stimulus, such as an opposing player’s movements or the movement of the ball (Sheppard & Young, 2006). Team game players need thus to be exceptional movers in forward, lateral, back, and multidirec- tional movements in a considerable reduced area (Bloomfield, Polman, & O’Donoghue, 2007). Agility, commonly defined as an individual’s ability to change direction while at speed, has been deemed an identifiable athletic quality in the development of individual and/or team success in field and court sports (Young, James, & Montgomery, 2002; Sheppard & Young, 2006). Field testing is a key component to measure player per- formance in all sports, which provides coaches and condition- ing staff information to evaluate player performance and meas- ure desired training effects. Movement skills are often sport- and sometimes position-specific (Hasegawa, Dziados, Newton, Fry, Kraemer, & Hakkinen, 2002), suggesting that test selection should be related to sport-specific characteristics or posi- tion-specific movement patterns. A number of tests have been purported to assess agility including the 505 agility test (Ellis, Gastin, Lawrence, Savage, Buckeridge, Stapff et al., 2000), T-test (Haj-Sassi, Dardouri, Haj Yahmed, Gmada, Mahfoudhi, & Gharbi, 2009), and the Edgren side step test (Harman, Gar- hammer, & Pandorf, 2000). Other tests commonly are used, such as Illinois agility test (Hachana, Chaabène, Nabli, Attia, Moualhi, Farhat et al., 2013). Nevertheless, it is generally ac- cepted that many current tests used to measure agility perform- ance within field based team-sports are not matched with known game-day movement characteristics (Sheppard &  M. B. BRAHIM ET AL. Young, 2006). In this context, Mujika et al. (2009) proposed a specific agility test for soccer players which take into account the specific movement patterns. While the value of these tests is acknowledged, there are some limitations. In fact, these tests do not take into account the sideways and backward running and changes of direction met in soccer game. These appropriate soccer movement characteristics should be understood when selecting drills or exercises in athlete’s training process. Central to the importance of features’ knowledge of the various actions met during soccer games, we develop a new multi-change of direction agility test (NMAT). It is generally admitted that any test should respond to several standard criteria, including reli- ability, validity and external responsiveness (Hopkins, 2000; Beekhuizen, Davis, Kolber, & Cheng, 2009) for its scientific acceptance. Therefore, the aim of this study was to evaluate the reliability, validity and external responsiveness of the NMAT designed for soccer players. In addition, we examined the rela- tionship between the performance of this test and those of the 15-m agility run and vertical jump and speed tests. We hy- pothesized that the NMAT would provide stable test-retest scores, and low minimal detectable change. It would have a stronger relationship with the speed and 15-m agility run per- formances and all jump ability tests. Methods Participants A total of forty-four male soccer players (21 Internationals and 23 Nationals) of two different performance levels took part in this study (mean ± [SD] age: 17.4 ± .6 year; Height: 181.1 ± 4.7 cm; Body mass: 76.5 ± 7.8 kg; Body fat: 13.5% ± 2.1%). They practise soccer 11 months a year, for at least 7 years (7.7 ± 1.4) at a rate of 5 sessions with one competitive game per week, in addition to their school physical education. In general, soccer training sessions lasted ~1 h 30 min, including about 15 - 20 min of warming up, low-intensity games and stretching exercises, 15 - 25 min of technical soccer exercises (kicking actions, dribbling, jumping, and running with fast accelerations and decelerations), 20 - 30 min of match practice, and 10 min of active recovery. None of the participants reported any cur- rent or on-going neuromuscular diseases or musculoskeletal injuries specific to the ankle, knee, or hip joints, and none of them were taking any dietary or performance supplements that might be expected to affect performance during the study. Written informed consent was received from all subjects after verbal and written explanation of the experimental design and potential risks of the study. The study was conducted according to the Declaration of Helsinki and the protocol was fully ap- proved by the local Ethic Committee of the University before the commencement of the assessments. All the participants were fully accustomed with the procedures used in this research and were informed they could withdraw from the study at any time without penalty. Procedure The first phase of this study aimed to establish the relative and absolute reliability of the NMAT Agility test in a group of 44 soccer players. Each subject completed the NMAT twice separated by at least 48 hours. All subjects were familiarized with the NMAT protocol before data collection. To avoid the effect of diurnal variations, the NMAT was completed at the same time of the day after a 15-minute warm- up including jogging, sprinting, lateral displacements, dynamic stretching, and jumping. The second phase of our investigation aimed to examine the relationship between the NMAT and other physical fitness components that were anaerobic perfor- mance and explosiveness. All subjects performed the speed, agility, jump tests. For the jump tests, subjects were allowed to perform 3 trials. All subjects performed each test with at least 3 minutes of rest between all trials and 5 minutes between tests to ensure adequate recovery. Vertical jump performances (peak height) were measured by using the Opto-jump system (Micro- gate SARL, Italy). Anthropometry Each subject was weighed and its stature determined. To es- timate the adiposity, skinfold thickness were measured at four sites on the left-side of the body (triceps, biceps, subscapular and suprailiac) using a Harpenden skinfold calliper (British Indicators Ltd., Luton). All measurements were taken by the same investigator. New Multi-Change of Direction Agility Test (NMAT) In this test, players’ velocity in a 25 m agility run was meas- ured using the same photocell gates system. The player begins to make a lateral displacement of 2.5 m linear and then turns back in traversing the same distance (2.5 m) and arriving at the starting point where he conducts a running back 2.5 m followed by a 3-m race before. At this stage, the athlete will begin a race with change of direction of 1 m chained by a linear stroke of 1.35 m and then crosses a barrier (fence) with a height of .5 meters. The test will end a run of 5 m linear (Figure 1). Squat Jump The subject started from a semi-squat position with the hands Figure 1. Schematic representation of the NMAT. 1) 2.5 m; 2) 2.5 m; 3) 2.5 m; 4) 3 m; 5) 2 m; 6) 4 m; 7) 2 m; 8) 1.5 m; 9) 5 m. Open Access 191 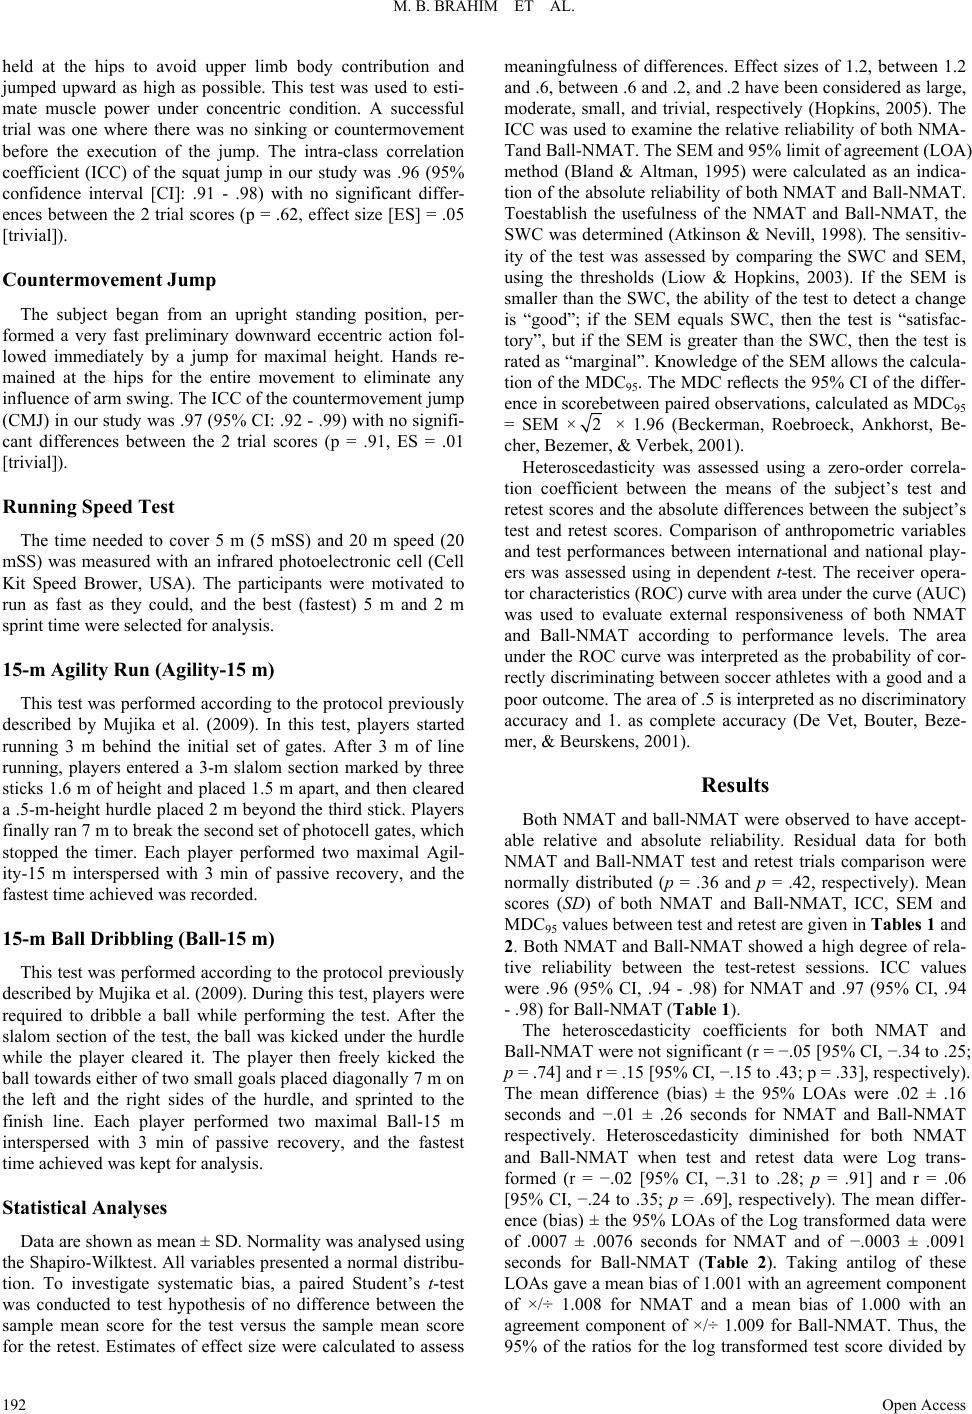 M. B. BRAHIM ET AL. held at the hips to avoid upper limb body contribution and jumped upward as high as possible. This test was used to esti- mate muscle power under concentric condition. A successful trial was one where there was no sinking or countermovement before the execution of the jump. The intra-class correlation coefficient (ICC) of the squat jump in our study was .96 (95% confidence interval [CI]: .91 - .98) with no significant differ- ences between the 2 trial scores (p = .62, effect size [ES] = .05 [trivial]). Countermovement J ump The subject began from an upright standing position, per- formed a very fast preliminary downward eccentric action fol- lowed immediately by a jump for maximal height. Hands re- mained at the hips for the entire movement to eliminate any influence of arm swing. The ICC of the countermovement jump (CMJ) in our study was .97 (95% CI: .92 - .99) with no signifi- cant differences between the 2 trial scores (p = .91, ES = .01 [trivial]). Running Speed Test The time needed to cover 5 m (5 mSS) and 20 m speed (20 mSS) was measured with an infrared photoelectronic cell (Cell Kit Speed Brower, USA). The participants were motivated to run as fast as they could, and the best (fastest) 5 m and 2 m sprint time were selected for analysis. 15-m Agility Run (Agility-15 m) This test was performed according to the protocol previously described by Mujika et al. (2009). In this test, players started running 3 m behind the initial set of gates. After 3 m of line running, players entered a 3-m slalom section marked by three sticks 1.6 m of height and placed 1.5 m apart, and then cleared a .5-m-height hurdle placed 2 m beyond the third stick. Players finally ran 7 m to break the second set of photocell gates, which stopped the timer. Each player performed two maximal Agil- ity-15 m interspersed with 3 min of passive recovery, and the fastest time achieved was recorded. 15-m Ball Dribbling (Ball-15 m) This test was performed according to the protocol previously described by Mujika et al. (2009). During this test, players were required to dribble a ball while performing the test. After the slalom section of the test, the ball was kicked under the hurdle while the player cleared it. The player then freely kicked the ball towards either of two small goals placed diagonally 7 m on the left and the right sides of the hurdle, and sprinted to the finish line. Each player performed two maximal Ball-15 m interspersed with 3 min of passive recovery, and the fastest time achieved was kept for analysis. Statistical Analyses Data are shown as mean ± SD. Normality was analysed using the Shapiro-Wilktest. All variables presented a normal distribu- tion. To investigate systematic bias, a paired Student’s t-test was conducted to test hypothesis of no difference between the sample mean score for the test versus the sample mean score for the retest. Estimates of effect size were calculated to assess meaningfulness of differences. Effect sizes of 1.2, between 1.2 and .6, between .6 and .2, and .2 have been considered as large, moderate, small, and trivial, respectively (Hopkins, 2005). The ICC was used to examine the relative reliability of both NMA- Tand Ball-NMAT. The SEM and 95% limit of agreement (LOA) method (Bland & Altman, 1995) were calculated as an indica- tion of the absolute reliability of both NMAT and Ball-NMAT. Toestablish the usefulness of the NMAT and Ball-NMAT, the SWC was determined (Atkinson & Nevill, 1998). The sensitiv- ity of the test was assessed by comparing the SWC and SEM, using the thresholds (Liow & Hopkins, 2003). If the SEM is smaller than the SWC, the ability of the test to detect a change is “good”; if the SEM equals SWC, then the test is “satisfac- tory”, but if the SEM is greater than the SWC, then the test is rated as “marginal”. Knowledge of the SEM allows the calcula- tion of the MDC95. The MDC reflects the 95% CI of the differ- ence in scorebetween paired observations, calculated as MDC95 = SEM ×2 × 1.96 (Beckerman, Roebroeck, Ankhorst, Be- cher, Bezemer, & Verbek, 2001). Heteroscedasticity was assessed using a zero-order correla- tion coefficient between the means of the subject’s test and retest scores and the absolute differences between the subject’s test and retest scores. Comparison of anthropometric variables and test performances between international and national play- ers was assessed using in dependent t-test. The receiver opera- tor characteristics (ROC) curve with area under the curve (AUC) was used to evaluate external responsiveness of both NMAT and Ball-NMAT according to performance levels. The area under the ROC curve was interpreted as the probability of cor- rectly discriminating between soccer athletes with a good and a poor outcome. The area of .5 is interpreted as no discriminatory accuracy and 1. as complete accuracy (De Vet, Bouter, Beze- mer, & Beurskens, 2001). Results Both NMAT and ball-NMAT were observed to have accept- able relative and absolute reliability. Residual data for both NMAT and Ball-NMAT test and retest trials comparison were normally distributed (p = .36 and p = .42, respectively). Mean scores (SD) of both NMAT and Ball-NMAT, ICC, SEM and MDC95 values between test and retest are given in Tables 1 and 2. Both NMAT and Ball-NMAT showed a high degree of rela- tive reliability between the test-retest sessions. ICC values were .96 (95% CI, .94 - .98) for NMAT and .97 (95% CI, .94 - .98) for Ball-NMAT (Table 1). The heteroscedasticity coefficients for both NMAT and Ball-NMAT were not significant (r = −.05 [95% CI, −.34 to .25; p = .74] and r = .15 [95% CI, −.15 to .43; p = .33], respectively). The mean difference (bias) ± the 95% LOAs were .02 ± .16 seconds and −.01 ± .26 seconds for NMAT and Ball-NMAT respectively. Heteroscedasticity diminished for both NMAT and Ball-NMAT when test and retest data were Log trans- formed (r = −.02 [95% CI, −.31 to .28; p = .91] and r = .06 [95% CI, −.24 to .35; p = .69], respectively). The mean differ- ence (bias) ± the 95% LOAs of the Log transformed data were of .0007 ± .0076 seconds for NMAT and of −.0003 ± .0091 seconds for Ball-NMAT (Table 2). Taking antilog of these LOAs gave a mean bias of 1.001 with an agreement component of ×/÷ 1.008 for NMAT and a mean bias of 1.000 with an agreement component of ×/÷ 1.009 for Ball-NMAT. Thus, the 95% of the ratios for the log transformed test score divided by Open Access 192  M. B. BRAHIM ET AL. log transformed retest score should be contained between .993 (1.001 ÷ 1.008) and 1.009 (1.001 × 1.0086) for NMAT and between .991 (1.000 ÷ 1.0091) and 1.009 (1.000 × 1.0091) for Ball-NMAT. Descriptive data from testing performance is listed in Table 3, including NMAT, Ball-NMAT, 20 m straight sprint, JS and CMJ performed separately by international and national level groups. Independent sample t-test revealed that international level soccer players had significantly better performance in whole tests, especially NMAT and Ball-NMAT (.01 < p < .001; Table 3). A receiver operator characteristic (ROC) curve analy- sis was calculated between international and national level soc- cer players. The NMAT was considered having very good dis- criminant ability. The areas under the ROC curve were .85 (95% CI, .71 to .94; p < .001) for NMAT and .92 (95% CI, .79 to .98; p < .001) for Ball-NMAT (Figure 2). Table 4 showed that both NMAT and Ball-NMAT were re- spectively correlated with Agility-15 m and Ball-15 m (r = .78 and r = .81; all p < .001, respectively). In addition, both tests were significantly correlated with maximal speed and lower limb power (r = .51 to r = .6, .01 < p < .001). Discussion The purpose of this study was to assess the reliability, valid- ity and sensitivity of the NMAT with and without ball as well as to examine the relationship between this test and Agility-15 m and both sprint and vertical jump. The main design idea of the NMAT was to consider the forward, lateral, back, and mul- tidirectional movement patterns encountered during soccer games. In the present study, we found a high reliability of the NMAT with and without ball was high across the two meas- urement trials. Several recent studies usually investigated the reliability of field tests by using 2 commons indices including the ICC values and 95% LOA method (Haj-Sassi, Dardouri, Haj Yahmed, Gmada, Mahfoudhi, & Gharbi, 2009; Haj Sassi, Dardouri, Gharbi, Chaouachi, Mansour, Rabhi et al., 2011; Hachana, Chaabène, Nabli, Attia, Moualhi, Farhat et al., 2013). These studies considered the two methods as the most appro- priate and objective for reliability assessment. ICCs across the two trials in our study were .96 and .97 for NMAT and Ball- NMAT, respectively. These values were in the same range of relative reliability value indices reported in other agility tests (Haj-Sassi, Dardouri, Haj Yahmed, Gmada, Mahfoudhi, & Gharbi, 2009; Haj Sassi, Dardouri, Gharbi, Chaouachi, Man- sour, Rabhi et al., 2011; Hachana, Chaabène, Nabli, Attia, Moualhi, Farhat et al., 2013). Haj-Sassi et al. (2009) reported an ICC of .92 to .96 across two modified agility T-test trials in men and women physical education students. In the same con- text, Hachana et al. (2013) found an ICC of .96 across two Illi- nois agility run trials in 89team sports players. It is commonly accepted that an ICC over .9 is considered high for physiologi- cal field tests (Vincent, 1995); so, our results demonstrated a high reliability of both NAMT and Ball-NMAT. Table 1. Performance characteristics and results of relative reliability of both NMAT and Ball-NMAT. Test (s) Retest (s) Mean difference ICC (95% CI) dz NMAT (s) 9.56 ± .32 9.54 ± .29 .01 ± .08 .96 (.94 - .98) .06 Ball-NMAT (s) 11.92 ± .5 11.93 ± .51 .01 ± .13 .97 (.94 - .98) .02 Note: ICC = intraclass correlation coefficient; dz = Cohen’s d for the paired sample t-test. Table 2. Performance characteristics, minimal detectable change and results of absolute reliability of both NMAT and Ball-NMAT. Bias 95% LOA Ratio LOA SEM seconds SWC seconds MDC seconds NMAT .02 .16 .0007 ± .0076 .05 .06 .15 Ball-NMAT −.01 .25 −.0003 ± .0091 .09 .1 .25 Note: LOA: limits of agreement; SEM: standard error of measurement; SWC: smallest worth-while change; MDC: minimal detectable change. Table 3. Results of physical testing. International (n = 21) National (n = 23) Combined (n = 44) 5 mSS (second) 1.05 ± .1 1.09 ± .12** 1.07 ± .09 20 mSS (second) 2.85 ± .09 3.1 ± .17*** 2.98 ± 0.9 Agility-15 m (second) 3.69 ± .16 3.8 ± .31*** 3.75 ± .15 Ball-15 m (second) 4.64 ± .3 4.78 ± .36*** 4.74 ± .28 NMAT (second) 9.33 ± .27 9.7 ± .22*** 9.52 ± .31 Ball-NMAT (second) 11.48 ± .42 12.24 ± .42*** 11.88 ± .5 SJ (cm) 39.83 ± 1.75 30.07 ± 4.78*** 34.84 ± 2.22 CMJ (cm) 47.06 ± 2.12 34.46 ± 3.61** 40.29 ± 2.71 Open Access 193  M. B. BRAHIM ET AL. Figure 2. Receiver operating characteristics curve for both NMAT and ball-NMAT. NMAT: Sensitivity 91%, specificity 67% and criterion was >9.36 s; Ball-NMAT: Sensitiv- ity 96%, specificity 76% and criterion was >11.91 s. Table 4. Relationship between both NMAT and Ball-NMAT with other tests’ performance. NMAT Ball-NMAT r p r p V20 .51 <.01 .54 <.01 Agility-15 m .78 <.001 Ball-15 m .81 <.001 SJ .6 <.01 .55 <.01 CMJ .6 <.01 .58 <.01 The relative reliability of both NMAT and Ball-NMAT has been also confirmed in our study by the 95% LOAs. In our study, the bias ± the 95% LOAs of the NMAT and Ball-NMAT were .02 ± .16 seconds and −.01 ± .26 seconds, respectively. The antilog of these LOAs could be expressed as the mean bias of 1.001 ×/÷ 1.0081 for NMAT and of 1.000 ×/÷ 1.009 for Ball-NMAT. Thus, the 95% of the ratios for the log trans- formed test score divided by log transformed retest score should be contained between .993 (1.001 ÷ 1.008) and 1.009 (1.001 × 1.0086) for NMAT and between .991 (1.000 ÷ 1.0091) and 1.009 (1.000 × 1.0091) for Ball-NMAT. As practical con- siderations, when an athlete from the experimental group per- formed respectively 9.5 seconds and 11.9 seconds on the NMAT and the Ball-NMAT, on the retest he could perform a score as high as 9.5 × 1.009 = 9.59 seconds, or as low as 9.5 × .993 = 9.43 seconds for NMAT and a score as high as 11.9 × 1.009 = 12.01 seconds, or as low as 11.9 × .991 = 11.79 sec- onds (Cooper, Baker, Tong, Roberts, & Hanford, 2005). Ac- cording to Atkinson and Nevill (1998), it is important to use the MDC95 as a criterion todetermine whether a real change has occurred between testand retest. In this study, the MDC95 for the NMAT and the Ball-NMAT have been .15 and .25 seconds, respectively. When changes in both NMAT and Ball-NMAT test-retest score are ±.15 and ±.25 seconds, true changes can be associated. Thus, in agreement with recent studies of Haj-Sassi et al. (2009) and Hachana et al. (2013), we could consider these LOAs acceptable. One of the most aims of the NMAT is to select athletes. To that end, it should be able to discriminate athletes of different competitive and fitness level. This kind of validity is commonly established by testing differences between groups of subjects of different competitive level (Impellizzeri & Marcora, 2009). In our study, a significant difference has been found between both NMAT and Ball-NMAT performances of international and national groups. In clinimetrics, alternative methods such as the receiver operator characteristics (ROC) curve are gaining popularity and can be used to validate the discriminant ability and the responsiveness of physiological and performance tests (Mannion, Elfering, Staerkle, Junge, Grob, Semmer et al., 2005). Thereby, a performance test was considered responsive if its area under the ROC curve was ≥.7 (Mannion, Elfering, Staerkle, Junge, Grob, Semmer et al., 2005). Indeed, the area under the ROC curve represents the probability of correctly discriminating international from national soccer players using both NMAT and Ball-NMAT. Accordingly, in the present study we found that the areas under the ROC curve were >.7 (.85 [95% CI, .71 to .94] and .92 [95% CI, .79 to .98] for NMAT and Ball-NMAT, respectively). The test scores able to differentiate between international and national soccer players are >9.36 seconds for NMAT and >11.91 seconds for Ball- NMAT. This cut-off value gives true positive rates (sensitivity) of 91 and 96% and false positive rates (1-specificity) of 67 and 76% for NMAT and Ball-NMAT, respectively. Therefore, this kind of statistical tool suggest that both NMAT and Ball- NMAT have excellent discriminant ability if its purpose is to differentiate between international and national soccer players. Pearson product-moment correlations have been also calcu- lated between the NMAT and Agility-15 m, vertical jump and straight sprint tests (Table 4). The coefficient of determinant (R2) highlighted that NMAT and Agility-15 m as well as Ball-NMAT and Ball-15 m share 61% and 66% common vari- ance, respectively. These results indicate that the NMAT could be used to evaluate change of direction speed, and thus soc- cer-specific agility. Accordingly, compared with other testing methods, the NMAT could be considered as the most appropri- ate test for assessing specific-agility in soccer. Since, this test Open Access 194 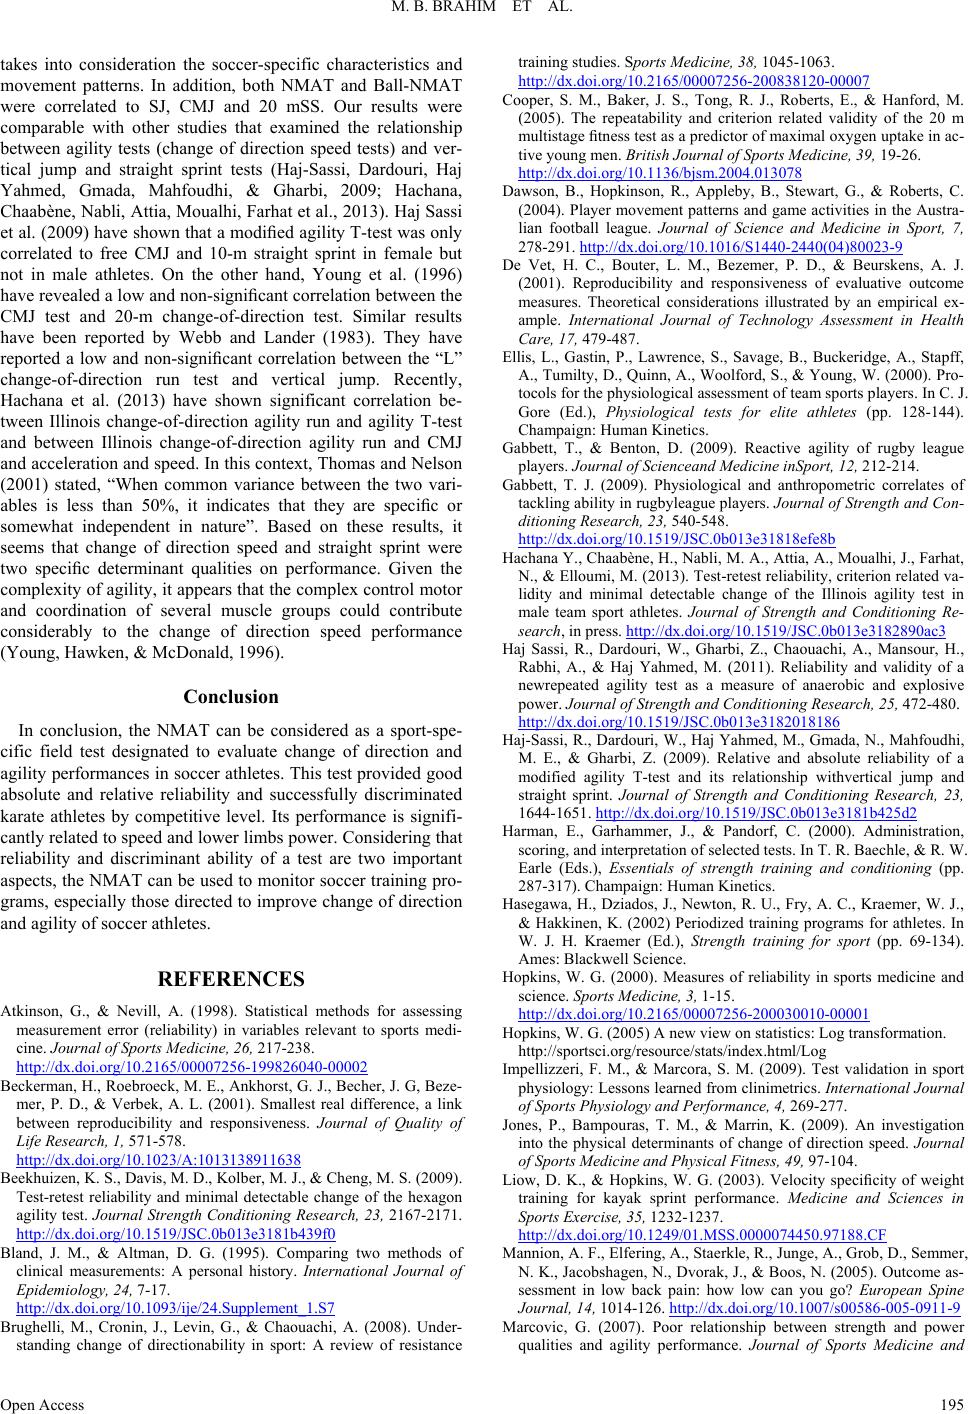 M. B. BRAHIM ET AL. takes into consideration the soccer-specific characteristics and movement patterns. In addition, both NMAT and Ball-NMAT were correlated to SJ, CMJ and 20 mSS. Our results were comparable with other studies that examined the relationship between agility tests (change of direction speed tests) and ver- tical jump and straight sprint tests (Haj-Sassi, Dardouri, Haj Yahmed, Gmada, Mahfoudhi, & Gharbi, 2009; Hachana, Chaabène, Nabli, Attia, Moualhi, Farhat et al., 2013). Haj Sassi et al. (2009) have shown that a modified agility T-test was only correlated to free CMJ and 10-m straight sprint in female but not in male athletes. On the other hand, Young et al. (1996) have revealed a low and non-significant correlation between the CMJ test and 20-m change-of-direction test. Similar results have been reported by Webb and Lander (1983). They have reported a low and non-significant correlation between the “L” change-of-direction run test and vertical jump. Recently, Hachana et al. (2013) have shown significant correlation be- tween Illinois change-of-direction agility run and agility T-test and between Illinois change-of-direction agility run and CMJ and acceleration and speed. In this context, Thomas and Nelson (2001) stated, “When common variance between the two vari- ables is less than 50%, it indicates that they are specific or somewhat independent in nature”. Based on these results, it seems that change of direction speed and straight sprint were two specific determinant qualities on performance. Given the complexity of agility, it appears that the complex control motor and coordination of several muscle groups could contribute considerably to the change of direction speed performance (Young, Hawken, & McDonald, 1996). Conclusion In conclusion, the NMAT can be considered as a sport-spe- cific field test designated to evaluate change of direction and agility performances in soccer athletes. This test provided good absolute and relative reliability and successfully discriminated karate athletes by competitive level. Its performance is signifi- cantly related to speed and lower limbs power. Considering that reliability and discriminant ability of a test are two important aspects, the NMAT can be used to monitor soccer training pro- grams, especially those directed to improve change of direction and agility of soccer athletes. REFERENCES Atkinson, G., & Nevill, A. (1998). Statistical methods for assessing measurement error (reliability) in variables relevant to sports medi- cine. Journal of Sports Medicine, 26, 217-238. http://dx.doi.org/10.2165/00007256-199826040-00002 Beckerman, H., Roebroeck, M. E., Ankhorst, G. J., Becher, J. G, Beze- mer, P. D., & Verbek, A. L. (2001). Smallest real difference, a link between reproducibility and responsiveness. Journal of Quality of Life Research, 1, 571-578. http://dx.doi.org/10.1023/A:1013138911638 Beekhuizen, K. S., Davis, M. D., Kolber, M. J., & Cheng, M. S. (2009). Test-retest reliability and minimal detectable change of the hexagon agility test. Journal Strength Conditioning Research, 23, 2167-2171. http://dx.doi.org/10.1519/JSC.0b013e3181b439f0 Bland, J. M., & Altman, D. G. (1995). Comparing two methods of clinical measurements: A personal history. International Journal of Epidemiology, 24, 7-17. http://dx.doi.org/10.1093/ije/24.Supplement_1.S7 Brughelli, M., Cronin, J., Levin, G., & Chaouachi, A. (2008). Under- standing change of directionability in sport: A review of resistance training studies. Sports Medicine, 38, 1045-1063. http://dx.doi.org/10.2165/00007256-200838120-00007 Cooper, S. M., Baker, J. S., Tong, R. J., Roberts, E., & Hanford, M. (2005). The repeatability and criterion related validity of the 20 m multistage fitness test as a predictor of maximal oxygen uptake in ac- tive young men. British Journal of Sports Medicin e, 39, 19-26. http://dx.doi.org/10.1136/bjsm.2004.013078 Dawson, B., Hopkinson, R., Appleby, B., Stewart, G., & Roberts, C. (2004). Player movement patterns and game activities in the Austra- lian football league. Journal of Science and Medicine in Sport, 7, 278-291. http://dx.doi.org/10.1016/S1440-2440(04)80023-9 De Vet, H. C., Bouter, L. M., Bezemer, P. D., & Beurskens, A. J. (2001). Reproducibility and responsiveness of evaluative outcome measures. Theoretical considerations illustrated by an empirical ex- ample. International Journal of Technology Assessment in Health Care, 17, 479-487. Ellis, L., Gastin, P., Lawrence, S., Savage, B., Buckeridge, A., Stapff, A., Tumilty, D., Quinn, A., Woolford, S., & Young, W. (2000). Pro- tocols for the physiological assessment of team sports players. In C. J. Gore (Ed.), Physiological tests for elite athletes (pp. 128-144). Champaign: Human Kinetics. Gabbett, T., & Benton, D. (2009). Reactive agility of rugby league players. Journal of Scie n ce an d Medicine inSport, 12, 212-214. Gabbett, T. J. (2009). Physiological and anthropometric correlates of tackling ability in rugbyleague players. Journal of Strength and Con- ditioning Research, 2 3 , 540-548. http://dx.doi.org/10.1519/JSC.0b013e31818efe8b Hachana Y., Chaabène, H., Nabli, M. A., Attia, A., Moualhi, J., Farhat, N., & Elloumi, M. (2013). Test-retest reliability, criterion related va- lidity and minimal detectable change of the Illinois agility test in male team sport athletes. Journal of Strength and Conditioning Re- search, in press. http://dx.doi.org/10.1519/JSC.0b013e3182890ac3 Haj Sassi, R., Dardouri, W., Gharbi, Z., Chaouachi, A., Mansour, H., Rabhi, A., & Haj Yahmed, M. (2011). Reliability and validity of a newrepeated agility test as a measure of anaerobic and explosive power. Journal of Strength and C o nditioning Research, 2 5, 472-480. http://dx.doi.org/10.1519/JSC.0b013e3182018186 Haj-Sassi, R., Dardouri, W., Haj Yahmed, M., Gmada, N., Mahfoudhi, M. E., & Gharbi, Z. (2009). Relative and absolute reliability of a modified agility T-test and its relationship withvertical jump and straight sprint. Journal of Strength and Conditioning Research, 23, 1644-1651. http://dx.doi.org/10.1519/JSC.0b013e3181b425d2 Harman, E., Garhammer, J., & Pandorf, C. (2000). Administration, scoring, and interpretation of selected tests. In T. R. Baechle, & R. W. Earle (Eds.), Essentials of strength training and conditioning (pp. 287-317). Champaign: Human Kinetics. Hasegawa, H., Dziados, J., Newton, R. U., Fry, A. C., Kraemer, W. J., & Hakkinen, K. (2002) Periodized training programs for athletes. In W. J. H. Kraemer (Ed.), Strength training for sport (pp. 69-134). Ames: Blackwell Science. Hopkins, W. G. (2000). Measures of reliability in sports medicine and science. Sports Medicine, 3, 1-15. http://dx.doi.org/10.2165/00007256-200030010-00001 Hopkins, W. G. (2005) A new view on statistics: Log transformation. http://sportsci.org/resource/stats/index.html/Log Impellizzeri, F. M., & Marcora, S. M. (2009). Test validation in sport physiology: Lessons learned from clinimetrics. International Journal of Sports Physiology and Performance, 4, 269-277. Jones, P., Bampouras, T. M., & Marrin, K. (2009). An investigation into the physical determinants of change of direction speed. Journal of Sports Medicine and Physical Fitness, 49, 97-104. Liow, D. K., & Hopkins, W. G. (2003). Velocity specificity of weight training for kayak sprint performance. Medicine and Sciences in Sports Exercise, 35, 1232-1237. http://dx.doi.org/10.1249/01.MSS.0000074450.97188.CF Mannion, A. F., Elfering, A., Staerkle, R., Junge, A., Grob, D., Semmer, N. K., Jacobshagen, N., Dvorak, J., & Boos, N. (2005). Outcome as- sessment in low back pain: how low can you go? European Spine Journal, 14, 1014-126. http://dx.doi.org/10.1007/s00586-005-0911-9 Marcovic, G. (2007). Poor relationship between strength and power qualities and agility performance. Journal of Sports Medicine and Open Access 195  M. B. BRAHIM ET AL. Open Access 196 Physical Fitness, 47, 276-283. Mohr, M., Krustrup, P., & Bangsbo, J. (2005). Fatigue in soccer: A brief review. Journa l o f S p o r t s S c i e nces, 23, 593-599. http://dx.doi.org/10.1080/02640410400021286 Reilly, T., Williams, A. M., Nevill, A., & Franks, A. (2000). A multid- isciplinary approach to talent identification in soccer. Journal of Sports Sciences, 18, 695-702. http://dx.doi.org/10.1080/02640410050120078 Reilly, T., Bangsbo, J., & Franks, A. (2000). Anthropometric and physiological predispositions for elite soccer. Journal of Sports Sci- ences, 18, 669-683. http://dx.doi.org/10.1080/02640410050120050 Sheppard, J. M., Young, W. B., Doyle, T. L. A., Sheppard, T. A., & Newton, R. U. (2006). An evaluation of a new test of reactive agility and its relationship to sprint speed and change of direction speed. Journal of Science and M edicine in Sport, 9, 342-349. http://dx.doi.org/10.1016/j.jsams.2006.05.019 Sheppard, J. M., & Young, W. B. (2006). Agility literature review: Classifications, training and testing. Journal of Sports Sciences, 24, 919-932. http://dx.doi.org/10.1080/02640410500457109 Stølen, T., Chamari, K., Castagna, C., & Wisløff, U. (2005). Physiol- ogy of soccer: An update. Journal of Sports Medicine, 35, 501-536. http://dx.doi.org/10.2165/00007256-200535060-00004 Thomas, J. R., & Nelson, J. K. (2001). Research methods in physical activity (4th ed.). Champaign, IL: Human Kinetics. Vaeyens, R., Lenoir, M., & Williams, A. M. (2007). Mechanisms un- derpinning successful decision making in skilled youth soccer play- ers: An analysis of visual search behaviors. Journal of Motor Behav- ior, 39, 395-408. http://dx.doi.org/10.3200/JMBR.39.5.395-408 Vincent, W. J. (1995). Statistics in Kinesiology. Champaign, IL: Hu- man Kinetics. Webb, P., & Lander, J. (1983). An economical fitness testing battery for high school and college rugby teams. Sports Coach, 7, 44-46. Williams, A. M., Davids, K., Burwitz, L., & Williams, J. G. (1994). Visual search strategies in experienced and inexperienced soccer players. Research Quarterly for Exercise and Sport, 65, 127-135. http://dx.doi.org/10.1080/02701367.1994.10607607 Williams, A. M. (2000). Perceptual skill in soccer: Implications for talent identification and development. Journal of Sports Sciences, 18, 737-705. http://dx.doi.org/10.1080/02640410050120113 Young, W. B., James, B., & Montgomery, I. (2002). Is muscle power related to running speed with changes of direction. Journal of Sports Medicine and Physical Fitness, 42, 282-288. Young, W. B., Hawken, M., & McDonald, L. (1996). Relationship between speed, agility, and strength qualities in Australian Rules football. Streng th Conditi o ning C oach, 4, 3-6.
|