Energy and Power Engineering, 2013, 5, 1352-1356
doi:10.4236/epe.2013.54B256 Published Online July 2013 (http://www.scirp.org/journal/epe)
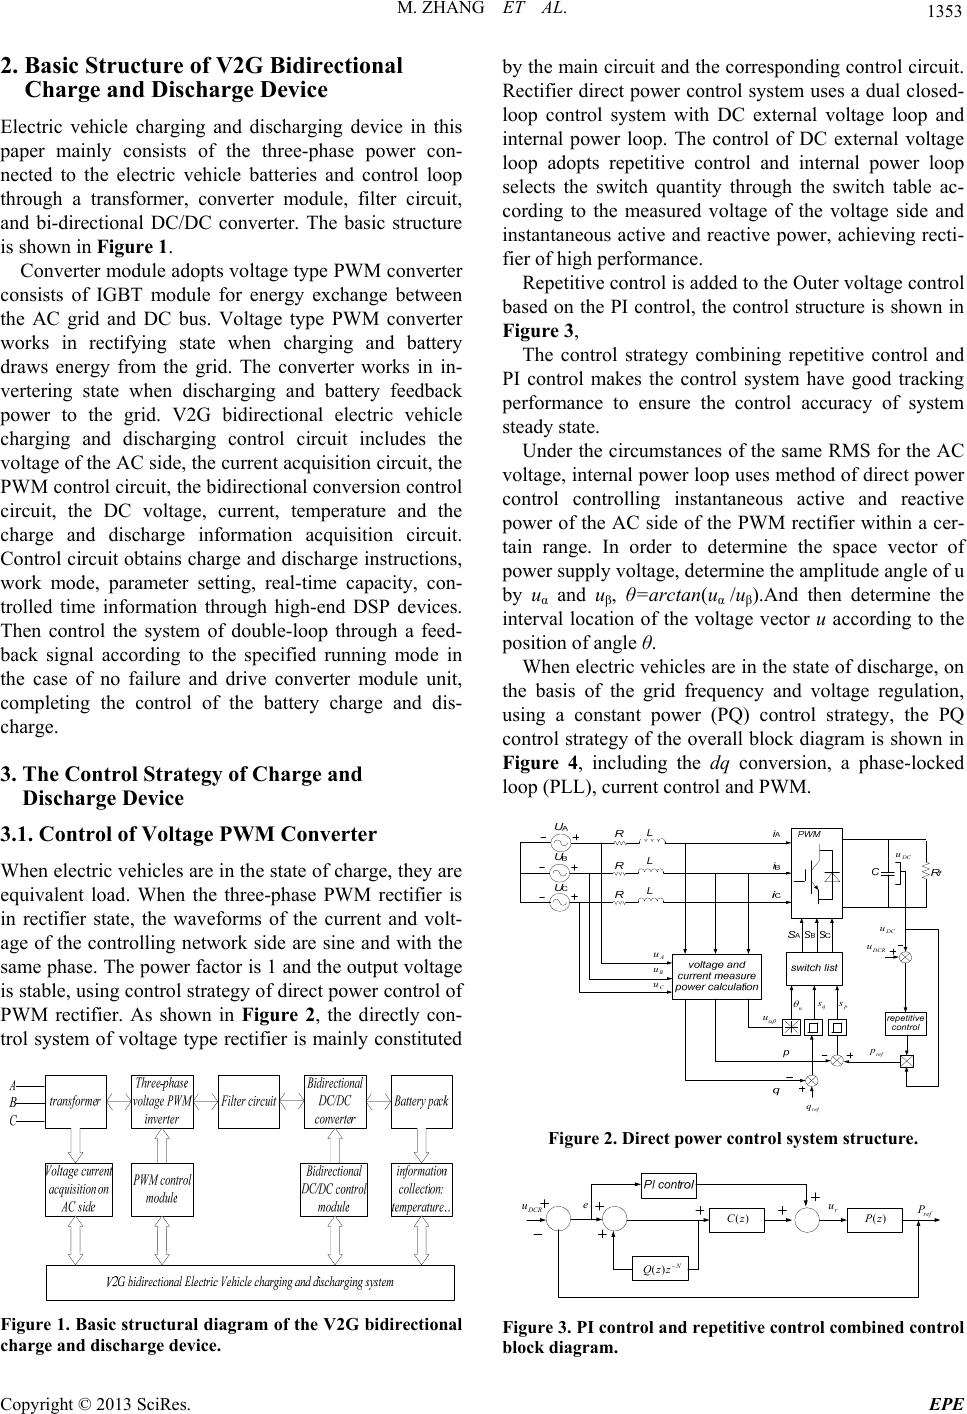
Research on V2G Control Strategy for EV Charge and
Discharge Equipment
Mai Zhang, Caihong Zhao, Xiaobo Tang, Li Liu, Lijuan Tan
School of Electrical and Automation Engineering, Nanjing Normal University, Nanjing, China
Email: zhangmai1988@126.com, 61081@njnu.edu.cn, xiaobotang@126.com
Received March, 2013
ABSTRACT
In this paper, the fundamental structure of charge and discharge device of V2G is analyzed. As for three phase voltage
source PWM converter’s control, this paper presents that the control strategy of direct power control PWM rectifier is
adopted under charging operation and constant power control strategy is used under discharging operation. For bidirec-
tional DC/DC converter control strategy, dual closed-loop control of external voltage loop and internal current loop is
put into use. The whole system of charge and discharge device of V2G is modeled and simulated by using the toolbox
of PSCAD/EMTDC. Two-way power energy and information interaction of electric vehicle and power grid has been
realized, current harmonic on grid side is decreased, power factor and power quality are improved.
Keywords: V2G; PWM; Direct Power Control; Constant Power Control; DC/DC Converter
1. Introduction
In recent years, the state has vigorously developed smart
grid technology [1], Electric vehicles (Electric Vehicle,
EV) technology has gained rapid development in China
[2]. With the improvement of battery technology and the
charge-discharge cycle life, power battery in the Electric
vehicles can be used as a distributed energy storage unit.
Electric vehicles are not only as a power system load
power consumption but also energy stored in vehicles
can be given when the power grid needs, which is V2G
technology two-way interaction of electric vehicles and
smart grid[3-4]. The essence of V2G technology is on the
basis of the full information interaction for electric vehi-
cles and the power grid, which realizes the two-way flow
of energy between the vehicles and the power grid. Ac-
cording to the charging and discharging strategy, meet
the needs of the premise of the electric vehicle users
traveling, remaining energy participates in load regula-
tion, including grid peak-to-valley regulation, standby
power, frequency response, and promote the application
of renewable energy access and so on, which can bring in
revenue for the grid and electric vehicles users. V2G
technology implementation will facilitate a truly seam-
less integration of electric vehicles and smart grid.
The most widely used electric vehicle battery charge
and discharge technology in China currently is non-con-
trolled rectifier and DC/DC chopper. This technology has
advantages of good dynamic performance, smaller input
ripple on DC side, but there are shortcomings as the high
harmonic content on the system side, large size, low
power factor and pollution on the grid [5,6]. With the
development of power electronics technology, the system
of the charging and discharging of the DC/DC converter
technology has been gradually promoted. The system
consists of an isolated DC/DC converter and buck chop-
per. The drawback is that only the resistance is dis-
charged in the discharge of the battery, energy cannot
give back to the power grid, resulting in wasting a lot of
energy. This paper uses the three-phase PWM converter
and bi-directional DC/DC converter to constitute the
V2G two-way charging and discharging device of the
electric vehicle. The three-phase voltage-type PWM
converter uses the control strategy of direct power con-
trol of PWM rectifier under charging operation and
control strategy of constant power under discharging
operation. For bidirectional DC/DC converter control
strategy, dual closed-loop control of external voltage
loop and internal current loop is put into use. V2G charge
and discharge device using the above control strategies
has the follow benefits: Reducing the current harmonics
of the grid-side in the charging process, improving the
power factor and increasing the working frequency. The
electric vehicles as an energy storage system can also
make the energy feedback to the grid, so the energy uti-
lization can be further raised, achieving the bi-direc-
tional flow of energy [7-9].
*Project supported by the Nature Science Foundation of the Jiangsu
Higher Education Institutions of China (Grant No.2010111Tsj0113)
Copyright © 2013 SciRes. EPE
M. ZHANG ET AL. 1353
2. Basic Structure of V2G Bidirectional
Charge and Discharge Device
Electric vehicle charging and discharging device in this
paper mainly consists of the three-phase power con-
nected to the electric vehicle batteries and control loop
through a transformer, converter module, filter circuit,
and bi-directional DC/DC converter. The basic structure
is shown in Figure 1.
Converter module adopts voltage type PWM converter
consists of IGBT module for energy exchange between
the AC grid and DC bus. Voltage type PWM converter
works in rectifying state when charging and battery
draws energy from the grid. The converter works in in-
vertering state when discharging and battery feedback
power to the grid. V2G bidirectional electric vehicle
charging and discharging control circuit includes the
voltage of the AC side, the current acquisition circuit, the
PWM control circuit, the bidirectional conversion control
circuit, the DC voltage, current, temperature and the
charge and discharge information acquisition circuit.
Control circuit obtains charge and discharge instructions,
work mode, parameter setting, real-time capacity, con-
trolled time information through high-end DSP devices.
Then control the system of double-loop through a feed-
back signal according to the specified running mode in
the case of no failure and drive converter module unit,
completing the control of the battery charge and dis-
charge.
3. The Control Strategy of Charge and
Discharge Device
3.1. Control of Voltage PWM Converter
When electric vehicles are in the state of charge, they are
equivalent load. When the three-phase PWM rectifier is
in rectifier state, the waveforms of the current and volt-
age of the controlling network side are sine and with the
same phase. The power factor is 1 and the output voltage
is stable, using control strategy of direct power control of
PWM rectifier. As shown in Figure 2, the directly con-
trol system of voltage type rectifier is mainly constituted
Figure 1. Basic structural diagram of the V2G bidirectional
charge and discharge devic e.
by the main circuit and the corresponding control circuit.
Rectifier direct power control system uses a dual closed-
loop control system with DC external voltage loop and
internal power loop. The control of DC external voltage
loop adopts repetitive control and internal power loop
selects the switch quantity through the switch table ac-
cording to the measured voltage of the voltage side and
instantaneous active and reactive power, achieving recti-
fier of high performance.
Repetitive control is added to the Outer voltage control
based on the PI control, the control structure is shown in
Figure 3,
The control strategy combining repetitive control and
PI control makes the control system have good tracking
performance to ensure the control accuracy of system
steady state.
Under the circumstances of the same RMS for the AC
voltage, internal power loop uses method of direct power
control controlling instantaneous active and reactive
power of the AC side of the PWM rectifier within a cer-
tain range. In order to determine the space vector of
power supply voltage, determine the amplitude angle of u
by uα and uβ, θ=arctan(uα /uβ).And then determine the
interval location of the voltage vector u according to the
position of angle θ.
When electric vehicles are in the state of discharge, on
the basis of the grid frequency and voltage regulation,
using a constant power (PQ) control strategy, the PQ
control strategy of the overall block diagram is shown in
Figure 4, including the dq conversion, a phase-locked
loop (PLL), current control and PWM.

u
n
q
s
p
s
DCR
u
A
u
B
u
C
u
DC
u
ref
p
DC
u
ref
q
Figure 2. Direct power control system structure.
N
zzQ
)(
)( zC )( zP
DCR
u
e
r
u
ref
P
Figure 3. PI control and repetitive control combined control
block diagram.
Copyright © 2013 SciRes. EPE
M. ZHANG ET AL.
1354
Figure 4. Overall block diagram of PQ control strategy.
Due to the d, q-axis variable Coupled with each other,
feed forward decoupling control strategy can be used,
when the current regulator with PI regulator, the control
equation of ud, uq as shown in formula(1) and formula(2)
*
()()
iL
q
iP
ddd
K
KiiLi
s
u
 d
e
(1)
*
()() q
iL
qqq
iP d
K
KiiLi
s
u
 e
i
(2)
KiP represents current loop proportional control gain and
integral gain; KiL represents integral control gain; id
*, iq
*
represent id, iq current command value.
Current loop d, q axis can be controlled independently
after decoupling. The output of current loop PI controller
and the integration of current state feedback decoupling
and grid voltage feed-forward compensation two syn-
thetic AC side of the converter d, q-axis output voltage
reference value ud and uq, by adjusting the active current
iq and reactive current id to track reference current iq
* and
id
*and realize respectively control the active power P
and reactive power Q output. According to formula (3)
and (4)
***
1.5( )
dqq
d
uuPii
(3)
***
1.5( )
qdq
d
uuQi
(4)
Just change the value of iq
* and id
*, you can adjust the
value of active and reactive power, to calculate P * and Q
*.
3.2. DC/DC Converter Control
The charging and discharging of the DC/DC converter
usually use half-bridge structure which current can flow
in both directions and dual closed-loop control system
with external voltage loop and internal current loop.
Figures 5 and 6 respectively show a control block dia-
gram for the Buck and Boost mode. The voltage error
signal, which is equal to the difference between the ref-
erence voltage value and the output voltage val-
ue——(Battery side voltage in the Buck mode, and
DC-bus side voltage in the Boost mode) obtained from
sampling , obtain the reference value of the inductor cur-
rent in the inner loop (current) control system after going
through the voltage PI regulator. The inductor current
error value, which is equal to the difference between the
reference value of the inductor current as above men-
tioned and obtained from sampling, obtain the reference
value of the Inductor voltage after going through the
current PI regulator. Finally, it minus the actual value of
the voltage obtained from sampling, and we get the
IGBT drive signal by comparing the error and triangle
wave.
4. Simulation Analysis of the System
To achieve the two-way power energy and information
interaction of electric vehicle and power grid, we put the
bidirectional DC/DC converter and battery pack with
equivalent and model it by using the toolbox of PSCAD/
EMTDC. Main circuit model is shown in Figure 7.
AC power is 10 kV and we reduce it through the 10
kV/0.4 kV transformer. Transformer uses Dyn11 connec-
tion. Inductor filter inductance value is 5 mH and resis-
tance is 0.5 in AC side. Capacitance is 2215 μF. Simu-
lation time is 0.5 s and step is 0.2 μs. Voltage is almost
constant in 700 V in DC side. Voltage waveform is
shown in Figure 8, the waveform of the instantaneous
value and valid value of current in AC side is shown in
Figure 9. We can see that current harmonic on grid side
is small from the waveform.
Figure 5 Control block diagram of Buck mode.
Figure 6 Control block diagram of Boost mode.
2215[μF]
2e-3 [H]
Udc
Ea
0.01 [ohm]#2
umec
#1
T1
T1 T3
T6
T2
T5
T2
T4
T5
T6
T3
T4
D D D
D D D
0.005 [H]
0.005 [H]
0.005 [H]
Eb
Ec
0.5 [ohm]
0.5 [ohm]
0.5 [ohm]
Idc
R [ohm]
+
Figure 7. Main circuit model of the charge and discharge
device.
Copyright © 2013 SciRes. EPE
M. ZHANG ET AL. 1355
When non-controlled rectifier control is used, the vol-
tage and current waveform of electric vehicles in the
state of charging are shown in Figure 10. When direct
power control of PWM rectifier is used, A-phase’s volt-
age and current waveforms of electric vehicles in the
state of charging are shown in Figure 11 .
Figure 11 shows that the system enters rectifier opera-
tional status of unity power factor after 0.05 s. The cur-
rent of AC side is sinusoidal and has the same phase with
the voltage with the amplitude about 10 A. By comparing
Figure 10 and Figure 11, we can see that the charging
voltage and current waveforms has small harmonic under
the PWM control mode, almost reaching the standard
sine wave.
Volta
g
e Waveform in DC-side
0.00 0.10 0.20 0.30 0.40 0.50
0.00
0.10
0.20
0.30
0.40
0.50
0.60
0.70
0.80
y
Udc
Figure 8 Voltage waveform in DC-side.
A
p
hase current waveforms
t/s0.00 0.10 0.20 0.30 0.40 0.50
-0.0150
-0.0100
-0.0050
0.0000
0.0050
0.0100
0.0150
I/kA
Ia
0.0000
0.0020
0.0040
0.0060
0.0080
0.0100
0.0120
I/kA
I
Figure 9. Instantaneous value of the AC side current and
RMS waveform.
A-
p
hase volta
g
e and current w aveforms under uncontrolled rectifier char
g
in
g
0.00 0.10 0.20 0.30 0.40 0.50
-0.40
0.40
U/Kv
Ea
-0.040
0.040
i/kA
Ia
Figure 10. A-phase voltage and current waveforms under
uncontrolled rectifier charging.
In order to compare easily, the paper does spectral
analysis of line voltage Uab of the AC side under the
charging state of the non-controlled rectifier and the di-
rect power control of the PWM rectifier respectively. As
shown in Figures 12 and 13.
A
-
p
hase volta
g
e and current waveforms under char
g
in
g
t/s 0.00 0.10 0.20 0.30 0.40 0.50
-0.40
0.40
U/kV
Ea
-0.0150
0.0150
U/kV
Ia
-0.40
0.40
U/kV I/kA
Ea Ia
Figure 11. A-phase voltage and current waveforms under
charging.
Uncontrolled rectifier AC side out
p
ut line volta
g
e Uab s
p
ectrum anal
y
sis
1.0
0.0 12345678910 11 121314 1516 171819 2021 222324 25
[1] 0.38811
Figure 12. Uncontrolled rectifier AC side output line volt-
age Uab spectrum analysis.
PWM rectifier AC side out
p
ut line volta
g
e Uab s
p
ectrum anal
y
sis
1.0
0.0 12345678910 11 12 1314 1516 17 18 1920 21 22 23 24 25 26 2728
[1] 0.40749
Figure 13. PWM rectifier AC side output line voltage Uab
spectrum analysis.
Copyright © 2013 SciRes. EPE
M. ZHANG ET AL.
Copyright © 2013 SciRes. EPE
1356
A
-
p
hase volta
g
e and current waveforms under dischar
g
in
g
t
/
s0.00 0.10 0.20 0.30 0.40 0.50
-0.40
0.40
U/kV
Ea
-0.0150
0.0150
U/ kV
Ia
-0.40
0.40
U/kV I/kA
Ea Ia
Figure 14. A-phase voltage and current waveforms under
discharging.
Under the state of charging, spectrum analysis of the
non-controlled rectifier AC side of the line voltage RMS
Uab ,Uab1 = 388.12 VUab5 = 94.32 VUab7 = 59.39
VUab11 = 34.55 VIt can be seen that harmonic
content is very high. Under the state of charging, spec-
trum analysis of the PWM rectifier AC side of the line
voltage RMS Uab, Uab1 = 407.5 VUab5 = 8.07 V
Uab7 = 6.46 VUab11 = 5.25 VIt can be seen 5th
harmonic content is 2% using PWM control mode, 5th
harmonic content is 24.3% by using non-controlled recti-
fier, harmonic content has been reduced by 22.3%.
Power quality has been improved. In Figure 14, the
A-phase voltage and current waveforms in the discharged
state of the electric vehicle, the system is running on the
converter state, which can be seen by the waveform dia-
gram of voltage and current of opposite phase.
5. Conclusions
Electric vehicle V2G charging and discharging device
model studied in this paper, takes the control strategy
based on the three phase voltage PWM converter and the
DC/DC converter, which can achieve two-way energy
interaction between the grid and electric vehicles,
through simulation of PSCAD/EMTDC software. It is
verified that a fully controlled system has obvious ad-
vantage than the traditional uncontrolled system, in
views of the simulation result. The high power factor on
the grid side and the stability of DC bus voltage can be
achieved. The suppression of harmonic interference, si-
nusoidal current on the grid side and power quality are
improved obviously. The realization of V2G technology
is more effective by using this method. On the basis of
this study, the follow-up work is the modeling of Electric
Vehicle charging station. It is the possible to make a fur-
ther optimization on the control method.
REFERENCES
[1] Q. Zhong, “Research on Smart Grid Key Technology,"
Beijing: China Electric Power Press, Vol. 5, 2011, pp.
108-129.
[2] W. L. Zhang, B. Wu, W. F. Li, et al., “Discussion on
Development Trend of Battery Electric Vehicles in China
and Its Energy Supply Mode,” Power System Technology,
Vol. 33, No. 4, 2009, pp. 1-5.
[3] W. Kempton and S. Letendre, “Electric Vehicles as a
New Power Source for Electric Utilities,” Transportation
Research Part D 23, 1997, pp. 157-175.
doi:10.1016/S1361-9209(97)00001-1
[4] Kempton and Dhanju. “Electric Vehicles with V2G: Stor-
age for Large-scale Wind Power,” Windtech International,
Vol. 2, No. 1, 2006, pp. 18-21.
[5] Y. X. Lu, X. M. Zhang and X. W. Pu, “Analysis of Elec-
tric Vehicles Charging Station Harmonics,” Journal of
electric power system and automation, Vol. 18, No. 3,
2006, pp. 51-54.
[6] M. Huang, S. F. Huang and J. C. Jiang. “Harmonic Study
of Electric Vehicle Chargers,” Beijing: Journal of Beijing
Jiaotong University, Vol. 32, No. 5, 2008, pp. 85-88.
[7] X. Zhang and C. W. Zhang, “PWM Rectifier and Its Con-
trol,” Beijing: China Machine Press, China Machine Press,
Vol. 2, 2012, pp .49-65.
[8] Y. J. Chen and Y. P. Zhong, “Study on the Current Con-
trol for Voltage-Source PWM Rectifier Using Complex
Vectors,” Proceedings of the CSEE, Vol. 26, No. 2, 2006,
pp. 141-148.
[9] G. K. Venayagamoorthy and P. Mitra, K. Corzine, et al.,
Real-time Modeling of Distributed Plug-in Vehicles for
V2G Transactions,” IEEE Energy Conversion Congress
and Exposition, 2009, pp. 3937-3941