Energy and Power Engineering, 2013, 5, 1337-1343
doi:10.4236/epe.2013.54B253 Published Online July 2013 (http://www.scirp.org/journal/epe)
Impact Analysis of Off-board Charger to Power Quality
Yubo Fan, Chunlin Guo, Wenbo Qi, Zheci Tang
State Key Laboratory for Alternate Electrical Power System with Renewable Energy Sources,
North China Electric Power University, Beijing, China
Email: jianhufanyubo@163.com
Received January, 2013
ABSTRACT
In this paper, we tested the entire charging process of a single off-board charger in one charging station in Beijing.
Among the testing data, we chose the typical power quality parameters and compared them with national standard. Then
we drew conclusions as follows: 1) Electric vehicle battery is the capacitive load. It can export reactive power when
charging. 2) In the charging process of the off-board charger, indicators of voltage deviation, frequency deviation, pow-
er factor, and voltage distortion rate are qualified. 3) Off-board charger produces odd harmonics in the charging process,
and with increasing harmonic order, harmonic content reduces. There is a certain amount of high-order harmonic in
off-board charger, mainly distributing around 6650 kHz. 4) Generated harmonics of the actual device, the harmonic is
mainly reflected in the current, voltage, only a small distortion.
Keywords: Electric Vehicles; Charger; Power Quality
1. Introduction
With the development of electric vehicles, charging in-
frastructure also advanced. However, due to the high
power charger for charging stations like switching power
supply, rectifier, inverter, etc, are usually using power
electronic technology, which is a highly non-linear elec-
trical equipment, the large-scale use of it will cause seri-
ous power quality problems on the grid. For example,
harmonic problem, we have known it for a long time.
The flowing harmonic in the grid will result in distortion
of the grid voltage and it also limited the application of
non-linear system.
At present, some scholars have conducted researches
on electric vehicles charging impact on grid, including
research on the impact of the increasing electric vehicles
on medium or low voltage power network. Issues [1-6]
like load, voltage, loss, three-phase unbalance, harm-
onics etc are included.
But these studies only analyzed the minor part of the
charging station about power quality[7-11], there is no
comprehensive analysis about all the indicator of power
quality. Besides, most research results are concluded
from simulation, and they have simplified real operating
system. In this case, we can say that their conclusions are
questionable.
Therefore, based on the testing data of the single
off-board charger charging process, we have system-
atically analyzed the power quality problems including
voltage deviation, frequency deviation, voltage fluctua-
tions and flickers, three-phrase unbalance and harmonics
etc. caused by off-board charger systematically and
drawn conclusions.
2. Power Quality Indicators
2.1. Chinese National Standard Limit
1) Voltage deviation
According to GB/I2325-2008 Power quality-Deviation
of supply voltage, the allowable deviation of three
-phrase supply power that below 20 kV is ±7% of
system rated voltage.
2) Frequency deviation
The nominal frequency of the power system in China
is 50 Hz. According to GB/T15945-1995 Quality of
electric energy supply-Permissible deviation of frequency
for power system, the allowable frequency deviation of
the power system is ±0.2 Hz
3) Voltage fluctuation
According to GB12326-2008 Power quality--Voltage
fluctuation and flicker, the voltage fluctuations of common
connection points ranked 0.38 kv and 10 kv caused by
impact load should below 2%.
*This work is supported by: National High Technology R&D Program
of China (863Program) (2012AA050804).Key Project of the National
Research Program of China (2011BAG02B14), National High Tech-
nology R&D Program of China (863 Program) (2011AA05A109)
4) Three-phrase unbalance
Three-phrase unbalance refers to three-phase voltage
(or current) amplitude is inconsistent and exceed the
Copyright © 2013 SciRes. EPE
Y. B. FAN ET AL.
1338
specified range in the power system. The unbalance fac-
tor expression,
2
1
100%
u
U
U
 (1)
where, U1the R.M.S. of three-phrase voltage positive-
sequence component, V;
U2the R.M.S. of three-phrase voltage negative-se-
quence component, V.
According to GB/T15543-2008 Power quality-Admis-
sible three-phrase voltage unbalance factor, the common
voltage unbalance limit of every user is 1.3%, i.e., the
side normal voltage unbalance of 0.38 kv caused by
charger should below 1.3%.
5) Harmonic voltage
The total ratio of voltage harmonic distortion refers to
the percentage of higher harmonic voltage RMS and the
fundamental voltage RMS. China have set a standard for
allowable values of harmonic voltage of the power
supply.
According to GB/T14549-93 Quality of electric en-
ergy supply-Harmonics in public supply network, the
total harmonic distortion rate limit is 5.0% and 4.0% , the
corresponding harmonic voltage is 0.38 kv and 10 kv.
The following table shows that harmonic voltage in the
in- point should below values in Table 1.
6) Harmonic current
As to public electric network of 0.38 kv, when the ref-
erence short-circuit capacity is 10 MVA, Harmonic cur-
rent permissible value shown in Table 2.
When the reference short-circuit capacity is not 10
MVA, harmonic current allowed values are permitted in
accordance with the size of the actual minimum short-
circuit capacity scaling.
1/
=
hi TI
Ih
hh
(/)
(2)
where, hi
I
means the RMS of each harmonic current
converted; h represents the allowed values of harmonic
current acquired from power system; T means the
minimum short-circuit capacity of single set of devices;
h
I
h means the reference short-circuit capacity of point of
common coupling; represents phase superposition co-
efficients, 's value of each harmonic current shown in
Table 3:
With 0.38 kV electric utility network, grid system
short-circuit capacity of 10 MVA (the benchmark short
circuit capacity), according to GB/T14549—93 quality of
electric energy supply--harmonics in public supply
network, the utility grid injected harmonic current
component (root mean square value) should not exceed
in exemplar 4-2 (harmonic current permissible value of
injected into the common connection point) in the
allowable value (as shown in Table 4).
Since the Test points of 0.4 kV bus at a minimum
short-circuit current of 10 kA, so the minimum short-
circuit capacity of the low-voltage side of the transformer
is [11]:
=30.410=6.928 ()
sc
M
VAS (3)
The actual minimum of short circuit capacity is
6.928
T
SMVA
, Which is use to compute harmonic
finite value of the common points, and from that we got
Table 5.
Table 1. Harmonics voltage limit value in public supply
network ( phrase voltage).
Harmonic Voltage
Ratio%
System Rated
Voltage (KV)
THD Urel to h1
%
Odd Even
0.4 5.0 4.0 2.0
10 4.0 3.2 1.6
Table 2. IEC-3-4 Harmonic current permissible value.
Harmonic Order n 5 7 11 13 17 19
Permissible Harmonic
Current (In/I1)/% 9.5 6.5 3.1 2.0 1.2 1.1
Table 3. 's value of each harmonic current.
Harmonic Order n 5 7 11 13 >13
1.2 1.4 1.8 1.9 2.0
Table 4. Harmonic current permissible value of injected into the point of common coupling.
Harmonic order and harmonic current permissible valueA
Rated Voltage /kV Reference short-circuit
capacity / MVA
2 3 4 5 6 7 8 9 10 11 1213
78 62 39 62 2644 19 21 16 28 13 24
Harmonic order and harmonic current permissible valueA
14 15 16 17 1819 20 21 22 23 24 25
0.38 10
1112 9.7 18 8.6 167.88.9 7.1 14 6.5 12
Copyright © 2013 SciRes. EPE
Y. B. FAN ET AL. 1339
Table 5. Measured limit value of harmonic current.
Harmonic
Order n 3 5 7 11 13 17 19
Harmonic
Current /A 4.03 5.06 5.145.27 4.93 4.003.56
2.2. Standard Comparison between Chinese and
IEC’s
Table 6 shows a comparison of power quality between
national and IEC standards. The table shows that the na-
tional standards allowable values of power quality below
the IEC standard allowable value, so if they meet the
requirements of the national standards of China, they
must meet the IEC standard.
3. Test Description
The test is aimed at a single off-board charger (parameters
in Table 7) whose rated power is 15 kW in an EV
charging station of Beijing. A power quality testing is
carried out through the entire charging process of 8T
sanitation truck battery power (200 AH/96V) in the
charging station.
The three-stage charging method is used in the charg-
ing process of the 8T sanitation truck battery power (200
AH/96V). The first stage is the constant current limit
pressure mode, the charging current I = 60 A, the limit
voltage U = 103 V; the second stage is a constant current
limiting mode, the charging voltage U = 103 V, the limit
current I = 20 A; the third stage is charging stopped, the
charge cut-off current is 0.1C (20 A). The monitor ana-
lyzer of the test is American FLUKE three-phase power
quality analyzer (Model: Fluke1760 Basic). Continuous
recording of three-phase data is on the AC side of
charger for the whole process of charging.
Test point is selected in the AC input side of the
charger; the testing diagram is shown in Figure 1.
Table 6. A comparison of power quality between national and IEC standards.
Power quality indicators Chinese national standard IEC
Voltage deviation the rated voltage is ± 7% of the high-voltage power supply and
low voltage power users of 10 kV and below No standard
Frequency deviation
the allowable value of frequency deviation of power system is ±
0.2 Hz; when the compatible value is larger, the deviation value
can be as large as ± 0.5 Hz
Short-term changes is ± 1 Hz,and the steady-state
is smaller
Voltage harmonics
When the nominal voltage of power grid is 0.38 KV
correspondingly,
Odd harmonic is 4%
Even harmonic is 2%
Total harmonic distortion is 5%
When the nominal voltage of power grid is 10kv, correspond-
ingly , Odd harmonic is 3.2%
Even harmonic is 1.6%
Total harmonic distortion is 4%
Third harmonic 5%
Fifth harmonic 6%
Seventh harmonic 5%
Eleventh harmonic 3.5%
Thirteenth harmonic 3%
Total harmonic distortion 8%
As to very short effect( within 3 s seconds)
compatible level equals to K* the above values,
K=1.3+0.7/45*h-5,THD=11%
Voltage fluctuations and
flickers
The voltage fluctuations are not larger than3% of supply voltage
in common conditions; short term flicker10 minpst=1,long
term flicker2 hplt= 0.8
The voltage fluctuations are not larger than 3% of
the nominal supply voltage;short term flicker10
minpst=1,long term flicker2 hplt =0.8
Three-phrase unbalance
The amissible factor is 2% in points of common coupling in the
common conditions of power system, short time is no longer
than 4%, unbalance factor caused by users is 1.3%
negative-sequence component is 2% of posi-
tive-sequence component, it can reach 3% in
certain place
Table 7. Off-board charger technical parameters.
Heading off-board charger
Technical Specifications HEV-Z-ER125 A/120 V
Input voltage AC380 V±15%
AC input frequency 45-65 Hz
Output voltage DC120VAdjustable
Output current 125 A
Maximum output power 15 kW
Figure 1. Test wiring diagram.
Copyright © 2013 SciRes. EPE
Y. B. FAN ET AL.
1340
4. Test Outcome
1) Startup surge
It takes the charger about 32 seconds from start to the
stage of constant-current limit voltage charging, but great
surge current will be produced in the moment of starting.
The above figure indicates that the current surge pro-
duced by single charger starting is very large: the ampli-
tude can up to 20.3 A. After the chargers are constructed
in large scale, the current surge produced by many
chargers starting at the same time will have very great
impact on the power grid (as shown in Figure 2).
2) Voltage RMS and current RMS
When charger provides normal charging to the power
battery, the voltage measured by power quality analyzer
is 237 V, and the current 9.2 A.
3) Power and power factor
Conclusion: Over 95% of the charging is constant
power charging. Reactive powers of the test points are
negative, indicating the presence of reactive power
backfeed and the capacitive load. The charger is stable,
the power factor when charger stably running is almost 1,
which is in line with the requirements of the relevant
national standards (as shown in Figure 3).
4) Grid frequency deviation
Figure 4 shows the measured grid frequency trends,
and also indicates that the maximum frequency deviation
of charger network side is -0.018, which is within the
allowable value of GB (± 0.2 Hz) and so in line with na-
tional standards.
5) Voltage Deviation
Taking phase A as an example. As can be seen from
Figure 5, the maximum of voltage upper deviation is of
about 4% and that of the voltage lower deviation is zero.
Both of them are less than the limit of 7%. So a single
charger charging will not cause the AC side voltage de-
viation exceeded.
Figure 2. The surge current waveform when charger start-
ing.
(a) Charger input active power curve
(b) Charger input reactive power curve
(c) Charger power factor curve
Figure 3. Power and power factor.
6) Voltage fluctuation
Figure 6 shows the maximum voltage fluctuation
produced by a single charger AC side is 2.4%, which
exceeds the GB limit of 2%. However, the maximum
variation in voltage produced in more than 95% of the
whole charging process is within limits. So the single
charger charging substantially will not cause excessive
voltage fluctuations in the AC side.
Copyright © 2013 SciRes. EPE
Y. B. FAN ET AL. 1341
Figure 4. The charger network side frequency curve.
(a) The voltage upper deviation
(b) The voltage lower deviation
Figure 5. Voltage deviation.
7) Three-phase unbalance
Figure 7 shows that the three-phase voltage unbalance
factor is below 0.4%, far less than the GB 1.3%. So the
three-phase unbalance of charger network side is in line
with the provisions of the relevant national standards.
8) Harmonic voltage
Figure 8(a) is a period of voltage waveform (Urms =
242 V, Irms = 9.86 A) in power stationary phase cap-
tured by the oscilloscope Figure 8 shows that a single
charger running has inconspicuous impact on the net-
work side voltage. THDu is less than 2%, and the odd
harmonics and even harmonics ratios are both no more
than 2%. So the charger network side harmonic voltage
is in line with the provisions of the relevant national stan-
dards.
Figure 6. The charger AC side voltage fluctuations diagram
of the entire charging process.
Figure 7. Time-varying trend of three-phase voltage unbal-
ance factor.
(a) The voltage waveform of charger AC side
Copyright © 2013 SciRes. EPE
Y. B. FAN ET AL.
1342
(b) Charger AC side harmonic voltage spectrum
(c) The total harmonic voltage distortion rate of the completed
charging process
(d) The time-varying trend of the odd harmonic voltage ratio in the
entire charging process
(e) The time-varying trend of the even harmonic voltage
ratio in the entire charging process
Figure 8. Harmonic voltage.
9) Harmonic Current
Figure 9(a) is a period of voltage waveform (Urms =
242 V, Irms = 9.86 A) in power stationary phase cap-
tured by the oscilloscope.
Figure 9 shows that in even harmonics, single charger
generates twice maximum Ih2 sometimes the amplitude
even ups to 0.11 A, which may have some impact on the
grid; In odd harmonics, single charger generates 3 times
minimum harmonic, mainly generating 6 k ± 1 times
harmonic, k = 1,2,3, ..., that is, 5 times, 7 times, 11 times,
13 times, 17 times, 19 times, .... The higher the order, the
smaller the amplitude, wherein the Ih5 maximum, and the
Ih5 second.
(a) Charger AC side current waveform
(b) Charger AC side harmonic current spectrum
(c) Time-varying trend of the even harmonic current content throughout
the charging process
Copyright © 2013 SciRes. EPE
Y. B. FAN ET AL.
Copyright © 2013 SciRes. EPE
1343
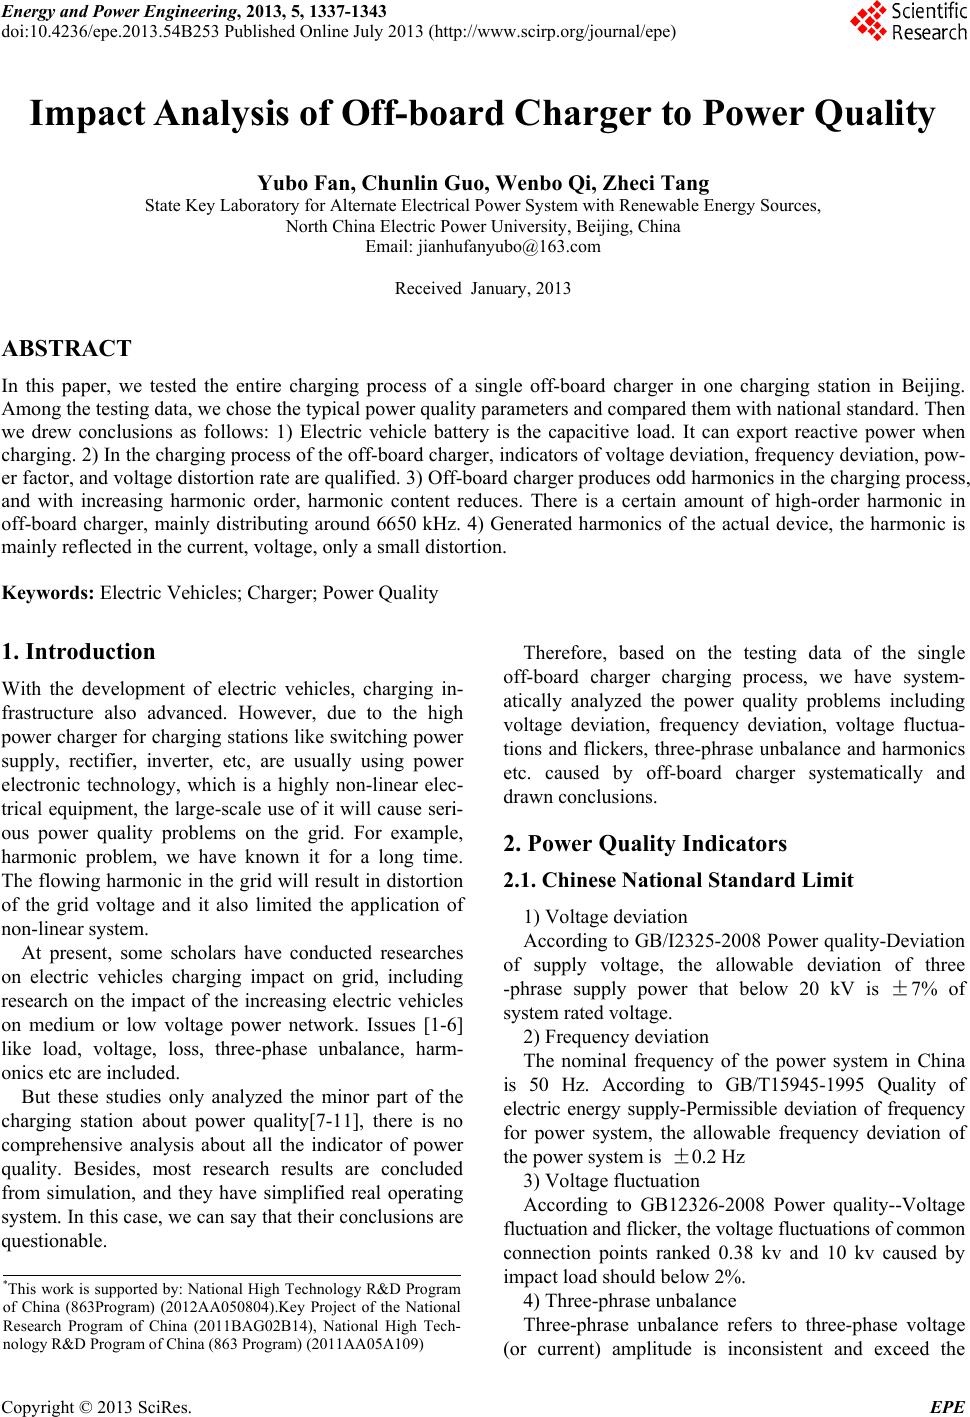
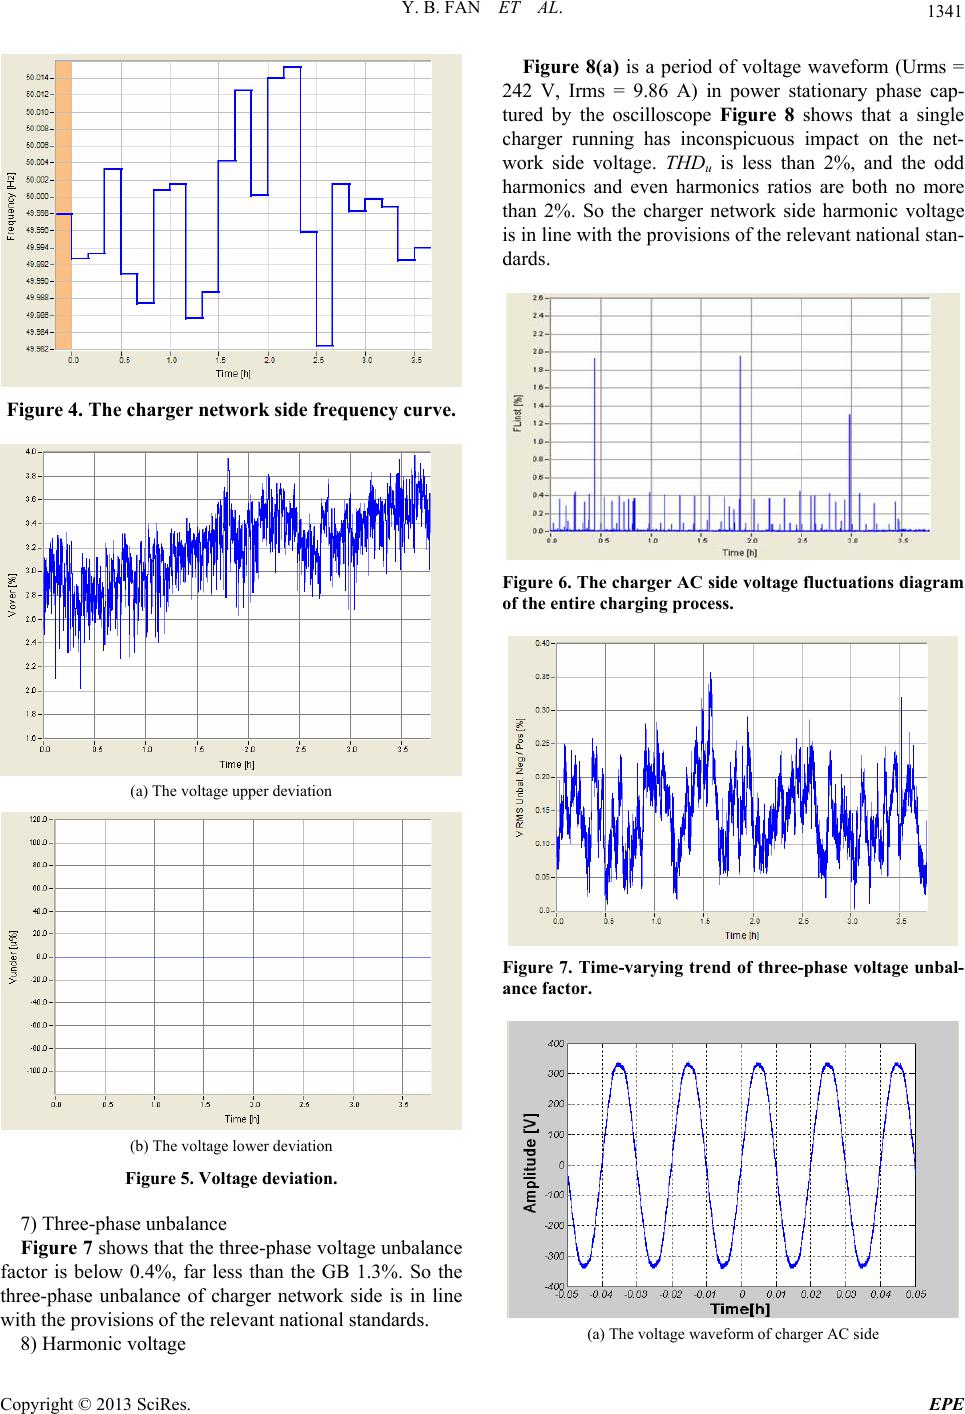
(d) Time-varying trend of the odd harmonic current content
throughout the charging process
Figure 9. Harmonic Current.
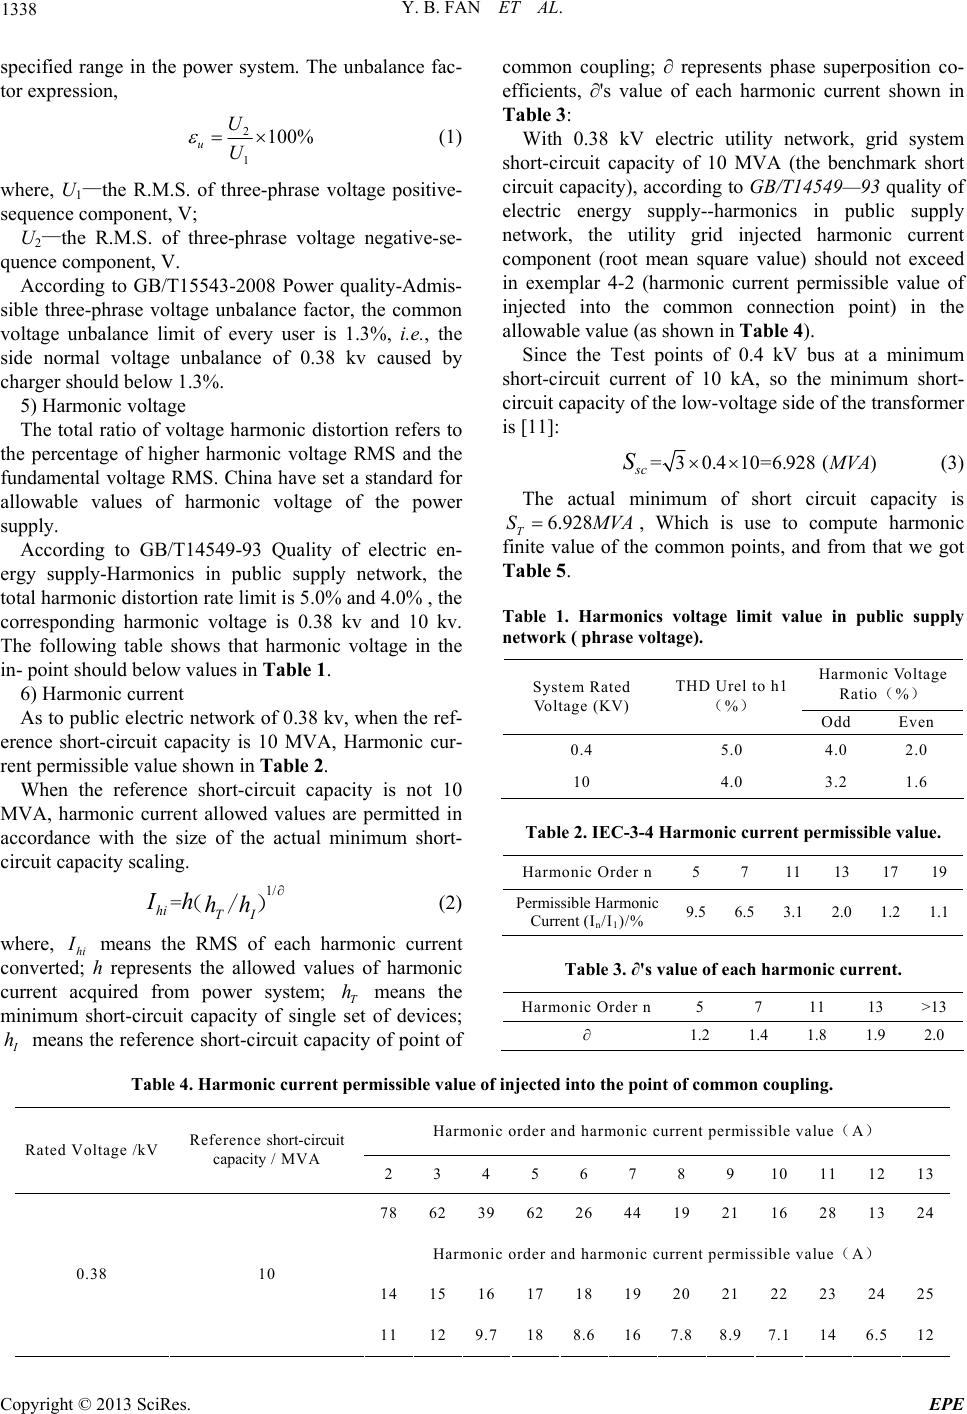
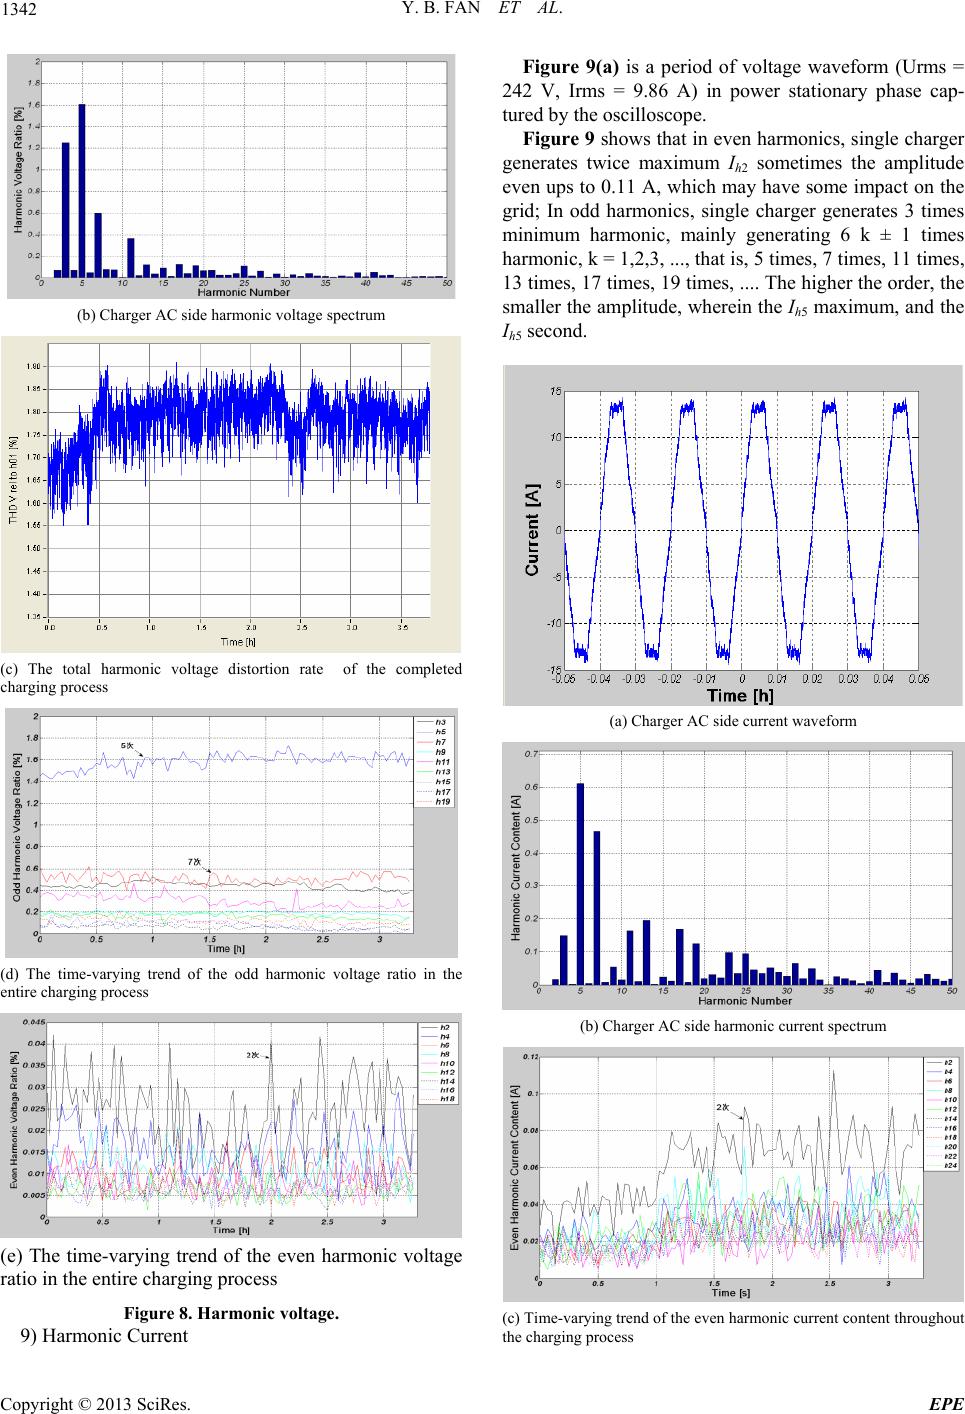
Figure 10. Charger AC side 0-10 kHz current harmonic
spectrum.
10) Higher Harmonic Phenomenon
Conclusion: The preceding analysis shows that the
low-order harmonics of the off-board charger is very low,
which is in line with relevant international standards. But
Figure 10 shows that there is also higher harmonic,
mainly distributing around 6650 kHz
5. Conclusions
After monitoring the charging process of single-board
charger in electric vehicles charging station, and evaluating
the testing results, we can draw conclusions as follows:
1) Electric vehicle battery is the capacitive load. It can
export reactive power when charging.
2) In the charging process of the off-board charger, in-
dicators of voltage deviation, frequency deviation, power
factor, and voltage distortion rate are qualified.
3) Off-board charger produces odd harmonics in the
charging process, and with increasing harmonic order,
harmonic content reduces. There is a certain amount of
high-order harmonic in off-board charger, mainly dis-
tributing around 6650 kHz.
4) Generated harmonics of the actual device, the har-
monic is mainly reflected in the current, voltage, only a
small distortion.
In fact it also shows that in the actual grid operation, to
ensure that the grid power quality standards, vehicle
charging station will consider providing compensation
device and filtering device in associated distribution sys-
tem.
REFERENCES
[1] K. Clement Nyns, E. Haesen and J. Drisen, “The Impact
of Charging Plug-in Hybrid Electric Vehicles on a
Residential Distribution Grid,” IEEE Transaction on
Power System, Vol. 25, No. 1, 2010, pp.
371-380.doi:10.1109/TPWRS.2009.2036481
[2] G. A. Putrus, P. Suwanapingkaral, D. Johnston, et al.,
Impact of Electric Vehicles on Power Distribution
Networks, Proceeding of IEEE Vehicle Power and
Propulsion Conference, September 7-10, 2009, Dearborn,
MI, USA, 827-831.
[3] S. N. Shao, M. Pipattanasomporn and S. Rahman,
“Challenges of PHEV Penetration to the Residential
Distribution Network,” Proceeding of IEEE Power &
Energy Society General Meeting, Calgary, Canada, July
26-30, 2009.
[4] J. Taylor, A. Maitra, M. Alexander, et al., “Evaluation of
the Impact of Plug-in Electric Vehicle Loading on
Distribution System Operation,”Proceeding of IEEE
Power & Energy Society General Meeting, Calgary,
Canada, July 26-30, 2009.
[5] C. Roe, F. Evanelos, J. Melsel, et al., “Power System
Level Impacts of PHEVs,” Proceeding of the 42nd Hawaii
International Conference on System Sciences,Hawaii,
HI,USA, January 5-8, 2008.
[6] M. Basu, K. Gaughan and E. Coyle, “Harmonic
Distortion Caused by PHEV Battery Chargers in the
Distribution Systems Network and Its Remedy,”
Proceeding of the 39th International University Power
Engineering Conference,Bristol, UK, September 6-8,
2004.
[7] M. Y. Xu, X. H. Mu, H. Zhang, Y. He, M. J. Zhang and
X. G. Chen, “Analysis of the Influence the Electrical
Vehicle Charging Station to the Grid Harmonics,”
Heilongjiang Electric Power, No. 1, 2012.
[8] L. L. Ma and J. Q. Zhang, “Study on Electric Vehicle
Charging Device Model Based on PSCAD and Harmonic
Analysis,” Shanxi Electric Power, Vol. 7, 2012, pp.
28-32.
[9] M. Huang, S. F. Huang and J. C. Jiang, “Harmonic Study
of Electric Vehicle Chargers,” Journal of Beijing
Jiaotong University, Vol. 5, 2008.
[10] Q. Zhang, W. J. Han, J. H. Yu, C. Y. Li and L. F. Shi,
“Simulation Model of Electric Vehicle Charging Station
and the Harmonic Analysis on Power Grid,” Transactions
of China Electrotechnical Society, Vol. 2, 2012.
[11] Q. Liu, “Charging Modes of Electric Vehicle and the
Impact Analysis of Charging Station to Power Quality on
Power Grid,” China High-Tech Enterprises, Vol. 27,
2011.