Paper Menu >>
Journal Menu >>
 Energy and Power Engineering, 2013, 5, 1235-1239 doi:10.4236/epe.2013.54B234 Published Online July 2013 (http://www.scirp.org/journal/epe) Effects of Harmonics on Power Loss in XLPE Cables W. Z. Gandhare1, K. D. Patil2 1Principal, Governme nt College of Engineering Amravati, India 2Research Scholar, Government College of Engineering Aurangabad, India Email: wz_gandhare@yahoo.co.in, kesharsingp@rediffmail.com Received February, 2013 ABSTRACT Harmonics in power systems is increasingly at high level. Also, there has been an incredible growth in the use of cross linked polyethylene (XLPE) cables in distribution systems. Harmonics cause additional power loss/temperature rise; causing premature failure of cables. Catastrophic failure of power cables leads to great inconvenience to consumers and loss of system reliability and money. To avoid the overheating of power cables; the additional power loss due to har- monics should be accurately calculated and properly accommodated by derating the cable. The present method of cal- culating the power loss in cables in harmonics rich environment is very arduou s. The aim of this paper is to present the reasonably accurate method for evaluating effects of harmonics on the power loss in XLPE cables. Computational mod- el is developed in MATLAB for power loss calculation using conventional method. Using this model, calculations are performed for aluminium and copper conductor XLPE cables of different size and type; for three different types of harmonics spectrums having total harmonics distortion (THD) of 30.68%, including all odd harmonics components up to 49th order. Using these results; a mathematical model in the form of simple empirical formula is developed by curve fitting technique. The results obtained b y various models are presented and compared with error justification. Keywords: Curve Fitting; Non-sinusoidal Power Lo ss; Per Unit Harmonic Load; Quadratic Polynomial; Sinusoidal Power Loss 1. Introduction The increased use of nonlinear loads in all sectors has resulted in increasingly high level of harmonics, espe- cially, in the distribution systems. In the recent years, due to number of technical and commercial reasons, there has been a remarkable growth in the use of XLPE cables in underground power distribution systems. Thus, the har- monics problem and the use of XLPE cables in power systems are growing simultaneously. Harmonics in dis- tribution systems causes additional power loss and hence additional heat/temperature rise. This additional heat produced because of harmonics is of less significance in bare conductor overhead lines, but it is very significant in power cables. This is because power cables are much more vulnerable to temperature rise as compared to overhead lines. Catastrophic failures of XLPE cables cause inconven- ience to consumers and tremendous loss in terms of sys- tem reliability, time and money. To avoid the overheat- ing of XLPE cables; the additional power loss due to harmonics should be accurately calculated and properly accommodated by derating the cable. The conventional method of calculating power loss in cables in harmonics rich environment is very arduous. The aim of this paper is to present reasonably accurate method for evaluating effects of harmonics on the power loss in XLPE cables. Computational model is developed in MATLAB for power loss calculation using conven- tional method. Using this model, calculations are per- formed for aluminium and copper conductor XLPE ca- bles of different size and type; for three different types of harmonics spectrums having total harmonics distortion (THD) of 30.68%, including all odd harmonics compo- nents up to 49th order. Using these results; a mathemati- cal model in the form of simple empirical formula is de- veloped by iterative curve fitting technique. The results obtained by both the models are presented and compared with the proper justificatio n for errors. Practical example is given to emphasize the proposed approach. 2. Harmonics and XLPE Power Cables Data 2.1. Harmonics Data The harmonic distortion level in distribution systems in residential, commercial and industrial areas is above its tolerable limits as per IEEE std. 519-1992 [1]. However; the harmonics spectrums for these three types of loads are not same but they certainly have some characteristic features. Due to the large percentage of single phase non- Copyright © 2013 SciRes. EPE 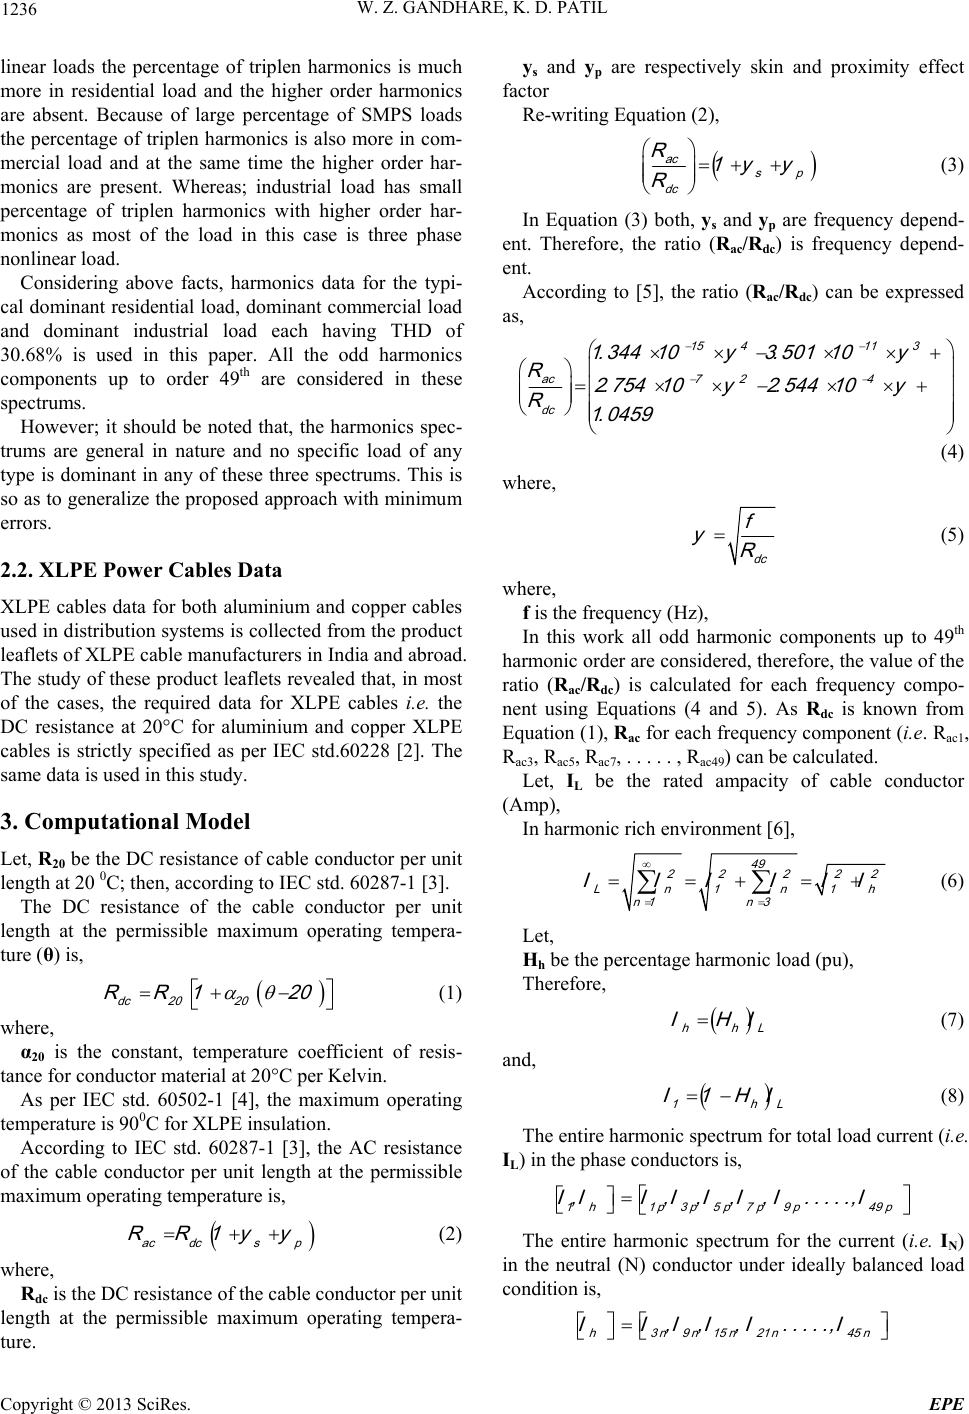 W. Z. GANDHARE, K. D. PATIL 1236 linear loads the percentage of triplen harmonics is much more in residential load and the higher order harmonics are absent. Because of large percentage of SMPS loads the percentage of triplen harmonics is also more in com- mercial load and at the same time the higher order har- monics are present. Whereas; industrial load has small percentage of triplen harmonics with higher order har- monics as most of the load in this case is three phase nonlinear load. Considering above facts, harmonics data for the typi- cal dominant residential lo ad, dominant commercial load and dominant industrial load each having THD of 30.68% is used in this paper. All the odd harmonics components up to order 49th are considered in these spectrums. However; it should be noted that, the harmonics spec- trums are general in nature and no specific load of any type is dominant in any of these three spectrums. This is so as to generalize the proposed approach with minimum errors. 2.2. XLPE Power Cables Data XLPE cables data for both aluminium and copper cables used in distribution systems is collected from the product leaflets of XLPE cable manufacturers in India and abroad. The study of these product leaflets revealed that, in most of the cases, the required data for XLPE cables i.e. the DC resistance at 20°C for aluminium and copper XLPE cables is strictly specified as per IEC std.60228 [2]. The same data is used in this study. 3. Computational Model Let, R20 be the DC resistance of cable conductor per unit length at 20 0C; then, according to IEC std. 60287-1 [3]. The DC resistance of the cable conductor per unit length at the permissible maximum operating tempera- ture (θ) is, (1) where, α20 is the constant, temperature coefficient of resis- tance for conductor material at 20°C per Kelvin. As per IEC std. 60502-1 [4], the maximum operating temperature is 900C for XLPE insulation. According to IEC std. 60287-1 [3], the AC resistance of the cable conductor per unit length at the permissible maximum operating temperature is, (2) where, Rdc is the DC resistance of the cable conductor per unit length at the permissible maximum operating tempera- ture. ys and yp are respectively skin and proximity effect factor Re-writing Equation (2 ), (3) In Equation (3) both, ys and yp are frequency depend- ent. Therefore, the ratio (Rac/Rdc) is frequency depend- ent. According to [5], the ratio (Rac/Rdc) can be expressed as, (4) where, (5) where, f is the frequency (Hz), In this work all odd harmonic components up to 49th harmonic order are considered, therefore, the value of the ratio (Rac/Rdc) is calculated for each frequency compo- nent using Equations (4 and 5). As Rdc is known from Equation (1), Rac for each frequency component (i.e. Rac1, Rac3, Rac5, Rac7, . . . . . , Rac49) can be calculated. Let, IL be the rated ampacity of cable conductor (Amp), In harmonic rich environment [6], (6) Let, Hh be the percentage harmonic load (pu), Therefore, (7) and, (8) The entire harmonic spectrum for total load current (i.e. IL) in the phase conductors is, The entire harmonic spectrum for the current (i.e. IN) in the neutral (N) conductor under ideally balanced load condition is, Copyright © 2013 SciRes. EPE 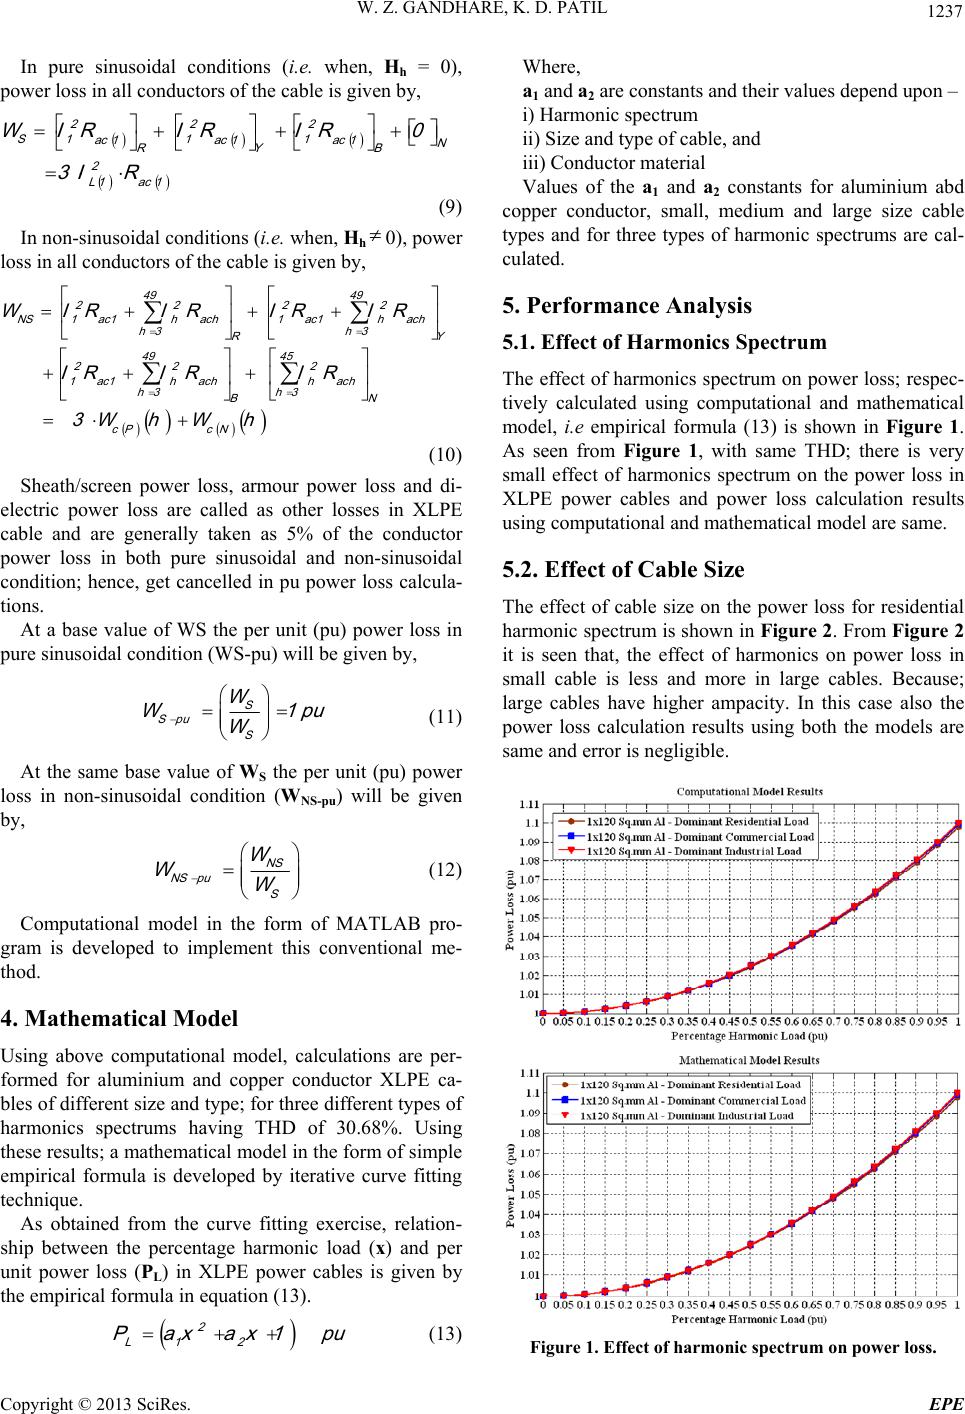 W. Z. GANDHARE, K. D. PATIL 1237 In pure sinusoidal conditions (i.e. when, Hh = 0), power loss in all conductors of the cable is given by, (9) In non-sinusoid al conditions (i.e. wh en , Hh0), pow er loss in all conductors of the cable is given by, (10) Sheath/screen power loss, armour power loss and di- electric power loss are called as other losses in XLPE cable and are generally taken as 5% of the conductor power loss in both pure sinusoidal and non-sinusoidal condition; hence, get cancelled in pu power loss calcula- tions. At a base value of WS the per unit (pu) power loss in pure sinusoidal condition (WS-pu) will be given by, (11) At the same base value of WS the per unit (pu) power loss in non-sinusoidal condition (WNS-pu) will be given by, (12) Computational model in the form of MATLAB pro- gram is developed to implement this conventional me- thod. 4. Mathematical Model Using above computational model, calculations are per- formed for aluminium and copper conductor XLPE ca- bles of different size and type; for three different types of harmonics spectrums having THD of 30.68%. Using these results; a mathematical model in th e form of simple empirical formula is developed by iterative curve fitting technique. As obtained from the curve fitting exercise, relation- ship between the percentage harmonic load (x) and per unit power loss (PL) in XLPE power cables is given by the empirical formula in equation (13). (13) Where, a1 and a2 are constants and their values depend upon – i) Harmonic spectrum ii) Size and type of cable, and iii) Conductor material Values of the a1 and a2 constants for aluminium abd copper conductor, small, medium and large size cable types and for three types of harmonic spectrums are cal- culated. 5. Performance Analysis 5.1. Effect of Harmonics Spectrum The effect of harmonics spectrum on power loss; respec- tively calculated using computational and mathematical model, i.e empirical formula (13) is shown in Figure 1. As seen from Figure 1, with same THD; there is very small effect of harmonics spectrum on the power loss in XLPE power cables and power loss calculation results using computational and mathematical model are same. 5.2. Effect of Cable Size The effect of cable size on the power loss for residential harmonic spectrum is shown in Figure 2. From Figure 2 it is seen that, the effect of harmonics on power loss in small cable is less and more in large cables. Because; large cables have higher ampacity. In this case also the power loss calculation results using both the models are same and error is negligible. Figure 1. Effect of harmonic spectrum on power loss. Copyright © 2013 SciRes. EPE 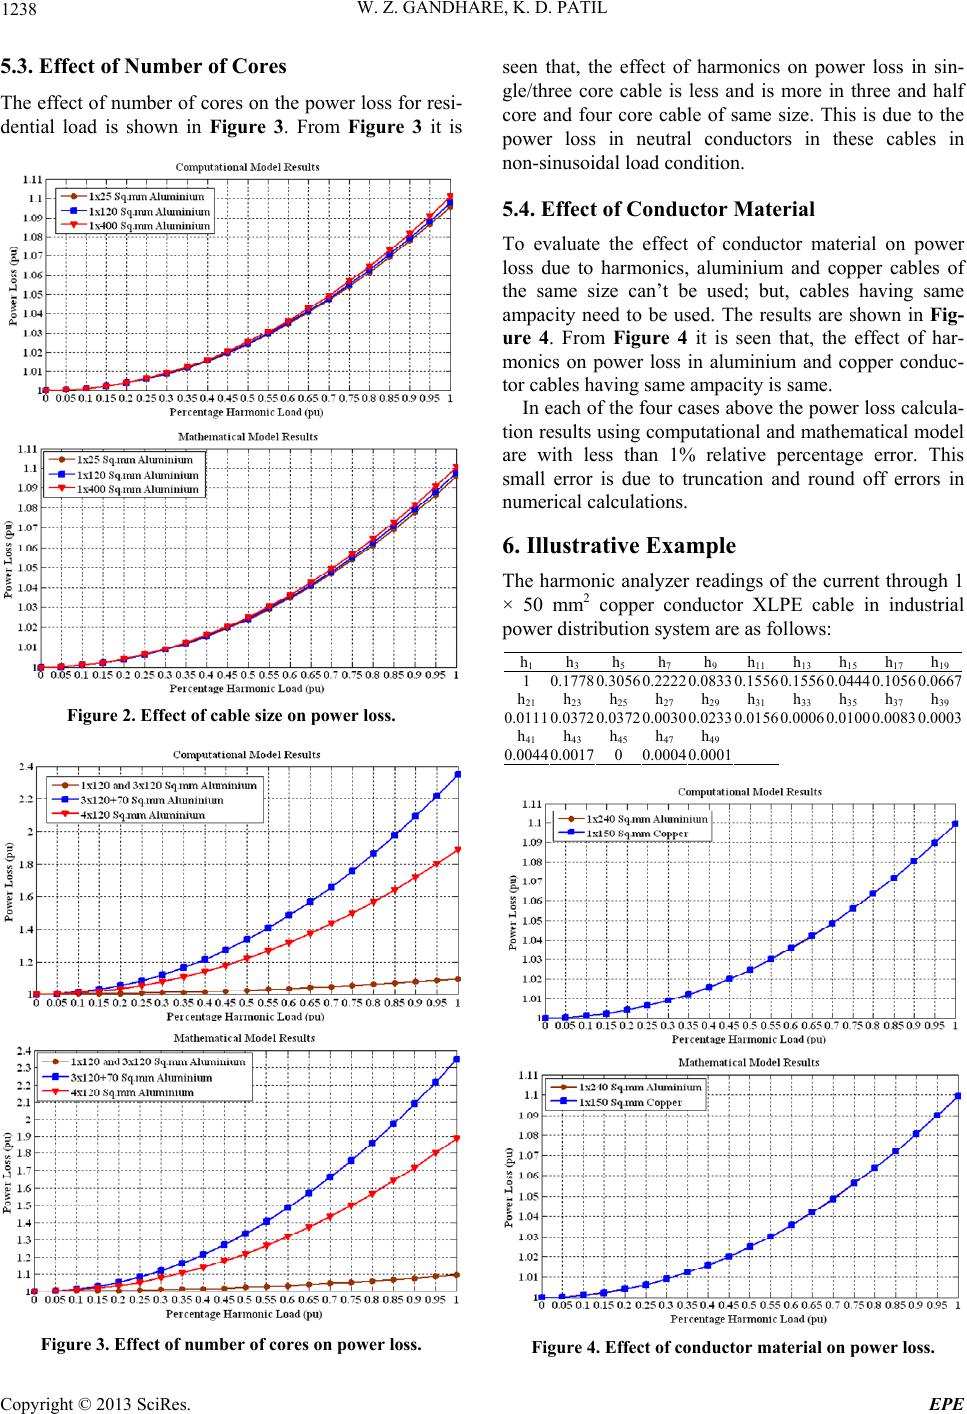 W. Z. GANDHARE, K. D. PATIL 1238 5.3. Effect of Number of Cores The effect of number of cores on the power loss for r esi- dential load is shown in Figure 3. From Figure 3 it is Figure 2. Effect of cable size on power loss. Figure 3. Effect of number of cores on power loss. seen that, the effect of harmonics on power loss in sin- gle/three core cable is less and is more in three and half core and four core cable of same size. This is due to the power loss in neutral conductors in these cables in non-sinusoidal load condition. 5.4. Effect of Conductor Material To evaluate the effect of conductor material on power loss due to harmonics, aluminium and copper cables of the same size can’t be used; but, cables having same ampacity need to be used. The results are shown in Fig- ure 4. From Figure 4 it is seen that, the effect of har- monics on power loss in aluminium and copper conduc- tor cables having same ampacity is same. In each of the four cases above the power loss calcula- tion results using co mputational and mathematical mod el are with less than 1% relative percentage error. This small error is due to truncation and round off errors in numerical calculations. 6. Illustrative Example The harmonic analyzer readings of the current through 1 × 50 mm2 copper conductor XLPE cable in industrial power distri b uti on sy st em are as follows: h1 h 3 h 5 h 7 h 9 h 11 h 13 h 15 h 17 h19 1 0.17780.30560.22220.0833 0.1556 0.1556 0.04440.10560.0667 h21 h23 h25 h27 h29 h31 h 33 h 35 h 37 h39 0.01110.03720.03720.00300.0233 0.0156 0.0006 0.01000.00830.0003 h41 h43 h45 h47 h49 0.00440.00170 0.00040.0001 Figure 4. Effect of conductor material on power loss. Copyright © 2013 SciRes. EPE 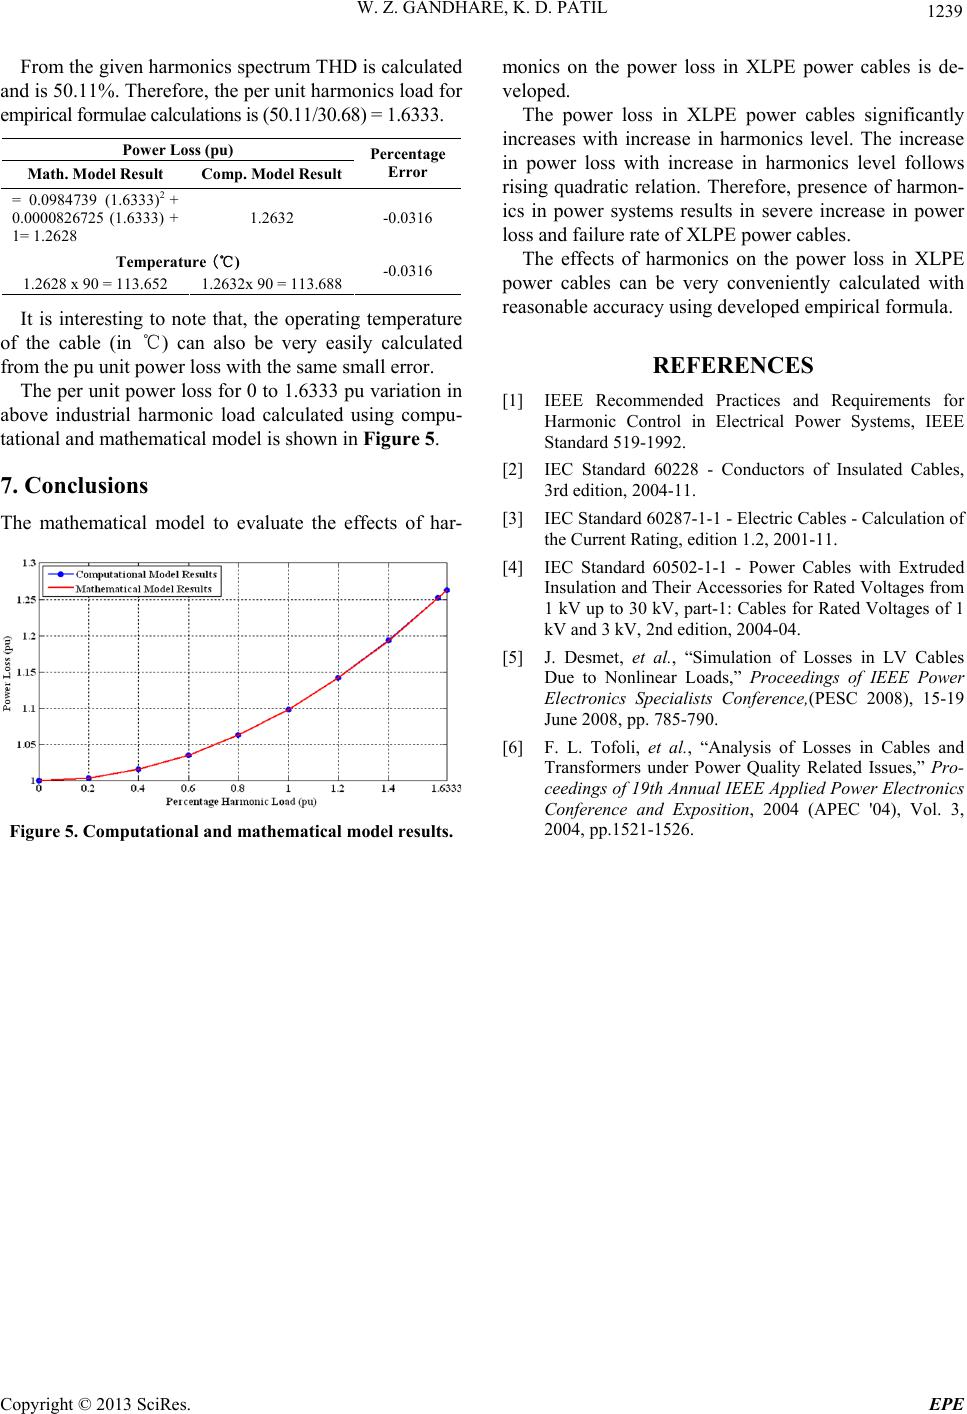 W. Z. GANDHARE, K. D. PATIL Copyright © 2013 SciRes. EPE 1239 monics on the power loss in XLPE power cables is de- veloped. From the given harmonics spectrum THD is calculated and is 50.11%. Therefore, the per unit harmonics load for empirical formulae calculations is (50.11/30.68) = 1.6333. Power Loss (pu) Math. Model Result Comp. Model Result Percentage Error = 0.0984739 (1.6333)2 + 0.0000826725 (1.6333) + 1= 1.2628 1.2632 -0.0316 Temperature (℃) 1.2628 x 90 = 113. 652 1.2632x 90 = 113.6 88 -0.0316 The power loss in XLPE power cables significantly increases with increase in harmonics level. The increase in power loss with increase in harmonics level follows rising quadratic relation. Therefore, presence of harmon- ics in power systems results in severe increase in power loss and failure rate of XLPE power cables. The effects of harmonics on the power loss in XLPE power cables can be very conveniently calculated with reasonable accuracy using developed empirical formula. It is interesting to note that, the operating temperature of the cable (in ℃) can also be very easily calculated from the pu unit power loss with the same small error. REFERENCES The per unit power loss fo r 0 to 1.6333 pu variation in above industrial harmonic load calculated using compu- tational and mathematical model is shown in Figure 5. [1] IEEE Recommended Practices and Requirements for Harmonic Control in Electrical Power Systems, IEEE Standard 519-1992. [2] IEC Standard 60228 - Conductors of Insulated Cables, 3rd edition, 2004-11. 7. Conclusions [3] IEC Standard 60287-1-1 - Electric Cables - Calculation of the Current Rating, edition 1.2, 2001-11. The mathematical model to evaluate the effects of har- [4] IEC Standard 60502-1-1 - Power Cables with Extruded Insulation and Their Accessories for Rated Voltages from 1 kV up to 30 kV, part-1: Cables for Rated Voltages of 1 kV and 3 kV, 2nd edition, 2004-04. [5] J. Desmet, et al., “Simulation of Losses in LV Cables Due to Nonlinear Loads,” Proceedings of IEEE Power Electronics Specialists Conference,(PESC 2008), 15-19 June 2008, pp. 785-790. [6] F. L. Tofoli, et al., “Analysis of Losses in Cables and Transformers under Power Quality Related Issues,” Pro- ceedings of 19th Annual IEEE Applied Power Electronics Conference and Exposition, 2004 (APEC '04), Vol. 3, 2004, pp.1521-1526. Figure 5. Computational and mathematical model results. |