Paper Menu >>
Journal Menu >>
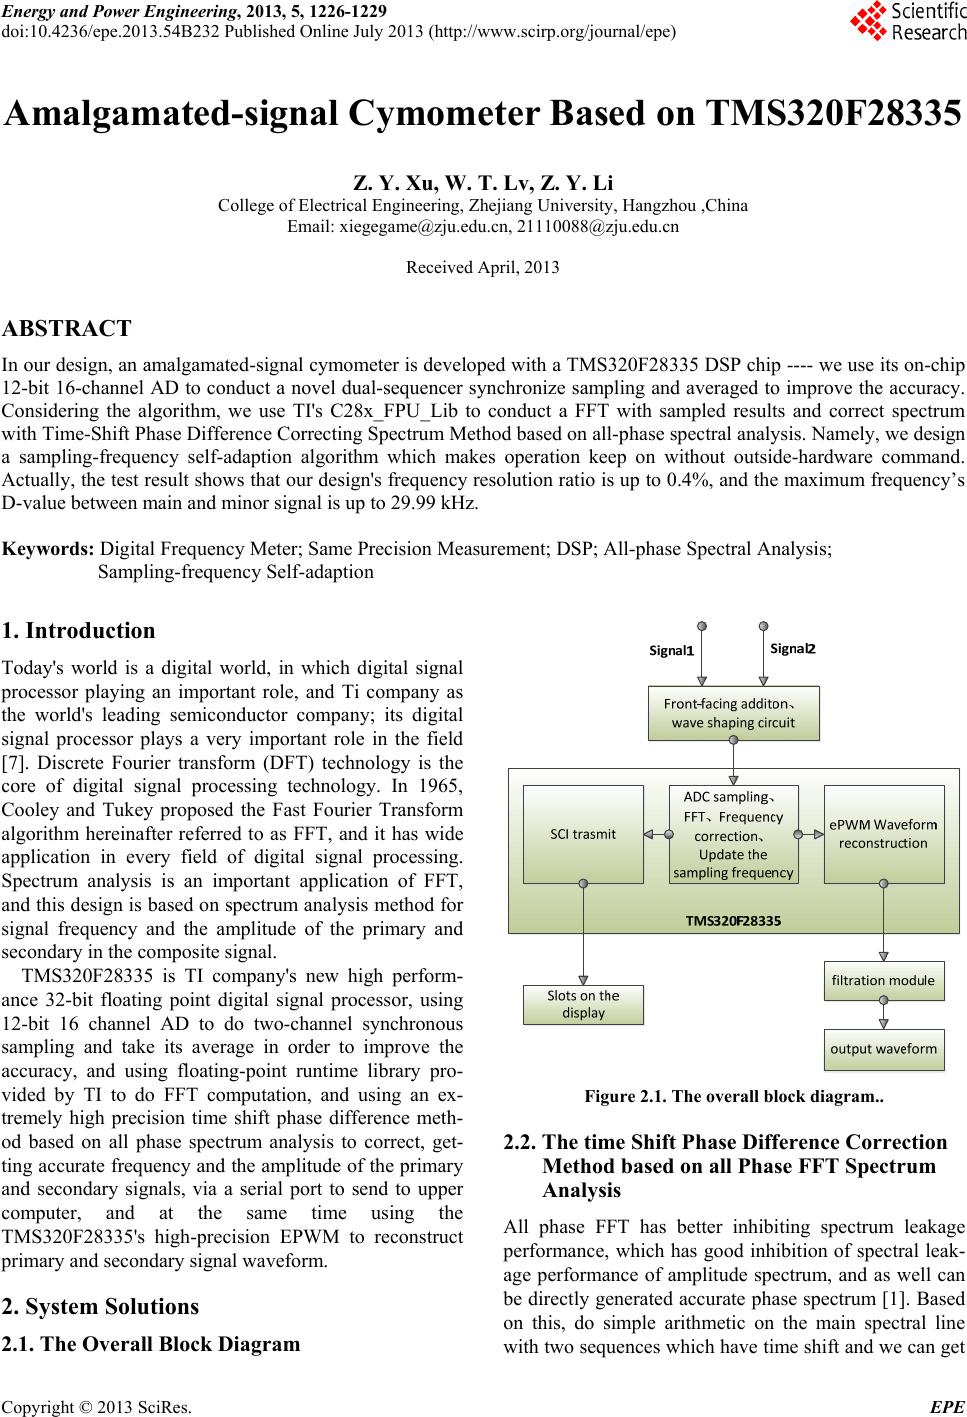 Energy and Power Engineering, 2013, 5, 1226-1229 doi:10.4236/epe.2013.54B232 Published Online July 2013 (http://www.scirp.org/journal/epe) Amalgamated-signal Cymometer Based on TMS320F28335 Z. Y. Xu, W. T. Lv, Z. Y. Li College of Electrical Engineering, Zhejiang University, Hangzhou ,China Email: xiegegame@zju.edu.cn, 21110088@zju.edu.cn Received April, 2013 ABSTRACT In our design, an amalgamated-signal cymometer is developed with a TMS320F28335 DSP chip ---- we use its on-chip 12-bit 16-channel AD to conduct a novel dual-sequencer synchronize sampling and averaged to improve the accuracy. Considering the algorithm, we use TI's C28x_FPU_Lib to conduct a FFT with sampled results and correct spectrum with Time-Shift Phase Difference Correcting Spectrum Method based on all-phase spectral analysis. Namely, we design a sampling-frequency self-adaption algorithm which makes operation keep on without outside-hardware command. Actually, the test result shows that our design's frequency resolution ratio is up to 0.4%, and the maximum frequency’s D-value between main and minor signal is up to 29.99 kHz. Keywords: Digital Frequency Meter; Same Precision Measurement; DSP; All-phase Spectral Analysis; Sampling-frequency Self-adaption 1. Introduction Today's world is a digital world, in which digital signal processor playing an important role, and Ti company as the world's leading semiconductor company; its digital signal processor plays a very important role in the field [7]. Discrete Fourier transform (DFT) technology is the core of digital signal processing technology. In 1965, Cooley and Tukey proposed the Fast Fourier Transform algorithm hereinafter referred to as FFT, and it has wide application in every field of digital signal processing. Spectrum analysis is an important application of FFT, and this design is based on spectrum analysis method for signal frequency and the amplitude of the primary and secondary in the composite signal. TMS320F28335 is TI company's new high perform- ance 32-bit floating point digital signal processor, using 12-bit 16 channel AD to do two-channel synchronous sampling and take its average in order to improve the accuracy, and using floating-point runtime library pro- vided by TI to do FFT computation, and using an ex- tremely high precision time shift phase difference meth- od based on all phase spectrum analysis to correct, get- ting accurate frequency and the amplitude of the primary and secondary signals, via a serial port to send to upper computer, and at the same time using the TMS320F28335's high-precision EPWM to reconstruct primary and secondary signal waveform. 2. System Solutions 2.1. The Overall Block Diagram Figure 2.1. The overall block diagram.. 2.2. The time Shift Phase Difference Correction Method based on all Phase FFT Spectrum Analysis All phase FFT has better inhibiting spectrum leakage performance, which has good inhibition of spectral leak- age performance of amplitude spectrum, and as well can be directly generated accurate phase spectrum [1]. Based on this, do simple arithmetic on the main spectral line with two sequences which have time shift and we can get Copyright © 2013 SciRes. EPE 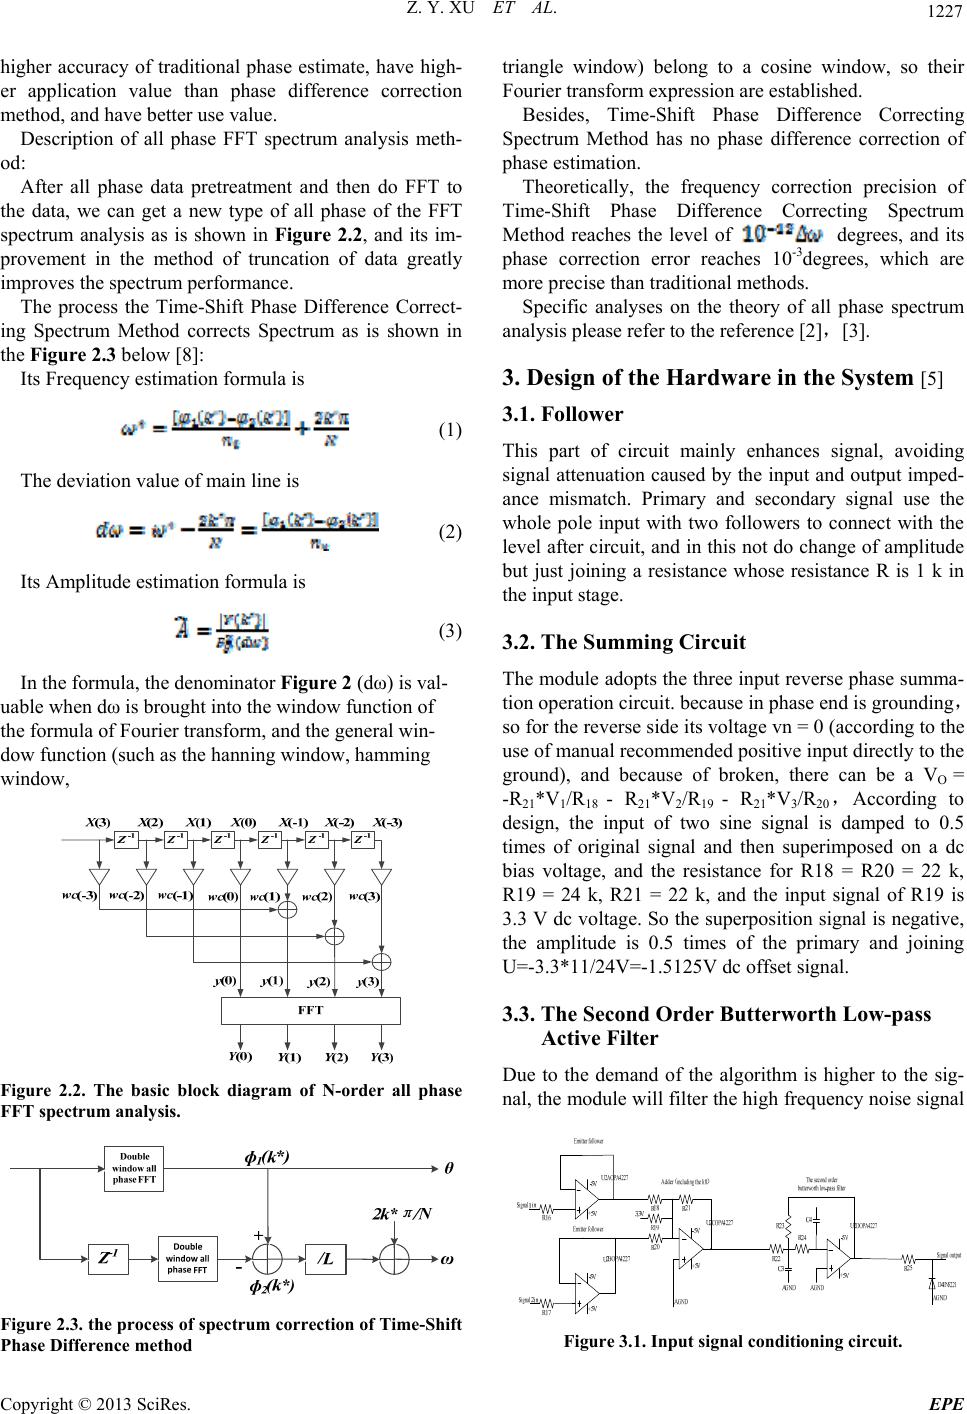 Z. Y. XU ET AL. 1227 higher accuracy of traditional phase estimate, have high- er application value than phase difference correction method, and have better use value. Description of all phase FFT spectrum analysis meth- od: After all phase data pretreatment and then do FFT to the data, we can get a new type of all phase of the FFT spectrum analysis as is shown in Figure 2.2, and its im- provement in the method of truncation of data greatly improves the spectrum performance. The process the Time-Shift Phase Difference Correct- ing Spectrum Method corrects Spectrum as is shown in the Figure 2.3 below [8]: Its Frequency estimation formula is (1) The deviation value of main line is (2) Its Amplitude estimation formula is (3) In the formula, the denominator Figure 2 (dω) is val- uable when dω is brought into the window function of the formula of Fourier transform, and the general win- dow function (such as the hanning window, hamming window, Figure 2.2. The basic block diagram of N-order all phase FFT spectrum analysis. Figure 2.3. the process of spectrum correction of Time-Shift Phase Difference method triangle window) belong to a cosine window, so their Fourier transform expression are established. Besides, Time-Shift Phase Difference Correcting Spectrum Method has no phase difference correction of phase estimation. Theoretically, the frequency correction precision of Time-Shift Phase Difference Correcting Spectrum Method reaches the level of degrees, and its phase correction error reaches 10-3degrees, which are more precise than traditional methods. Specific analyses on the theory of all phase spectrum analysis please refer to the reference [2],[3]. 3. Design of the Hardware in the System [5] 3.1. Follower This part of circuit mainly enhances signal, avoiding signal attenuation caused by the input and output imped- ance mismatch. Primary and secondary signal use the whole pole input with two followers to connect with the level after circuit, and in this not do change of amplitude but just joining a resistance whose resistance R is 1 k in the input stage. 3.2. The Summing Circuit The module adopts the three input reverse phase summa- tion operation circuit. because in phase end is grounding, so for the reverse side its voltage vn = 0 (according to the use of manual recommended positive input directly to the ground), and because of broken, there can be a VO = -R21*V1/R18 - R21*V2/R19 - R21*V3/R20 ,According to design, the input of two sine signal is damped to 0.5 times of original signal and then superimposed on a dc bias voltage, and the resistance for R18 = R20 = 22 k, R19 = 24 k, R21 = 22 k, and the input signal of R19 is 3.3 V dc voltage. So the superposition signal is negative, the amplitude is 0.5 times of the primary and joining U=-3.3*11/24V=-1.5125V dc offset signal. 3.3. The Second Order Butterworth Low-pass Active Filter Due to the demand of the algorithm is higher to the sig- nal, the module will filter the high frequency noise signal Figure 3.1. Input signal conditioning ci rc uit. Copyright © 2013 SciRes. EPE 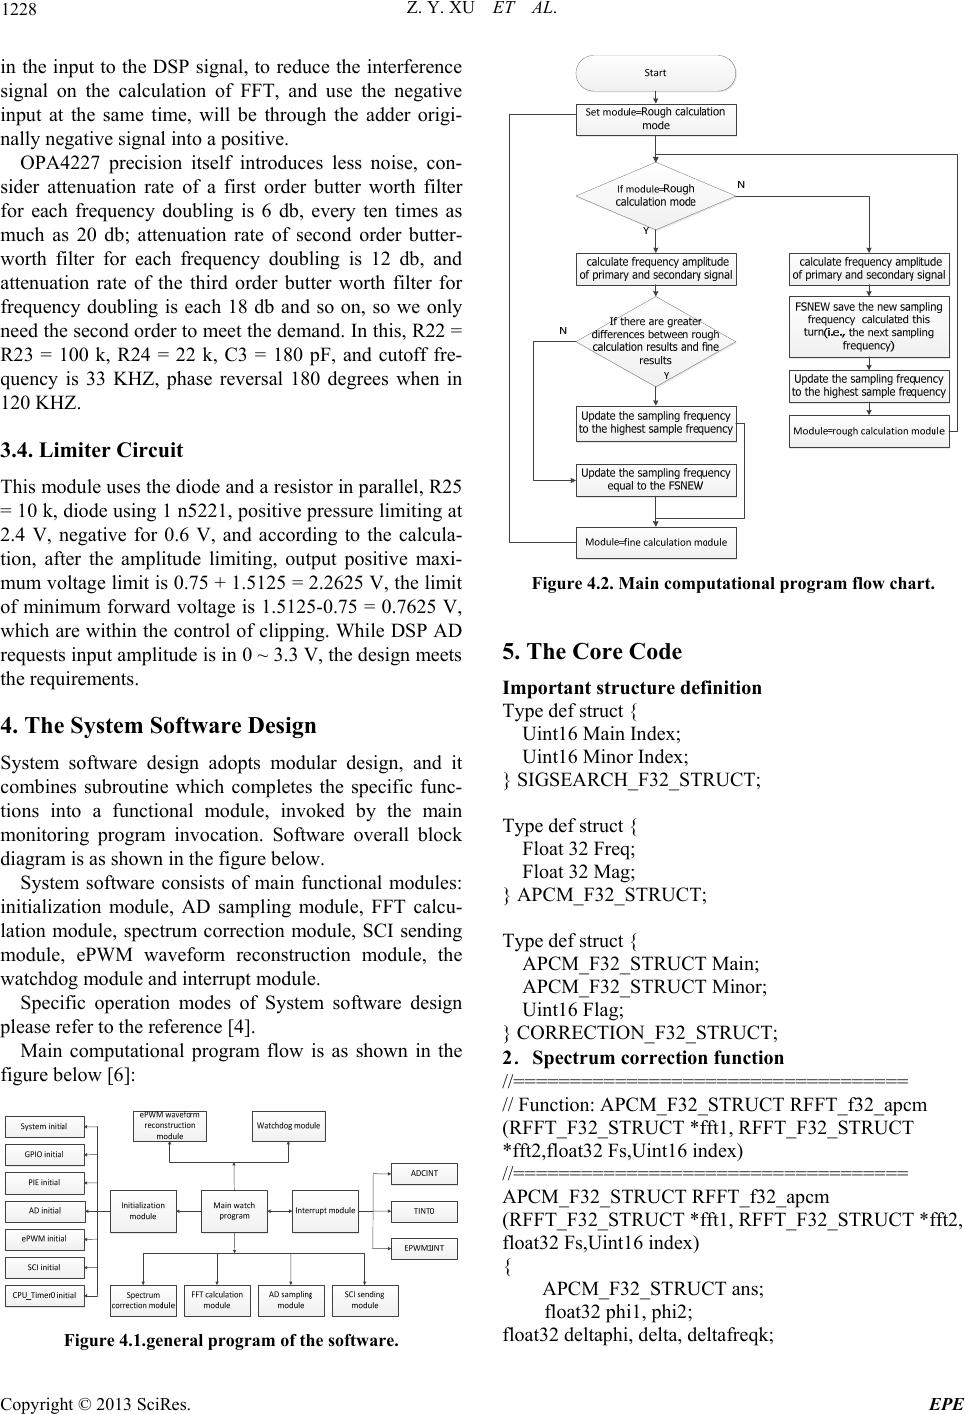 Z. Y. XU ET AL. 1228 in the input to the DSP signal, to reduce the interference signal on the calculation of FFT, and use the negative input at the same time, will be through the adder origi- nally negative signal into a positive. OPA4227 precision itself introduces less noise, con- sider attenuation rate of a first order butter worth filter for each frequency doubling is 6 db, every ten times as much as 20 db; attenuation rate of second order butter- worth filter for each frequency doubling is 12 db, and attenuation rate of the third order butter worth filter for frequency doubling is each 18 db and so on, so we only need the second order to meet the demand. In this, R22 = R23 = 100 k, R24 = 22 k, C3 = 180 pF, and cutoff fre- quency is 33 KHZ, phase reversal 180 degrees when in 120 KHZ. 3.4. Limiter Circuit This module uses the diode and a resistor in parallel, R25 = 10 k, diode using 1 n5221, positive pressure limiting at 2.4 V, negative for 0.6 V, and according to the calcula- tion, after the amplitude limiting, output positive maxi- mum voltage limit is 0.75 + 1.5125 = 2.2625 V, the limit of minimum forward voltage is 1.5125-0.75 = 0.7625 V, which are within the control of clipping. While DSP AD requests input amplitude is in 0 ~ 3.3 V, the design meets the requirements. 4. The System Software Design System software design adopts modular design, and it combines subroutine which completes the specific func- tions into a functional module, invoked by the main monitoring program invocation. Software overall block diagram is as shown in the figure below. System software consists of main functional modules: initialization module, AD sampling module, FFT calcu- lation module, spectrum correction module, SCI sending module, ePWM waveform reconstruction module, the watchdog module and interrupt module. Specific operation modes of System software design please refer to the reference [4]. Main computational program flow is as shown in the figure below [6]: Figure 4.1.general program of the software. Figure 4.2. Main computational program flow chart. 5. The Core Code Important structure definition Type def struct { Uint16 Main Index; Uint16 Minor Index; } SIGSEARCH_F32_STRUCT; Type def struct { Float 32 Freq; Float 32 Mag; } APCM_F32_STRUCT; Type def struct { APCM_F32_STRUCT Main; APCM_F32_STRUCT Minor; Uint16 Flag; } CORRECTION_F32_STRUCT; 2.Spectrum correction function //=================================== // Function: APCM_F32_STRUCT RFFT_f32_apcm (RFFT_F32_STRUCT *fft1, RFFT_F32_STRUCT *fft2,float32 Fs,Uint16 index) //=================================== APCM_F32_STRUCT RFFT_f32_apcm (RFFT_F32_STRUCT *fft1, RFFT_F32_STRUCT *fft2, float32 Fs,Uint16 index) { APCM_F32_STRUCT ans; float32 phi1, phi2; float32 deltaphi, delta, deltafreqk; Copyright © 2013 SciRes. EPE 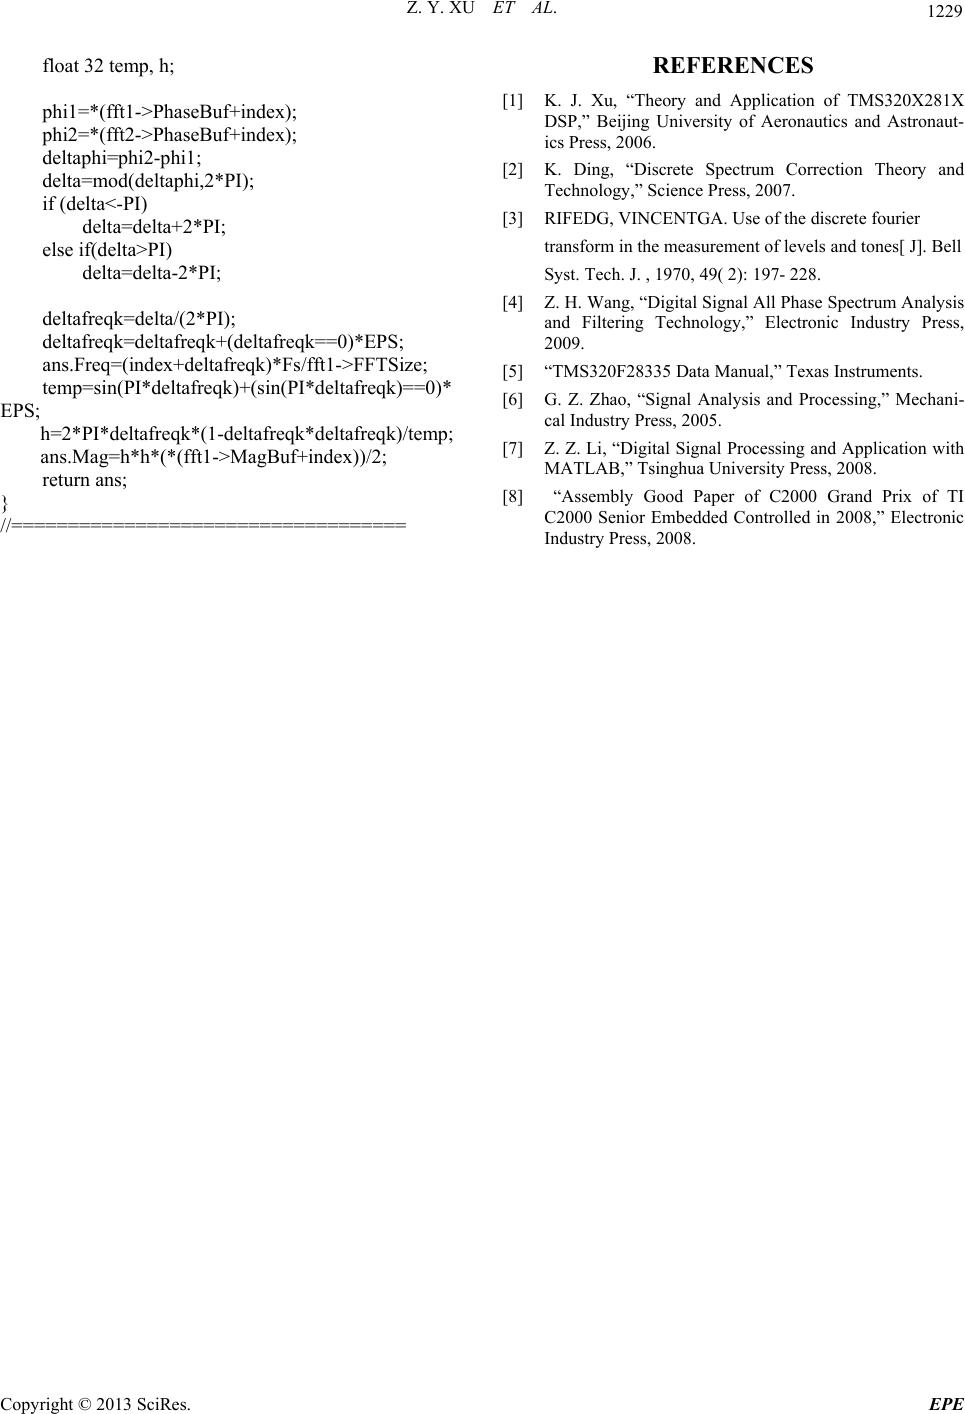 Z. Y. XU ET AL. Copyright © 2013 SciRes. EPE 1229 float 32 temp, h; phi1=*(fft1->PhaseBuf+index); phi2=*(fft2->PhaseBuf+index); deltaphi=phi2-phi1; delta=mod(deltaphi,2*PI); if (delta<-PI) delta=delta+2*PI; else if(delta>PI) delta=delta-2*PI; deltafreqk=delta/(2*PI); deltafreqk=deltafreqk+(deltafreqk==0)*EPS; ans.Freq=(index+deltafreqk)*Fs/fft1->FFTSize; temp=sin(PI*deltafreqk)+(sin(PI*deltafreqk)==0)* EPS; h=2*PI*deltafreqk*(1-deltafreqk*deltafreqk)/temp; ans.Mag=h*h*(*(fft1->MagBuf+index))/2; return ans; } //=================================== REFERENCES [1] K. J. Xu, “Theory and Application of TMS320X281X DSP,” Beijing University of Aeronautics and Astronaut- ics Press, 2006. [2] K. Ding, “Discrete Spectrum Correction Theory and Technology,” Science Press, 2007. [3] RIFEDG, VINCENTGA. Use of the discrete fourier transform in the measurement of levels and tones[ J]. Bell Syst. Tech. J. , 1970, 49( 2): 197- 228. [4] Z. H. Wang, “Digital Signal All Phase Spectrum Analysis and Filtering Technology,” Electronic Industry Press, 2009. [5] “TMS320F28335 Data Manual,” Texas Instruments. [6] G. Z. Zhao, “Signal Analysis and Processing,” Mechani- cal Industry Press, 2005. [7] Z. Z. Li, “Digital Signal Processing and Application with MATLAB,” Tsinghua University Press, 2008. [8] “Assembly Good Paper of C2000 Grand Prix of TI C2000 Senior Embedded Controlled in 2008,” Electronic Industry Press, 2008. |