B. B. FREY ET AL.
52
Table 2.
Reliability and validity evidence for strong and moderate attitude
scales.
Reliability Validity
Coefficient
Alpha (95%
Confidence
Intervals)
Variance
Correlation
with Attitude
Item
Correlation
with Be-
havior Item
Going to the Movies
Strongly Worded Items 0.87
(0.79-0.83) 31.14 0.57 0.15*
Moderately Worded
Items
0.87
(0.79-0.83) 34.22 0.66 0.69*
Animal Experiments
Strongly Worded Items 0.96
(0.94-0.98) 85.01 -0.83 0.49
Moderately Worded
Items
0.93
(0.89-0.96) 54.17 -0.81 0.55
Note: N = 32 for the moderately worded form and N = 33 for the strongly worded
form. *These two correlations were significantly different (Z = 2.60, p < .01).
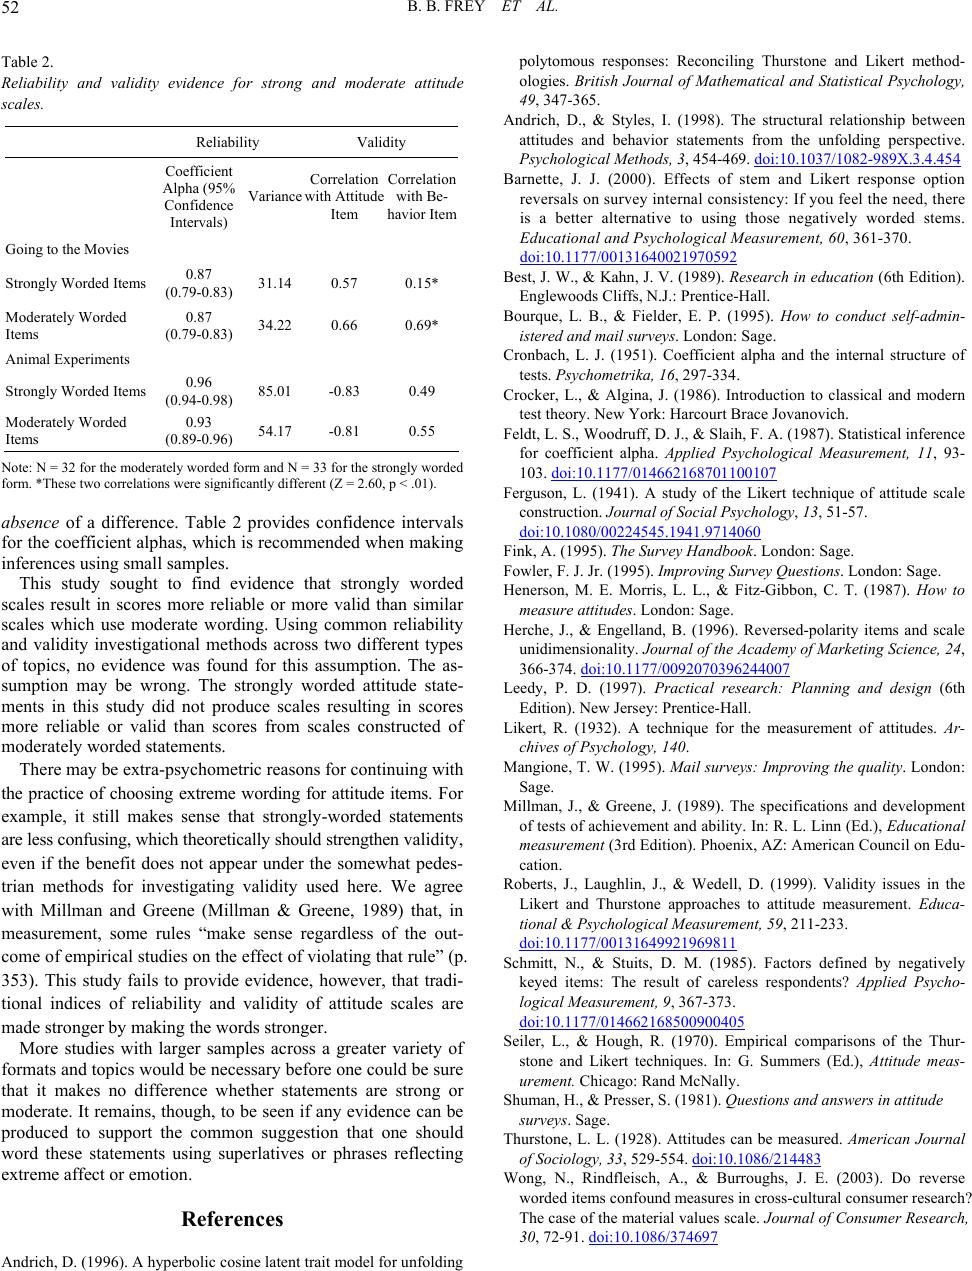
absence of a difference. Table 2 provides confidence intervals
for the coefficient alphas, which is recommended when making
inferences using small samples.
This study sought to find evidence that strongly worded
scales result in scores more reliable or more valid than similar
scales which use moderate wording. Using common reliability
and validity investigational methods across two different types
of topics, no evidence was found for this assumption. The as-
sumption may be wrong. The strongly worded attitude state-
ments in this study did not produce scales resulting in scores
more reliable or valid than scores from scales constructed of
moderately worded statements.
There may be extra-psychometric reasons for continuing with
the practice of choosing extreme wording for attitude items. For
example, it still makes sense that strongly-worded statements
are less confusing, which theoretically should strengthen validity,
even if the benefit does not appear under the somewhat pedes-
trian methods for investigating validity used here. We agree
with Millman and Greene (Millman & Greene, 1989) that, in
measurement, some rules “make sense regardless of the out-
come of empirical studies on the effect of violating that rule” (p.
353). This study fails to provide evidence, however, that tradi-
tional indices of reliability and validity of attitude scales are
made stronger by making the words stronger.
More studies with larger samples across a greater variety of
formats and topics would be necessary before one could be sure
that it makes no difference whether statements are strong or
moderate. It remains, though, to be seen if any evidence can be
produced to support the common suggestion that one should
word these statements using superlatives or phrases reflecting
extreme affect or emotion.
References
Andrich, D. (1996). A hyperbolic cosine latent trait model for unfolding
polytomous responses: Reconciling Thurstone and Likert method-
ologies. British Journal of Mathematical and Statistical Psychology,
49, 347-365.
Andrich, D., & Styles, I. (1998). The structural relationship between
attitudes and behavior statements from the unfolding perspective.
Psychological Methods, 3, 454-469. doi:10.1037/1082-989X.3.4.454
Barnette, J. J. (2000). Effects of stem and Likert response option
reversals on survey internal consistency: If you feel the need, there
is a better alternative to using those negatively worded stems.
Educational and Psychological Measurement, 60, 361-370.
doi:10.1177/00131640021970592
Best, J. W., & Kahn, J. V. (1989). Research in education (6th Edition).
Englewoods Cliffs, N.J.: Prentice-Hall.
Bourque, L. B., & Fielder, E. P. (1995). How to conduct self-admin-
istered and mail surve y s. London: Sage.
Cronbach, L. J. (1951). Coefficient alpha and the internal structure of
tests. Psychometrika, 16, 297-334.
Crocker, L., & Algina, J. (1986). Introduction to classical and modern
test theory. New York: Harcourt Brace Jovanovich.
Feldt, L. S., Woodruff, D. J., & Slaih, F. A. (1987). Statistical inference
for coefficient alpha. Applied Psychological Measurement, 11, 93-
103. doi:10.1177/014662168701100107
Ferguson, L. (1941). A study of the Likert technique of attitude scale
construction. Jour na l o f So cial Psychology, 13, 51-57.
doi:10.1080/00224545.1941.9714060
Fink, A. (1995). The Survey Han db ook. London: Sage.
Fowler, F. J. Jr. (1995). Improving Survey Questions. London: Sage.
Henerson, M. E. Morris, L. L., & Fitz-Gibbon, C. T. (1987). How to
measure attitudes. London: Sage.
Herche, J., & Engelland, B. (1996). Reversed-polarity items and scale
unidimensionality. Journal of the Academy of Marketing Science, 24,
366-374. doi:10.1177/0092070396244007
Leedy, P. D. (1997). Practical research: Planning and design (6th
Edition). New Jersey: Prentice-Hall.
Likert, R. (1932). A technique for the measurement of attitudes. Ar-
chives of Psychology, 140.
Mangione, T. W. (1995). Mail surveys: Improving the quality. London:
Sage.
Millman, J., & Greene, J. (1989). The specifications and development
of tests of achievement and ability. In: R. L. Linn (Ed.), Educational
measurement (3rd Edition). Phoenix, AZ: American Council on Edu-
cation.
Roberts, J., Laughlin, J., & Wedell, D. (1999). Validity issues in the
Likert and Thurstone approaches to attitude measurement. Educa-
tional & Psychological Measurement, 59, 211-233.
doi:10.1177/00131649921969811
Schmitt, N., & Stuits, D. M. (1985). Factors defined by negatively
keyed items: The result of careless respondents? Applied Psycho-
logical Measurement , 9, 367-373.
doi:10.1177/014662168500900405
Seiler, L., & Hough, R. (1970). Empirical comparisons of the Thur-
stone and Likert techniques. In: G. Summers (Ed.), Attitude meas-
urement. Chicago: Rand McNally.
Shuman, H., & Presser, S. (1981). Questions and answers in attitude
surveys. Sage.
Thurstone, L. L. (1928). Attitudes can be measured. American Journal
of Sociology, 33, 529-554. doi:10.1086/214483
Wong, N., Rindfleisch, A., & Burroughs, J. E. (2003). Do reverse
worded items confound measures in cross-cultural consumer research?
The case of the material values scale. Journal of Consumer Research,
30, 72-91. doi:10.1086/374697