Energy and Power Engineering, 2013, 5, 1165-1171
doi:10.4236/epe.2013.54B221 Published Online July 2013 (http://www.scirp.org/journal/epe)
Relevant Factors to a Statistical Analysis of Overvoltages -
Application to Three-Phas e Reclosing of Compensated
Transmission Lines
P. Mestas, M.C. Tavares
School of Electrical and Computer Engineering, University of Campinas (UNICAMP), Campinas, SP, Brazil
Email: pmestasv@dsce.fee.unicamp.br, cristina@dsce.fee.unicamp.br
Received April, 2013
ABSTRACT
This paper describes the statistical study of important factors that influences transient over voltages resulting from
three-phase reclosing of shunt compensated transmission lines. These factors include the model used for transmission
line representation and the influence of line transposition. Additionally, the over voltages reduction to proper levels
depending on the type of control technique are illustrated and analyzed in statistical terms. The evaluation covers three
shunt compensation degrees. The digital simulations were performed using the PSCAD/EMTDC software.
Keywords: Transient Overvoltages; Three-phase Reclosing; Controlled Switching; Surge Arresters; Pre-insertion
Resistor
1. Introduction
An important factor for the planning of extra high volt-
age transmission lines (TL) is the expectation of the
switching over voltages level. For long transmission lines,
the most severe switching over voltages results from fast
three phase reclosing with trapped charge on the line.
A suitable evaluation of transient over voltages re-
quires statistical studies, taking into account the ran-
domness of the closing instant, and the pole-spread or
time interval between closing of the first and final poles
[1, 2]. On the other hand, for the adequate representation
of the electromagnetic transients on transmission line it
should be considered that the longitudinal line parame-
ters are strongly frequency dependent. Consequently, the
transmission line model used for simulation of transient
overvoltages is of great importance.
Likewise, it is important to verify if the representation
of the transmission line by an actual transposition
scheme compared to an ideal transposition scheme (bal-
anced line) has influence on the overvoltage magnitude.
Another important factor during transmission line re-
closing study is the method used to mitigate transient
overvoltages in order to improve power quality levels.
The most used techniques are surge arresters, controlled
switching and pre-insertion resistors.
In this context, the goal of the present study is to
evaluate relevant factors that influence transient overvolt-
ages generated during three-phase reclosing of transmis-
sion lines. These factors include the model used for the
line representation and the influence of line transposition.
In addition, the overvoltages reductions are analyzed
from a viewpoint of the statistical behavior of circuit
breaker.
2. Power System Analyzed
Figure 1 show the analyzed system based on an actual
transmission system of 500 kV and 1052 km. The study
is focused on the final segment of the line, which corre-
sponds to a length of 252 km in the direction of B4 to B5.
The line was switched using the CB7 circuit breaker.
The compensation scheme is composed of three sin-
gle-phase reactors banks, with quality factor of 400,
grounded through a neutral reactor with quality factor of
40. The line parameters for the fundamental frequency
(60 Hz) are shown in Table 1. Digital simulations were
performed with PSCAD/EMTDC software.
Figure 1. 500 kV transmission system.
Copyright © 2013 SciRes. EPE
P. MESTAS, M. C. TAVARES
1166
Table 1. Basic line unitary parameters – 60 Hz.
Components Longitudinal (Ώ/km) Transversal (μS/km)
Non homopolar 0.0161 + j 0.2734 j 6.0458
Homopolar 0.4352 + j 1.4423 j 3.5237
3. Three-phase Reclosing of TL
The reclosing is a maneuver that consists in closing the
contacts of circuit breaker after the transmission line
opening in order to restore the power supply. Three-
phase reclosing may cause high transient overvoltages if
the voltage source and the trapped charge on the line
have opposite polarities.
3.1. TL Reclosing without Shunt Reactive
Compensation
For uncompensated lines, the waveform can be approxi-
mated with a function of the form 1-cos (t) with a suit-
able value of . The optimization of three-phase reclos-
ing of such an uncompensated line is straightforward,
and is achieved by breaker closure at a valley of the vol-
tage signal and when the voltage is around the voltage
zero crossing.
3.2. TL Reclosing with Shunt Reactive
Compensation
The capacitive reactive power generated by transmission
lines is usually compensated by the installation of shunt
reactors at the ends of the line. The operational require-
ments of the system and the length of the line determine
the level of the transmission line compensation.
The compensation level has an important effect on the
voltage waveform across the contacts of the circuit
breaker. As shown in Figure 2, the voltage across the
contacts of the circuit breaker takes the form of beat.
This beat is due to composition among the fundamental
frequency of the system from one side of the contact
breaker (system side) and the natural frequency of the
line and reactors from the other side of the circuit breaker
contact (line side) [3,4].
3.3. Three-phase Reclosing of TL under
Conditions of Internal Fault
When the line opening occurs due to a fault on the
transmission line, the sequence of events for the three-
phase reclosing includes: a fault occurrence, three-phase
line opening to isolate the section under fault, waiting
time for fault extinction and finally the reclosing of the
transmission line. The phase under fault influences the
waveform of the other two healthy phases, consequently
the signals obtained are very complex and the expected
beat is distorted in all three phases. For this reason, the
three-phase reclosing scheme should be performed re-
garding to the time necessary for the extinction of the
fault.
3.4. Three-phase Reclosing of TL under
Conditions of External Defects
In this case, the sequence of events includes the auto-
matic opening of the circuit breaker and subsequent re-
closing after a predetermined time interval. The voltage
across the circuit breaker presents a well defined beat,
and the waveform is similar for the three phases.
The three-phase reclosing under conditions of external
defects occurs when high values of switching overvolt-
ages are erroneously interpreted as fault by any protec-
tive relay, resulting in the line dropping operation. It can
also occur in the case of transmission lines on dou-
ble-circuit, when the switching transient of one of the
lines is coupled into the other line, which can also lead to
incorrect operation of protection. Another condition
could occur during a load rejection followed by opening
the line at the sending end or also during the recovery of
the power system after a large area black-out.
This work is focused on fast three-phase reclosing of
shunt compensated transmission lines under conditions
of external defects.
4. Statistical Evaluation of Overvoltages
For the evaluation of overvoltages it is important to con-
duct statistical studies to consider the randomness of the
closing instant and the spread between the contacts of the
circuit breaker. To this end, the circuit breakers are rep-
resented by statistic switches.
The statistic switches represents the variation of the
closing instant by Gaussian curves for the three phases
with a mean time and a standard deviation associated.
Additionally, the variation of the mean time over a given
period is characterized by a uniform distribution [5].
The statistic switch used in the simulations of this
work was modeled according to [6]. The closing of the
circuit breaker is randomly initiated over the period of a
fundamental frequency cycle (in this case, over the 16.67
Figure 2. Voltage wave shape across circuit breaker poles.
TL with compensation.
Copyright © 2013 SciRes. EPE
P. MESTAS, M. C. TAVARES 1167
ms), and each pole closes in an interval defined by a
normal distribution with a mean value and a standard
deviation of 1 ms.
Statistical evaluation was determined by analysis of
variance (ANOVA) and F-test [7] with a significance
level of 1% for the determination of the following as-
pects:
- Model used to represent the transmission line.
- Influence of line transposition scheme.
4.1. Model used to represent the TL
This evaluation aims to verify if differences can be found
in statistical studies of reclosing regarding on the model
used to represent the transmission line.
For this purpose were analyzed the following models
of transmission lines, available in PSCAD program:
- Line model with frequency constant parameters or
Bergeron Model [8].
- Line model with frequency dependence of longitu-
dinal parameters or Phase Model [9].
For each case 300 shots were performed. One cycle of
the fundamental frequency was considered for the varia-
tion range of the mean closing time. The analysis was
performed for 90, 70 and 50 % of shunt compensation.
The surge arresters at the line ends were not represented.
In Table 2 are presented the results obtained with the
Bergeron Model and the Phase Model, for the three
compensation levels. Higher overvoltages were verified
when the line is modeled through Bergeron Model.
From the F-test of ANOVA shown in Table 3, for a
significance level of 1%, were found statistically signifi-
cant differences between groups regarding to the trans-
mission line model.
The Phase Model is numerically robust and more ac-
curate for studies that require the frequency representa-
tion, different of fundamental frequency. Therefore, the
Phase Model should be used in reclosing studies and will
be used in the subsequent simulations.
Table 2. Transient overvoltages at line end.- analysis of
transmission line model influence.
Overvoltages at line end (p.u)
Comp.
degree
(%)
Transmission
Lines Models Max. Mean
Standard de-
viation
CV
(%)
Bergeron 2.175 2.067 0.0620
90
Phases 2.101 2.020 0.0530
3.042
Bergeron 2.449 2.270 0.0673
70
Phases 2.358 2.214 0.0702
3.317
Bergeron 2.686 2.505 0.0939
50
Phases 2.607 2.440 0.0890
3.921
4.2. Influence of TL Transposition
In order to determine the influence of the transposition
scheme, the transmission line was modeled for the fol-
lowing cases:
- Transmission line perfectly transposed (LPT).
- Transmission line with transposition scheme 1/6-
1/3-1/3-1/6 (LRT).
For this evaluation were performed 300 shots for each
case, with a variation range of the mean closing time of
01 cycle of the fundamental frequency. The transmission
line model was represented by Phase Model and the
study was performed for 90, 70 and 50% of shunt reac-
tive compensation. The surge arresters at the line ends
were not represented.
From the results of Table 4 it is possible to observe
that the representation of the line with an ideal transpose-
tion scheme or with a real transposition scheme had in-
fluence on the overvoltages at the line ends. For all the
analyzed cases the overvoltages had greater amplitude
when the line is represented by a real transposition
scheme.
Table 3. Analysis of variance of maximum overvolt-
ages at line end.- Analysis of Line Model Influence.
Comp.
degree
(%)
Source Freedom
Degrees
Sum of
Squares
Mean
Squares F F Critic.
**
BG 1 0.216 0.2165 65.0136.699
WG398 1.325 0.0033 - -
90
Total399 1.542 - - -
BG 1 0.324 0.3245 68.5986.699
WG398 1.882 0.0047 - - 70
Total399 2.207 - - -
BG 1 0.422 0.4221 50.4626.699
WG398 3.329 0.0084 - - 50
Total399 3.751 - - -
Table 4. Transient Overvoltages at Line End.- Influence of
Line Transposition.
Overvoltages at line end (p.u)
Comp.
degree
(%)
Line Transposi-
tion Scheme Max. Mean
Standard
deviation
CV
(%)
LPT 2.014 1.920 0.044
90
LRT 2.110 1.925 0.078
3.302
LPT 2.424 2.184 0.105
70
LRT 2.516 2.287 0.115
5.442
LPT 2.710 2.404 0.215
50
LRT 2.876 2.562 0.147
8.066
Copyright © 2013 SciRes. EPE
P. MESTAS, M. C. TAVARES
1168
Table 5 shows the results of ANOVA. It is observed
that for the transmission line with 90% of shunt com-
pensation, the overvoltages for LTR are higher than for
LPT, but this difference is small, therefore the F test
shows differences statistically not significant between
both groups. For lines with 70 and 50% of compensation,
the F-test shows differences statistically significant be-
tween the groups.
The natural frequency of the line side is slightly dif-
ferent due to the variation of the line parameters caused
by the transposition. This difference, in turn, results in
the beating across the circuit breaker contacts with a dif-
ferent period regarding to the representation of the line
with or without real compensation scheme. This phe-
nomenon is most evident in highly compensated lines.
Based on the results it is recommended that for the
analysis of transient overvoltages during three-phase
reclosing the transmission lines must be represented with
their actual transposition scheme. For the fundamental
frequency, the line can be represented as ideally trans-
posed, but this cannot be generalized to the whole range
of frequencies involved in the transient phenomena.
5. Analysis of Overvoltages Reduction Me-
thods
The negative impacts produced by random switching of
circuit breakers during three-phase reclosing of transmis-
sion lines include reduction of equipment lifetime,
breakdown of equipment in the substations, and degrada-
tion of power quality. Consequently, overvoltage control
methods have to be adopted to provide suitable protec-
tion for the network.
The control methods analyzed in this work are: the use
of metal oxide surge arresters, controlled switching and
pre-insertion resistor.
Table 5. Analysis of variance of maximum overvoltages at
line end.- Influence of Line Transposition.
Comp
degree
(%)
Source
Degrees
of free-
dom
Sum of
Squares
Mean
Squares F F Crit.
**
BG 1 0.00284 0.00284 0.70346.6989
WG 398 1.60515 0.00403 - -
90
Total 399 1.60799 - - -
BG 1 1.05151 1.05151 86.2086.699
WG 398 4.85450 0.01220 - - 70
Total 399 5.90601 - - -
BG 1 2.48973 2.48973 73.2436.6990
WG 398 13.529000.03399 - -
50
Total 399 16.01873- - -
For each of the three control methods analyzed 300
simulations were performed; one cycle of the fundamen-
tal frequency was considered for the variation range of
the mean closing time; the transmission line was repre-
sented by Phases Model with transposition scheme
1/6-1/3-1/3-1/6. The analysis was performed for 90, 70
and 50 % of shunt compensation and the surge arresters
at the line ends were not represented, unless when it was
the mitigation method.
5.1. Metal Oxide Surge Arresters
The metal oxide surge arresters have proven effective to
limit overvoltages due its highly non-linear characteristic
of the voltage related to the current [10].
For the simulations, all surge arresters are modeled
according to the characteristic V-I curve. The following
arresters were simulated:
- Class 5 - 420 kV rated arrester with a protection
level of 830 kV at 2 kA, normally specified for 500 kV
Brazilian transmission lines.
- Class 5 - 396 kV rated arrester with a protection
level of 783 kV at 2 kA.
- Class 3 - 360 kV rated arrester with a protection
level of 742 kV at 2 kA.
Table 6 presents representative values of overvoltages
at the line ends using the three classes of surge arresters
for the three analyzed compensation levels. For the eval-
uation of critical conditions, the reclosing mean time is
the second, third and fifth maximum of the voltage beat
between the circuit breaker contacts.
The 396 kV arresters provided a more effective per-
formance and a greater reduction in overvoltage than the
420 kV arresters for the three compensation levels.
The use of a 360 kV rated arrester leads to an even
greater reduction in the overvoltages at the line terminals.
This case was simulated with an illustrative and com-
parative purpose because the appropriate selection of the
surge arrester is determined not only by the protective
Table 6. Transient Overvoltages at Line End using Surge
Arrester.
Overvoltages at line end (p.u)
Comp.
degree
(%)
Rated
Voltage
(kV) Max. Mean Standard
deviation
420 1.865 1.784 0.0501
396 1.783 1.732 0.0325
90 %
360 1.704 1.679 0.0141
420 1.906 1.832 0.0513
396 1.814 1.761 0.0349
70 %
360 1.720 1.678 0.0273
420 1.953 1.920 0.0200
396 1.851 1.823 0.0163 50 %
360 1.752 1.729 0.0158
Copyright © 2013 SciRes. EPE
P. MESTAS, M. C. TAVARES 1169
level, but also by the operational characteristics of the
system as a whole. Temporary overvoltage and maxi-
mum operational voltage are also relevant.
5.2. Controlled Switching
For three-phase reclosing, the controlled switching is
applied so that the contacts of the circuit breaker must be
closed at the minimum of the beat across the contacts of
the circuit breaker (Figure 2). This region varies with the
compensation level of the system and should be deter-
mined by an algorithm regarding to the measurement of
voltage signals of the system, which are supplied to the
algorithm.
Considering, for example, a dead time of 200 ms, the
optimal instant for three-phase reclosing corresponds to
first, second and fourth beat minimum for transmission
lines with 90, 70 and 50% of compensation, respectively.
Two approaches to determining the optimal time of
closing were analyzed:
a) Existing Method (EM)
In general way, the existing method described in [5, 11]
identifies the first region of minimum beat and sends an
order to close the circuit breaker in the next similar re-
gion. This method is based on the voltage polarities and
zero crossing detection. The closing instant is determined
when the voltage polarities at the source-side and the
line-side are identical and when both signals cross by
zero.
b) Proposed Method (PM)
The proposed method [3,4] sends the closing com-
mand appropriately such that the poles closing occurs in
the first minimum voltage beat across the circuit breaker,
after the protection dead time. This method is based on
the voltage wave shape across the circuit breaker, inde-
pendent of voltage zero crossing.
Table 7 summarizes the simulation results and in-
cludes breaker reclosing mean times (RT). It can be seen
that even though the overvoltage is only slightly smaller
for the previously existing controlled reclosing method,
the advantage that the proposed method is a much re-
duced reclosing time. It should be noted that the previ-
ously existing method was treated in an idealized manner,
with its circuit breaker being closed at the second, third
and fifth minimum voltage beats. This is optimistic, and
in reality, the circuit breaker time would in all likelihood
be further delayed. This delayed closing would occur
particularly for low compensation levels, as the circuit
breaker voltage has a less than pronounced beat and even
certain intervals where there is no zero crossing at all,
making it difficult for the existing method to identify the
optimal reclosing instance.
5.3. Pre-Insertion Resistor
In this study, an existing 400- resistor was simulated,
with a mean insertion time of 8 ms. All three switch
breaker poles of the main chamber of circuit breaker
have the same mean closing time. The standard deviation
of the closing time variation of the contacts is 0.5 ms for
the auxiliary chamber and 1.0 ms for the main chamber
of circuit breaker; truncated in +/-2σ in both cases.
Table 8 shows the overvoltages values at the receiving
end and includes the mean reclosing time. For the evalu-
ation of the resistor in critical conditions the reclosing
mean time is the second, third and fifth maximum of the
voltage beat between the circuit breaker contacts.
5.4. Comparative Analysis of Control Methods
For the three methods, the overvoltages were measured at
the receiving end for the line with 90% shunt compensa-
tion. For the method of surge arrester was chosen for
comparison the 396 kV rated arrester located on both line
terminals. In the case of controlled switching were pre-
sented both the existing method and the method pro-
posed.
A graphical comparison of the results obtained by the
studied methods is shown in Figure 3. It is observed that
the controlled switching has the best performance for the
overvoltages control.
It was also noted that, although the resistor is consid-
ered one of the most effective methods to reduce the am-
plitude of overvoltages, it presents a performance less
efficient than the controlled switching. It should be con-
sidered that the mean reclosing time was stressed for
both surge arrester and pre-insertion resistor cases.
Table 7. Transient Overvoltages at Line End using Con-
trolled Switching.
Overvoltages at line end (p.u)
Comp.
degree
(%)
Me-
thod
R.T.
(ms) Max. Mean Standard
deviation
ME 6531.469 1.379 0.0375
90 MP 3181.291 1.223 0.0281
ME 5002.126 1.730 0.1851
70 MP 4051.833 1.563 0.1290
ME 5482.575 2.056 0.2559
50 MP 4902.499 2.019 0.2334
Table 8. Transient Overvoltages at Line End using Pre-
Insertion Resistor.
Overvoltages at line end (p.u)
Comp.
Degree (%)
Reclosing
Time (ms)Max. Mean
Standard
deviation
90 500 1.748 1.583 0.0928
70 558 2.287 2.080 0.1111
50 487 2.785 2.510 0.1093
Copyright © 2013 SciRes. EPE
P. MESTAS, M. C. TAVARES
1170
Figure 4 shows the wave form when the control
method is 396 kV rated arresters at the line ends. The
reclosing occurs 500 ms. after of the line opening, which
corresponds to the maximum of the second voltage beat
between contacts of the circuit breaker.
Figure 5 shows the same operation, but this time using
the proposed method of controlled switching. The re-
closing occurs at the first minimum beat. It can be ob-
served that not only the overvoltages were reduced with
controlled switching as well as the waveform has a lower
harmonic content.
Figure 3. Comparison of maximum overvoltages at line end.
Figu re 4. Line reclosing using 396 kV rated a rresters at line
ends.
Figure 5. Line reclosing using controlled switching pro-
posed method.
Figure 6. Reclosing using controlled switching. Existing
method.
Figure 7. Line reclosing using pre-insertion resistor.
Figure 6 shows the voltage waveforms for the three-
phase reclosing using the existing method of controlled
switching. The reclosing occurs at the second minimum
beat. The method is also effective in reducing overvolt-
ages, but it is noted that the reclosing time is increased.
Figure 7 corresponds to the use of pre-insertion resis-
tor. The reclosing occurs at the maximum of the second
voltage beat between contacts of the circuit breaker.
6. Conclusions
A statistical evaluation of overvoltages associated to
three-phase reclosing of transmission lines was per-
formed.
Regarding to the transmission line model, comparing
results obtained using the Bergeron Model and Phase
Model it was verified that higher overvoltages occur
when the Bergeron Model is used. The latter model
should not be used as it will lead to unnecessary higher
insulation level. Therefore for three-phase reclosing stu-
dies, it is suggested the use of Phase Model because the
accurate modeling of the line frequency dependence is of
essential importance for the correct simulation of elec-
tromagnetic transient conditions.
Copyright © 2013 SciRes. EPE
P. MESTAS, M. C. TAVARES
Copyright © 2013 SciRes. EPE
1171
The representation of the transmission line ideally
transposed or with an actual transposition scheme affects
the results of overvoltages. In the case of three-phase
reclosing, this difference is influenced by the variation of
the line natural frequency and the compensation equip-
ment at the line side.
Regarding the overvoltages mitigation methods, the
use of ZnO surge-arresters with lower rated voltage (396
kV) instead of the surge arresters normally specified (420
kV) is an alternative to limit the overvoltages; however
the use of this method would be more appropriate in
combination with other control method.
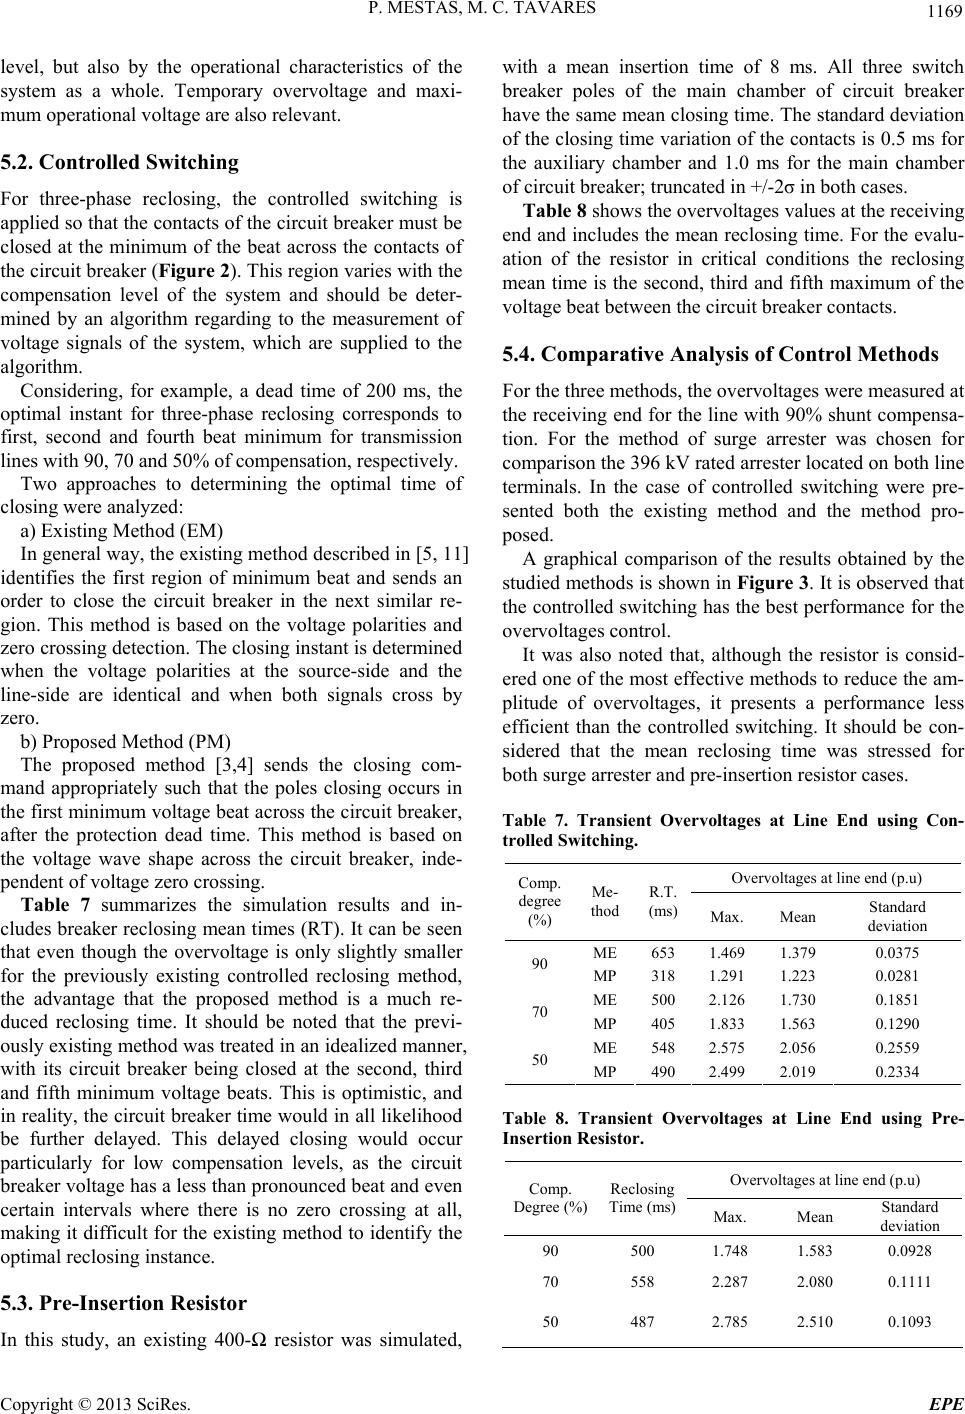
For the three-phase reclosing of the studied system, the
controlled switching is an effective method to reduce the
overvoltages. It should be noted that using the proposed
method overvoltages are slightly lower than for the ex-
isting method, however, the proposed method has a great
advantage in reducing the reclosing time, thereby reduc-
ing the interruption time of power supply.
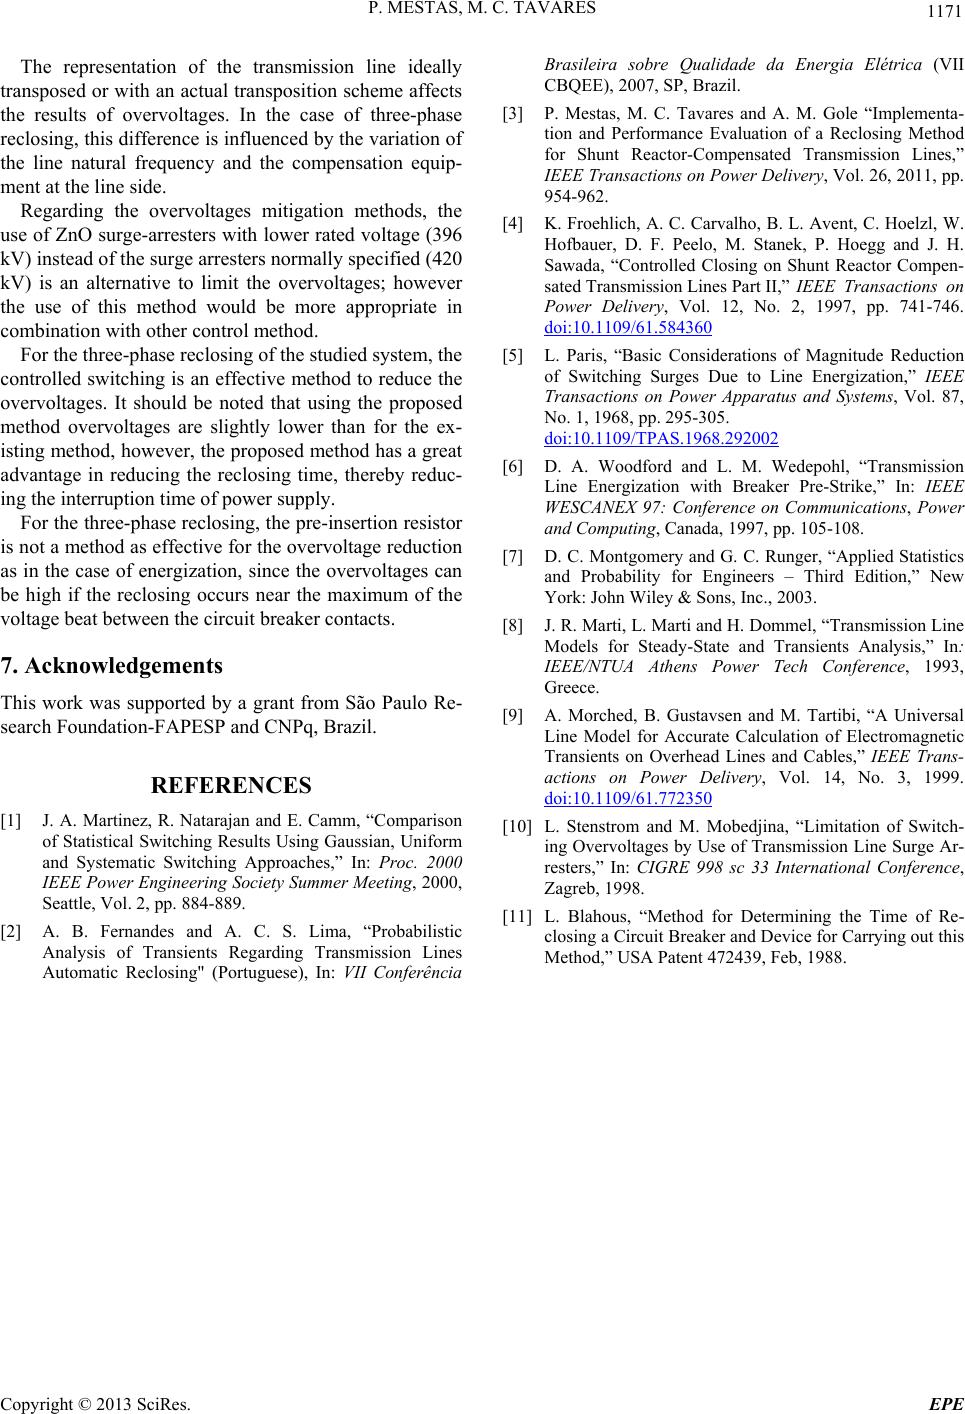
For the three-phase reclosing, the pre-insertion resistor
is not a method as effective for the overvoltage reduction
as in the case of energization, since the overvoltages can
be high if the reclosing occurs near the maximum of the
voltage beat between the circuit breaker contacts.
7. Acknowledgements
This work was supported by a grant from São Paulo Re-
search Foundation-FAPESP and CNPq, Brazil.
REFERENCES
[1] J. A. Martinez, R. Natarajan and E. Camm, “Comparison
of Statistical Switching Results Using Gaussian, Uniform
and Systematic Switching Approaches,” In: Proc. 2000
IEEE Power Engineering Society Summer Meeting, 2000,
Seattle, Vol. 2, pp. 884-889.
[2] A. B. Fernandes and A. C. S. Lima, “Probabilistic
Analysis of Transients Regarding Transmission Lines
Automatic Reclosing" (Portuguese), In: VII Conferência
Brasileira sobre Qualidade da Energia Elétrica (VII
CBQEE), 2007, SP, Brazil.
[3] P. Mestas, M. C. Tavares and A. M. Gole “Implementa-
tion and Performance Evaluation of a Reclosing Method
for Shunt Reactor-Compensated Transmission Lines,”
IEEE Transactions on Power Delivery, Vol. 26, 2011, pp.
954-962.
[4] K. Froehlich, A. C. Carvalho, B. L. Avent, C. Hoelzl, W.
Hofbauer, D. F. Peelo, M. Stanek, P. Hoegg and J. H.
Sawada, “Controlled Closing on Shunt Reactor Compen-
sated Transmission Lines Part II,” IEEE Transactions on
Power Delivery, Vol. 12, No. 2, 1997, pp. 741-746.
doi:10.1109/61.584360
[5] L. Paris, “Basic Considerations of Magnitude Reduction
of Switching Surges Due to Line Energization,” IEEE
Transactions on Power Apparatus and Systems, Vol. 87,
No. 1, 1968, pp. 295-305.
doi:10.1109/TPAS.1968.292002
[6] D. A. Woodford and L. M. Wedepohl, “Transmission
Line Energization with Breaker Pre-Strike,” In: IEEE
WESCANEX 97: Conference on Communications, Power
and Computing, Canada, 1997, pp. 105-108.
[7] D. C. Montgomery and G. C. Runger, “Applied Statistics
and Probability for Engineers – Third Edition,” New
York: John Wiley & Sons, Inc., 2003.
[8] J. R. Marti, L. Marti and H. Dommel, “Transmission Line
Models for Steady-State and Transients Analysis,” In:
IEEE/NTUA Athens Power Tech Conference, 1993,
Greece.
[9] A. Morched, B. Gustavsen and M. Tartibi, “A Universal
Line Model for Accurate Calculation of Electromagnetic
Transients on Overhead Lines and Cables,” IEEE Trans-
actions on Power Delivery, Vol. 14, No. 3, 1999.
doi:10.1109/61.772350
[10] L. Stenstrom and M. Mobedjina, “Limitation of Switch-
ing Overvoltages by Use of Transmission Line Surge Ar-
resters,” In: CIGRE 998 sc 33 International Conference,
Zagreb, 1998.
[11] L. Blahous, “Method for Determining the Time of Re-
closing a Circuit Breaker and Device for Carrying out this
Method,” USA Patent 472439, Feb, 1988.