 American Journal of Plant Sciences, 2013, 4, 2148-2164 Published Online November 2013 (http://www.scirp.org/journal/ajps) http://dx.doi.org/10.4236/ajps.2013.411267 Open Access AJPS Impact of Integrated Nutrient, Crop Residue and Tillage Management on Soil Aggregates and Organic Matter Fractions in Semiarid Subtropical Soil under Soybean-Wheat Rotation Milkha S. Aulakh1*, Ashok K. Garg2, Shrvan Kumar3 1MSKJ University of Agriculture and Technology, Banda, India; 2Krishi Vigyan Kendra, Punjab Agricultural University, Patiala, India; 3Department of Soil Science, Punjab Agricultural University, Ludhiana, India. Email: *msaulakh2004@yahoo.co.in Received May 29th, 2013; revised June 29th, 2013; accepted July 29th, 2013 Copyright © 2013 Milkha S. Aulakh et al. This is an open access article distributed under the Creative Commons Attribution License, which permits unrestricted use, distribution, and reproduction in any medium, provided the original work is properly cited. ABSTRACT Various physical, chemical and biological soil properties in surface (0 - 5 cm) and subsurface (5 - 15 cm) soil were de- termined in a 4-year field experiment conducted at Punjab Agricultural University Ludhiana, India with sixteen treat- ments consisted of different combinations of fertilizer N (0, 20 and 25 kg N ha−1), P (0, 60 and 75 kg P2O5 ha−1), FYM (0 and 10 t·ha−1) and wheat (Triticum aestivum L.) residue (WR) (0 and 6 t·ha−1) applied to summer-grown soybean (Glycine max L.) and fertilizer N (0, 120 and 150 kg N ha−1), P (0, 60 and 75 kg P2O5 ha−1), and soybean residue (SR) (0 and 3 t·ha−1) applied to winter-grown wheat crop continuously in both conventional tillage (CT) and conservation agri- culture (CA), arranged in a split-split plot design with tillage system in main blocks, under irrigated subtropical condi- tions. Application of fertilizer N, P, FYM and crop residue (CR) significantly increased water stable aggregates and had profound effects in increasing the mean weight diameter as well as the formation of macro-aggregates, which were the highest in both surface (85%) and subsurface (81%) soil layers with application of 20 kg N + 60 kg P2O5 + 10 t FYM + 6 t WR ha−1 applied to soybean and 120 kg N + 60 kg P2O5 + 3 t SR ha−1 applied to wheat crop in CA, respectively, and were 83% and 77% in CT treatments after 2 years. Hence, better aggregation was found with 100% NP + FYM + CR, where macro-aggregates were greater than 50% of total soil mass. The same treatment also enhanced total organic C (TOC) from 3.8 g·kg−1 in no-NP-FYM-CR control to 5.8 g·kg−1 in surface layer and from 2.7 to 3.6 g·kg−1 in subsurface layer after 2 years leading to the 41% and 39% higher TOC stocks over CT-Control in 0 - 15 cm soil layers of CT and CA, respectively. The changes in TOC stocks after 4 years were 52% and 59%. Likewise, the labile C and N fractions such as water soluble C, particulate and light fraction organic matter, potentially mineralizable N and microbial biomass were also highest under this integrated inorganic and organic treatment. These results demonstrated that conservation agriculture that integrates application of inorganic fertilizer, organic manure and crop residue, is crucial for improving soil health and sustainability of farming systems in semiarid subtropical soils. Keywords: Soybean; Conservation Agriculture; Water Stable Aggregates; Organic Matter Fractions 1. Introduction Sustainable soil management is desirable to promote profitable agricultural practices that respect the environ- ment, such as conservation agriculture (CA). It attaches great importance to maintenance of soil structure, pro- ductivity and biodiversity. It also reduces the negative impacts of tillage, preserves soil resources and can lead to accrual of much of the soil carbon lost during tillage [1]. Intensive land cultivation to meet the food and fiber needs of fast growing population, and removal or burning of crop residues after crop harvest cause losses of organic matter and nutrients from agricultural soils. Burning of crop residues not only results in losses of organic matter and nutrients but also causes atmospheric pollution due *Corresponding author.  Impact of Integrated Nutrient, Crop Residue and Tillage Management on Soil Aggregates and Organic Matter Fractions in Semiarid Subtropical Soil under Soybean-Wheat Rotation Open Access AJPS 2149 to the emission of toxic and greenhouse gases like CO, CO2 and CH4 that pose a serious threat to human and environmental health. Soil organic matter (SOM) is im- portant for the supply of N, P and S through mineraliza- tion, the retention of some micronutrient elements, en- hanced cation exchange capacity, favourable water rela- tions and aggregate stability. Water stable aggregates (WSA) play an important role in nutrient cycling and in supplying substrate for microbial processes that lead to structural stability. However, labile organic matter frac- tions are readily accessible sources to microorganisms, turnover rapidly (weeks or months), and have direct im- pact on plant nutrient supply [2]. Labile organic matter fractions generally include water soluble C (WSC), par- ticulate organic matter (POM), light-fraction organic matter (LFOM), soil microbial biomass (SMB), and po- tentially mineralizable N (PMN). Microbial biomass C (MBC) and N (MBN) generally have higher mineraliza- tion rates than SOM. In contrast to temperate climate where decomposition is slow, harsh hot and dry climate in semiarid, arid, subtropical and tropical environments causes fast decomposition. While the soils in these re- gions are inherently poor in SOM, the use of inadequate and imbalanced chemical fertilizers over a long period adversely affects soil health and productivity [3]. In con- trast to CT, CA maintains a continuous soil cover through surface retention of crop residue, with no or re- duced tillage, and the use of cover or green manure crops in rotations. However, comparative effects of inorganic fertilizer N and P, organic manures and crop residue in- corporation to crops in CT and CA in semiarid subtropi- cal soils have seldom been investigated. Such informa- tion is needed to identify crop nutrient management prac- tices for sustaining or improving soil heath leading to the environmental safety, conservation of resources and the success of sustaining farming systems. Therefore, a 4-year field experiment was conducted to study the changes in soil quality/health parameters like WSA and various organic matter fractions under CA and CT sys- tems. 2. Materials and Methods 2.1. Experimental Site and Climate A 4-year field experiment on soybean-wheat rotation was established in 2005 at Punjab Agricultural University Research Farm, Ludhiana (30˚54'N, 75˚48'E, 247 m above mean sea level), India on a Fatehpur loamy sand soil (Typic Haplustept). During the 4-year period of field experiment, while the mean monthly minimum air tem- perature ranged from 4˚C in January to 28˚C in July, maximum temperature ranged from 17˚C in January to 40˚C in June. The annual rainfall ranged from 563 to 995 mm of which 71% to 88% was received during monsoon period (June-September). 2.2. Treatments and Field Operations A total of 16 treatment combinations in triplicate with respect to CT and CA system, crop residue and fertilizer N and P (as listed in Table 1) were arranged in a split-split plot design with tillage system in main blocks, CR treatments in sub plots and fertilizer treatments in sub-sub plots of 3.15 × 8.30 m size. The recommended rates of fertilizer nutrients for optimum yields of soybean are 20 kg N and 60 kg P2O5 ha−1 [4] and wheat are 120 kg N and 60 kg P2O5 ha−1. Experimental details and re- sults on crop yields, nutrients uptake etc. from this ex- periment have been reported earlier [5]. In brief, the treatments consisted of control (T1), 100% of recom- mended NP without CR (T2), 125% of recommended NP without CR (T3), 100% NP + 10 t FYM ha−1 without CR (T4) and each of these treatments with CR (T5, T6, T7 and T8) in CT. The corresponding treatments were given in CA as well (T9 to T16, respectively). In CR treatments, 6 t wheat residue ha−1 and 3 t soybean residue ha−1 were incorporated in CT and spread on the soil surface in CA system. While the soil was tilled in CT treatments, crops were seeded by using manually-operated plough mini- mizing the soil disturbance in CA. At harvesting of each crop, the residue was either removed or incorporated in respective treatments in CT. In respective treatments of CA, crop residue was either removed or retained on the soil surface. In crop residue treatments, wheat residue was incorporated in CT and spread on the soil surface in CA system before seeding soybean. Similarly, soybean residue was applied before sowing wheat. The crops were irrigated (7.5 cm) as and when required by taking into consideration the moisture received through rainfall. 2.3. Soil Sampling and Analyses After the completion of two and four cycles of soy- bean-wheat rotations, representative soil samples were collected from four random spots within each plot and mixed thoroughly to prepare a composite sample for 0 - 5 and 5 - 15 cm layer and air dried under shade. A portion of each sample was passed through 2 mm sieve and ana- lyzed for TOC, water soluble C (WSC), particulate or- ganic C and N (POC and PON), light fraction organic C and N (LFOC and LFON), potentially mineralizable N (PMN), and microbial biomass C and N (MBC and MBN). Rest of the clods was broken by hand in such a manner that the size of the clods remained between 5 - 8 mm, later were used for the estimation of water stable aggregates (WSA). The aggregate size distribution was determined by wet sieving method as described by Yoder  Impact of Integrated Nutrient, Crop Residue and Tillage Management on Soil Aggregates and Organic Matter Fractions in Semiarid Subtropical Soil under Soybean-Wheat Rotation Open Access AJPS 2150 Table 1. Effect of fertilizer, FYM and crop residue treatments on soil aggregate size distribution (%) and mean weight di- ameter (MWD) in 0 - 5 cm soil layer after 2-year of the experiment. Treatment Treatments Distribution of WSA in different sizes (%) No. Soybean Wheat 0.11 - 0.25 mm0.25 - 0.50 mm0.5 - 1.0 mm1.0 - 2.0 mm>2.0 mm Total WSA (%)MWD (mm) Conventional tillage T1 N 0 P0 WR0† N 0 P0 SR0‡ 23.2 22.7 14.9 7.1 3.1 70.9 0.41 T2 N 20 P60 WR0 N 120 P60 SR0 25.2 25.4 14.3 9.6 4.5 79.0 0.44 T3§ N 25 P75 WR0 N 150 P75 SR0 - - - - - - - T4 N 20 P60 WR0 + FYM10^ N120 P60 SR0 24.7 25.5 14.7 10.2 5.6 80.6 0.47 T5 N 0 P0 WR6 N 0 P0 SR3 25.9 20.9 15.5 7.6 3.8 73.7 0.42 T6 N 20 P60 WR6 N 120 P60 SR3 25.5 22.6 16.5 11.9 5.2 81.7 0.48 T7§ N 25 P75 WR6 N 150 P75 SR3 - - - - - - - T8 N 20 P60 WR6 + FYM10 N120 P60 SR3 25.0 22.8 17.3 12.8 5.3 83.3 0.49 CT Mean 24.9 23.3 15.5 9.9 4.6 78.2 0.45 LSD (0.05) ns ns 0.78 0.87 0.69 1.7 0.01 Conservation agriculture T9 N 0 P0 WR0 N 0 P0 SR0 22.1 23.9 14.1 10.1 4.9 75.1 0.47 T10 N 20 P60 WR0 N 120 P60 SR0 24.8 25.1 15.3 10.6 5.3 81.1 0.47 T11§ N 25 P75 WR0 N 150 P75 SR0 - - - - - - - T12 N 20 P60 WR0 + FYM10 N120 P60 SR0 23.6 27.5 15.3 10.5 5.0 81.9 0.46 T13 N 0 P0 WR6 N 0 P0 SR3 24.0 20.9 15.2 10.6 5.1 75.8 0.48 T14 N 20 P60 WR6 N 120 P60 SR3 26.7 23.4 15.6 11.2 5.5 82.6 0.47 T15§ N 25 P75 WR6 N 150 P75 SR3 - - - - - - - T16 N 20 P60 WR6 + FYM10 N120 P60 SR3 24.6 27.7 15.6 11.4 5.4 84.7 0.47 CA Mean 24.3 24.8 15.2 10.7 5.2 80.2 0.47 LSD (0.05) ns 3.7 0.8 ns ns 2.8 ns †N = fertilizer N (kg N ha−1); P = fertilizer P (kg P2O5 ha−1); WR = Wheat crop residue (t·ha−1); ‡SR = Soybean crop residue (t·ha−1); §WSA and MWD were not measured in Treatments (T3, T7, T11, and T15); ^FYM = farmyard manure (t·ha−1); ns = non-significant. [6] by uniformly spreading soil clods on the top most sieve of a nest of sieves having pore diameter 2, 1, 0.5, 0.25 and 0.11 mm. The nest of sieves was oscillated up and down by a pulley arrangement for 30 minutes at a frequency of 30 cycles per minute in salt-free water. WSA of different sizes were collected from the respec- tive sieves separately after oven-drying the sieves at 50˚C. % WSA in each size group = (Weight of aggregates in each size group / Total weight of soil) × 100 Total N content of soil samples was determined by di- gestion in concentrated H2SO4 followed by Kjeldahl’s steam distillation. WSC was determined by following the method described by McGill et al. [7] and POC and PON were determined by the method of Cambardella and Elli- ott [8]. LFOC and LMON were determined by the method of Compton and Boone [9], and PMN in soil was determined by following the incubation method [10]. The chloroform fumigation and incubation method was used for the determination of biomass in the soil [11]. For this, the soil samples were pre-incubated for 7 days at 40% WHC at 25˚C to avoid the exaggerated values as there is spurt of microbial activity in soil after wetting of dry soil [12]. The moisture content of the soil samples was ad- justed to 55% WHC by adding sterile distilled water. The increases in CO2 evolution and extractable 4 NH from fumigated samples were determined to estimate the MBC and MBN, respectively. In the representative soil sam- ples collected from 0 - 5 and 5 - 15 cm layers after 4 years of experimentation, soil pH was determined in soil:water suspension (1:2 ratio) using glass electrode. 2.4. Statistical Analysis Statistical analysis of data of WSA and various soil health parameters was carried out by ANOVA in split-split plot design [13]. The effects of different treat- 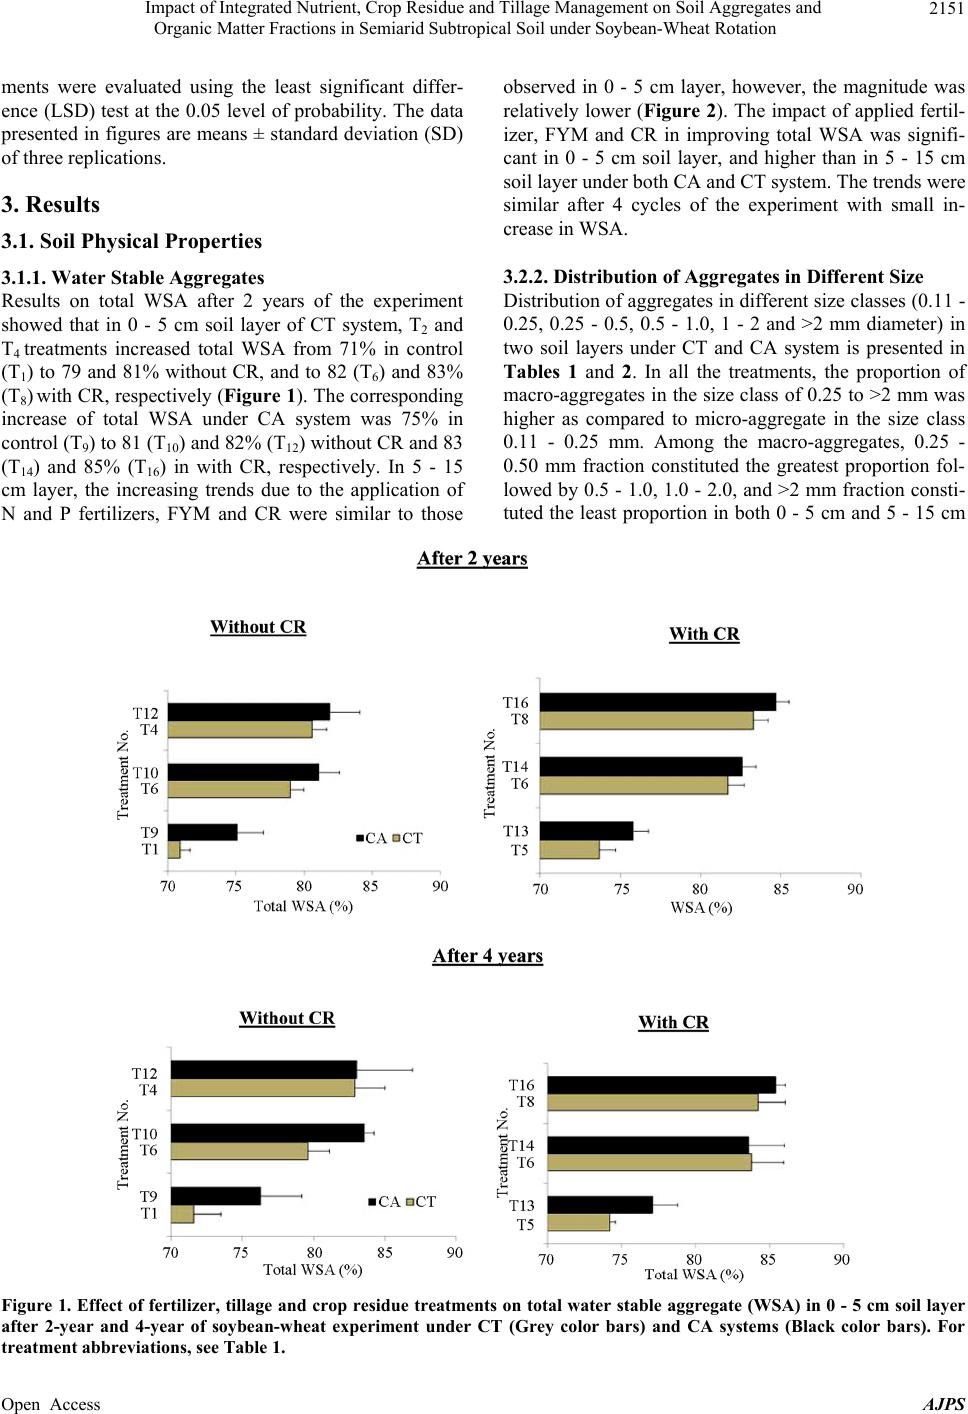 Impact of Integrated Nutrient, Crop Residue and Tillage Management on Soil Aggregates and Organic Matter Fractions in Semiarid Subtropical Soil under Soybean-Wheat Rotation Open Access AJPS 2151 ments were evaluated using the least significant differ- ence (LSD) test at the 0.05 level of probability. The data presented in figures are means ± standard deviation (SD) of three replications. 3. Results 3.1. Soil Physical Properties 3.1.1. Water S tabl e Aggregates Results on total WSA after 2 years of the experiment showed that in 0 - 5 cm soil layer of CT system, T2 and T4 treatments increased total WSA from 71% in control (T1) to 79 and 81% without CR, and to 82 (T6) and 83% (T8) with CR, respectively (Figure 1). The corresponding increase of total WSA under CA system was 75% in control (T9) to 81 (T10) and 82% (T12) without CR and 83 (T14) and 85% (T16) in with CR, respectively. In 5 - 15 cm layer, the increasing trends due to the application of N and P fertilizers, FYM and CR were similar to those observed in 0 - 5 cm layer, however, the magnitude was relatively lower (Figure 2). The impact of applied fertil- izer, FYM and CR in improving total WSA was signifi- cant in 0 - 5 cm soil layer, and higher than in 5 - 15 cm soil layer under both CA and CT system. The trends were similar after 4 cycles of the experiment with small in- crease in WSA. 3.2.2. Distrib ution of Aggreg ates in Di fferent Size Distribution of aggregates in different size classes (0.11 - 0.25, 0.25 - 0.5, 0.5 - 1.0, 1 - 2 and >2 mm diameter) in two soil layers under CT and CA system is presented in Tables 1 and 2. In all the treatments, the proportion of macro-aggregates in the size class of 0.25 to >2 mm was higher as compared to micro-aggregate in the size class 0.11 - 0.25 mm. Among the macro-aggregates, 0.25 - 0.50 mm fraction constituted the greatest proportion fol- lowed by 0.5 - 1.0, 1.0 - 2.0, and >2 mm fraction consti- tuted the least proportion in both 0 - 5 cm and 5 - 15 cm Figure 1. Effect of fertilizer, tillage and crop residue treatments on total water stable aggregate (WSA) in 0 - 5 cm soil layer after 2-year and 4-year of soybean-wheat experiment under CT (Grey color bars) and CA systems (Black color bars). For treatment abbreviations, see Table 1. 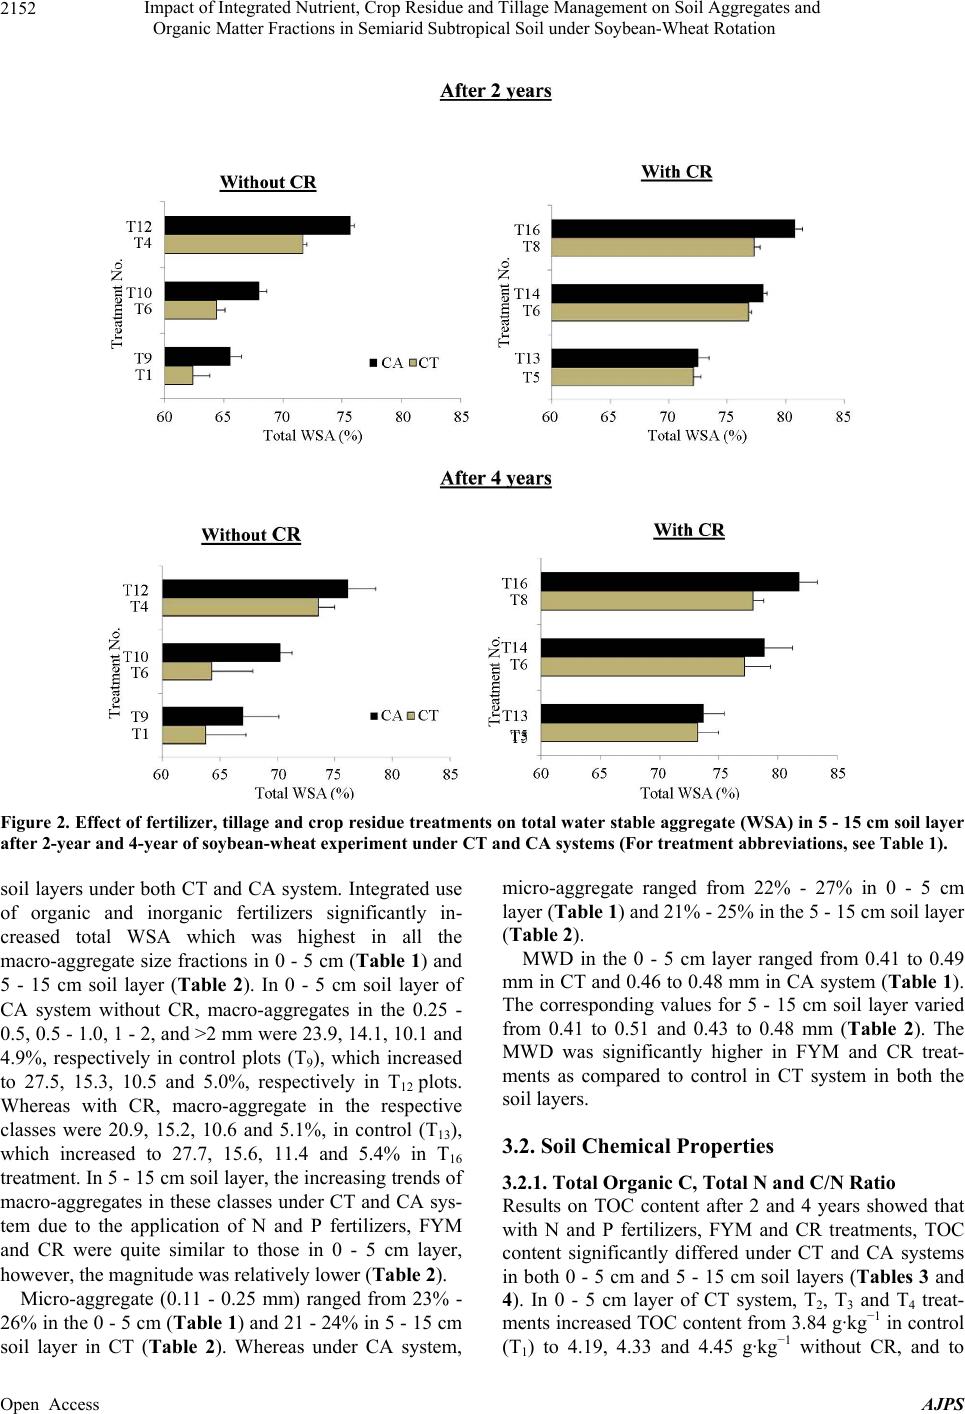 Impact of Integrated Nutrient, Crop Residue and Tillage Management on Soil Aggregates and Organic Matter Fractions in Semiarid Subtropical Soil under Soybean-Wheat Rotation Open Access AJPS 2152 Figure 2. Effect of fertilizer, tillage and crop residue treatments on total water stable aggregate (WSA) in 5 - 15 cm soil layer after 2-year and 4-year of soybean-wheat experiment under CT and CA systems (For treatment abbreviations, see Table 1). soil layers under both CT and CA system. Integrated use of organic and inorganic fertilizers significantly in- creased total WSA which was highest in all the macro-aggregate size fractions in 0 - 5 cm (Table 1) and 5 - 15 cm soil layer (Table 2). In 0 - 5 cm soil layer of CA system without CR, macro-aggregates in the 0.25 - 0.5, 0.5 - 1.0, 1 - 2, and >2 mm were 23.9, 14.1, 10.1 and 4.9%, respectively in control plots (T9), which increased to 27.5, 15.3, 10.5 and 5.0%, respectively in T12 plots. Whereas with CR, macro-aggregate in the respective classes were 20.9, 15.2, 10.6 and 5.1%, in control (T13), which increased to 27.7, 15.6, 11.4 and 5.4% in T16 treatment. In 5 - 15 cm soil layer, the increasing trends of macro-aggregates in these classes under CT and CA sys- tem due to the application of N and P fertilizers, FYM and CR were quite similar to those in 0 - 5 cm layer, however, the magnitude was relatively lower (Table 2). Micro-aggregate (0.11 - 0.25 mm) ranged from 23% - 26% in the 0 - 5 cm (Table 1) and 21 - 24% in 5 - 15 cm soil layer in CT (Table 2). Whereas under CA system, micro-aggregate ranged from 22% - 27% in 0 - 5 cm layer (Tabl e 1) and 21% - 25% in the 5 - 15 cm soil layer (Table 2). MWD in the 0 - 5 cm layer ranged from 0.41 to 0.49 mm in CT and 0.46 to 0.48 mm in CA system (Table 1). The corresponding values for 5 - 15 cm soil layer varied from 0.41 to 0.51 and 0.43 to 0.48 mm (Table 2). The MWD was significantly higher in FYM and CR treat- ments as compared to control in CT system in both the soil layers. 3.2. Soil Chemical Properties 3.2.1. Total Organic C, Total N and C/N Ratio Results on TOC content after 2 and 4 years showed that with N and P fertilizers, FYM and CR treatments, TOC content significantly differed under CT and CA systems in both 0 - 5 cm and 5 - 15 cm soil layers (Tables 3 and 4). In 0 - 5 cm layer of CT system, T2, T3 and T4 treat- ments increased TOC content from 3.84 g·kg−1 in control (T1) to 4.19, 4.33 and 4.45 g·kg−1 without CR, and to 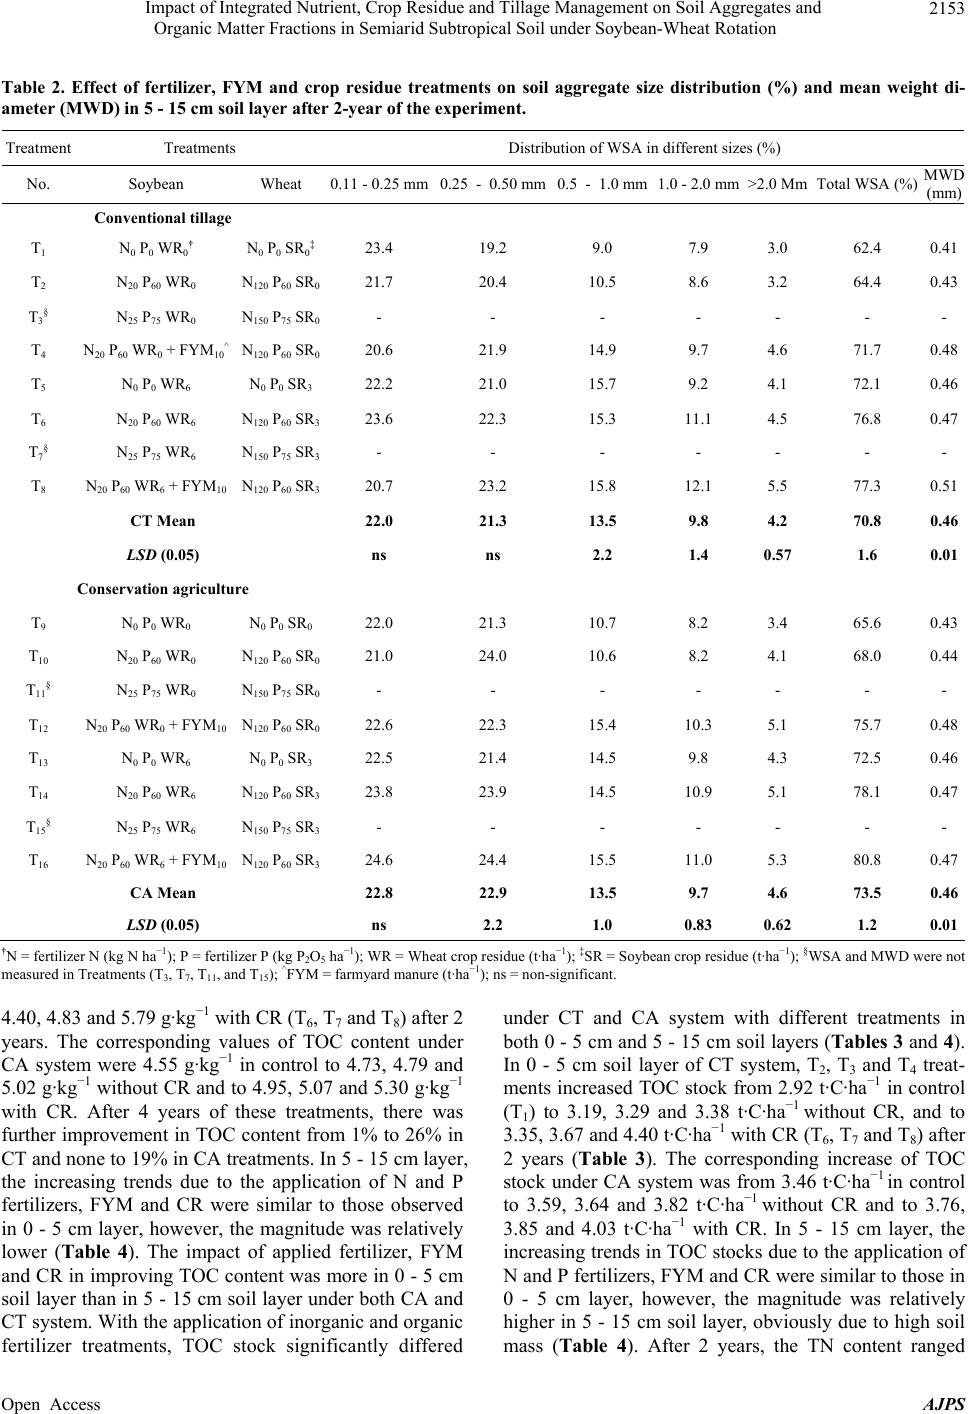 Impact of Integrated Nutrient, Crop Residue and Tillage Management on Soil Aggregates and Organic Matter Fractions in Semiarid Subtropical Soil under Soybean-Wheat Rotation Open Access AJPS 2153 Table 2. Effect of fertilizer, FYM and crop residue treatments on soil aggregate size distribution (%) and mean weight di- ameter (MWD) in 5 - 15 cm soil layer after 2-year of the experiment. Treatment Treatments Distribution of WSA in different sizes (%) No. Soybean Wheat 0.11 - 0.25 mm0.25 - 0.50 mm0.5 - 1.0 mm1.0 - 2.0 mm >2.0 Mm Total WSA (%)MWD (mm) Conventional tillage T1 N 0 P0 WR0† N 0 P0 SR0‡ 23.4 19.2 9.0 7.9 3.0 62.4 0.41 T2 N 20 P60 WR0 N 120 P60 SR0 21.7 20.4 10.5 8.6 3.2 64.4 0.43 T3§ N 25 P75 WR0 N 150 P75 SR0 - - - - - - - T4 N 20 P60 WR0 + FYM10^ N 120 P60 SR0 20.6 21.9 14.9 9.7 4.6 71.7 0.48 T5 N 0 P0 WR6 N 0 P0 SR3 22.2 21.0 15.7 9.2 4.1 72.1 0.46 T6 N 20 P60 WR6 N 120 P60 SR3 23.6 22.3 15.3 11.1 4.5 76.8 0.47 T7§ N 25 P75 WR6 N 150 P75 SR3 - - - - - - - T8 N 20 P60 WR6 + FYM10 N 120 P60 SR3 20.7 23.2 15.8 12.1 5.5 77.3 0.51 CT Mean 22.0 21.3 13.5 9.8 4.2 70.8 0.46 LSD (0.05) ns ns 2.2 1.4 0.57 1.6 0.01 Conservation agriculture T9 N 0 P0 WR0 N 0 P0 SR0 22.0 21.3 10.7 8.2 3.4 65.6 0.43 T10 N 20 P60 WR0 N 120 P60 SR0 21.0 24.0 10.6 8.2 4.1 68.0 0.44 T11§ N 25 P75 WR0 N 150 P75 SR0 - - - - - - - T12 N 20 P60 WR0 + FYM10 N 120 P60 SR0 22.6 22.3 15.4 10.3 5.1 75.7 0.48 T13 N 0 P0 WR6 N 0 P0 SR3 22.5 21.4 14.5 9.8 4.3 72.5 0.46 T14 N 20 P60 WR6 N 120 P60 SR3 23.8 23.9 14.5 10.9 5.1 78.1 0.47 T15§ N 25 P75 WR6 N 150 P75 SR3 - - - - - - - T16 N 20 P60 WR6 + FYM10 N 120 P60 SR3 24.6 24.4 15.5 11.0 5.3 80.8 0.47 CA Mean 22 .8 22.9 13.5 9.7 4.6 73.5 0.46 LSD (0.05) ns 2.2 1.0 0.83 0.62 1.2 0.01 †N = fertilizer N (kg N ha−1); P = fertilizer P (kg P2O5 ha−1); WR = Wheat crop residue (t·ha−1); ‡SR = Soybean crop residue (t·ha−1); §WSA and MWD were not measured in Treatments (T3, T7, T11, and T15); ^FYM = farmyard manure (t·ha−1); ns = non-significant. 4.40, 4.83 and 5.79 g·kg−1 with CR (T6, T7 and T8) after 2 years. The corresponding values of TOC content under CA system were 4.55 g·kg−1 in control to 4.73, 4.79 and 5.02 g·kg−1 without CR and to 4.95, 5.07 and 5.30 g·kg−1 with CR. After 4 years of these treatments, there was further improvement in TOC content from 1% to 26% in CT and none to 19% in CA treatments. In 5 - 15 cm layer, the increasing trends due to the application of N and P fertilizers, FYM and CR were similar to those observed in 0 - 5 cm layer, however, the magnitude was relatively lower (Table 4). The impact of applied fertilizer, FYM and CR in improving TOC content was more in 0 - 5 cm soil layer than in 5 - 15 cm soil layer under both CA and CT system. With the application of inorganic and organic fertilizer treatments, TOC stock significantly differed under CT and CA system with different treatments in both 0 - 5 cm and 5 - 15 cm soil layers (Tables 3 and 4). In 0 - 5 cm soil layer of CT system, T2, T3 and T4 treat- ments increased TOC stock from 2.92 t·C·ha−1 in control (T1) to 3.19, 3.29 and 3.38 t·C·ha−1 without CR, and to 3.35, 3.67 and 4.40 t·C·ha−1 with CR (T6, T7 and T8) after 2 years (Table 3). The corresponding increase of TOC stock under CA system was from 3.46 t·C·ha−1 in control to 3.59, 3.64 and 3.82 t·C·ha−1 without CR and to 3.76, 3.85 and 4.03 t·C·ha−1 with CR. In 5 - 15 cm layer, the increasing trends in TOC stocks due to the application of N and P fertilizers, FYM and CR were similar to those in 0 - 5 cm layer, however, the magnitude was relatively higher in 5 - 15 cm soil layer, obviously due to high soil mass (Table 4). After 2 years, the TN content ranged 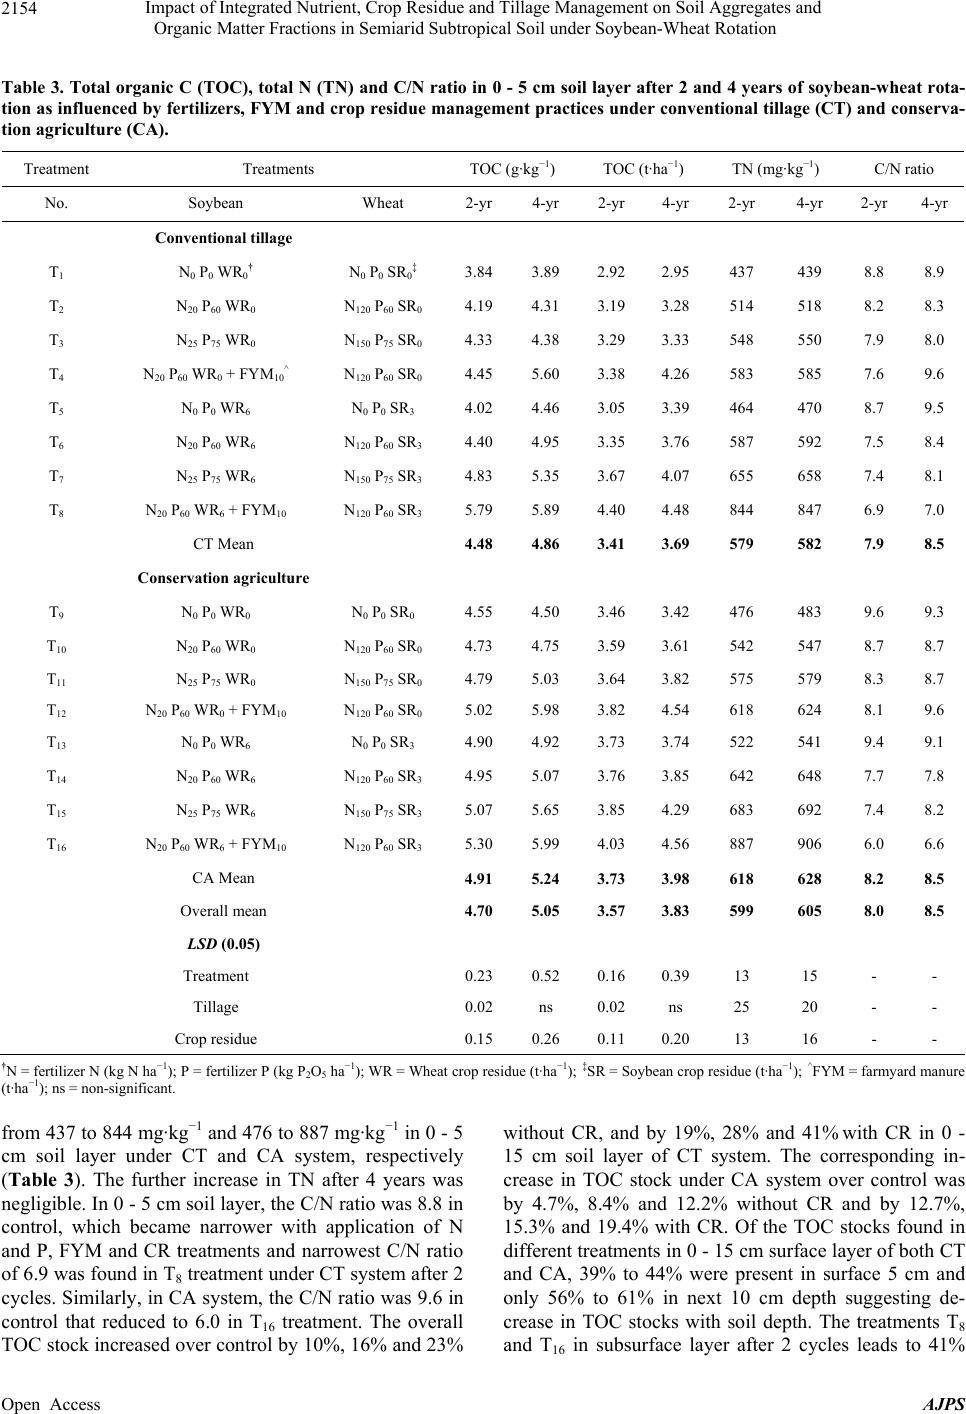 Impact of Integrated Nutrient, Crop Residue and Tillage Management on Soil Aggregates and Organic Matter Fractions in Semiarid Subtropical Soil under Soybean-Wheat Rotation Open Access AJPS 2154 Table 3. Total organic C (TOC), total N (TN) and C/N ratio in 0 - 5 cm soil layer after 2 and 4 years of soybean-wheat rota- tion as influenced by fertilizers, FYM and crop residue management practices under conventional tillage (CT) and conserva- tion agriculture (CA). Treatment Treatments TOC (g·kg−1) TOC (t·ha−1) TN (mg·kg−1) C/N ratio No. Soybean Wheat 2-yr 4-yr 2-yr 4-yr 2-yr 4-yr 2-yr 4-yr Conventional tillage T1 N 0 P0 WR0† N 0 P0 SR0‡ 3.84 3.89 2.92 2.95 437 439 8.8 8.9 T2 N 20 P60 WR0 N 120 P60 SR0 4.19 4.31 3.19 3.28 514 518 8.2 8.3 T3 N 25 P75 WR0 N 150 P75 SR0 4.33 4.38 3.29 3.33 548 550 7.9 8.0 T4 N 20 P60 WR0 + FYM10^ N 120 P60 SR0 4.45 5.60 3.38 4.26 583 585 7.6 9.6 T5 N 0 P0 WR6 N 0 P0 SR3 4.02 4.46 3.05 3.39 464 470 8.7 9.5 T6 N 20 P60 WR6 N 120 P60 SR3 4.40 4.95 3.35 3.76 587 592 7.5 8.4 T7 N 25 P75 WR6 N 150 P75 SR3 4.83 5.35 3.67 4.07 655 658 7.4 8.1 T8 N 20 P60 WR6 + FYM10 N 120 P60 SR3 5.79 5.89 4.40 4.48 844 847 6.9 7.0 CT Mean 4.48 4.86 3.41 3.69 579 582 7.9 8.5 Conservation agriculture T9 N 0 P0 WR0 N 0 P0 SR0 4.55 4.50 3.46 3.42 476 483 9.6 9.3 T10 N 20 P60 WR0 N 120 P60 SR0 4.73 4.75 3.59 3.61 542 547 8.7 8.7 T11 N 25 P75 WR0 N 150 P75 SR0 4.79 5.03 3.64 3.82 575 579 8.3 8.7 T12 N 20 P60 WR0 + FYM10 N 120 P60 SR0 5.02 5.98 3.82 4.54 618 624 8.1 9.6 T13 N 0 P0 WR6 N 0 P0 SR3 4.90 4.92 3.73 3.74 522 541 9.4 9.1 T14 N 20 P60 WR6 N 120 P60 SR3 4.95 5.07 3.76 3.85 642 648 7.7 7.8 T15 N 25 P75 WR6 N 150 P75 SR3 5.07 5.65 3.85 4.29 683 692 7.4 8.2 T16 N 20 P60 WR6 + FYM10 N 120 P60 SR3 5.30 5.99 4.03 4.56 887 906 6.0 6.6 CA Mean 4.91 5.24 3.73 3.98 618 628 8.2 8.5 Overall mean 4.70 5.05 3.57 3.83 599 605 8.0 8.5 LSD (0.05) Treatment 0.23 0.52 0.16 0.39 13 15 - - Tillage 0.02 ns 0.02 ns 25 20 - - Crop residue 0.15 0.26 0.11 0.20 13 16 - - †N = fertilizer N (kg N ha−1); P = fertilizer P (kg P2O5 ha−1); WR = Wheat crop residue (t·ha−1); ‡SR = Soybean crop residue (t·ha−1); ^FYM = farmyard manure (t·ha−1); ns = non-significant. from 437 to 844 mg·kg−1 and 476 to 887 mg·kg−1 in 0 - 5 cm soil layer under CT and CA system, respectively (Table 3). The further increase in TN after 4 years was negligible. In 0 - 5 cm soil layer, the C/N ratio was 8.8 in control, which became narrower with application of N and P, FYM and CR treatments and narrowest C/N ratio of 6.9 was found in T8 treatment under CT system after 2 cycles. Similarly, in CA system, the C/N ratio was 9.6 in control that reduced to 6.0 in T16 treatment. The overall TOC stock increased over control by 10%, 16% and 23% without CR, and by 19%, 28% and 41% with CR in 0 - 15 cm soil layer of CT system. The corresponding in- crease in TOC stock under CA system over control was by 4.7%, 8.4% and 12.2% without CR and by 12.7%, 15.3% and 19.4% with CR. Of the TOC stocks found in different treatments in 0 - 15 cm surface layer of both CT and CA, 39% to 44% were present in surface 5 cm and only 56% to 61% in next 10 cm depth suggesting de- crease in TOC stocks with soil depth. The treatments T8 and T16 in subsurface layer after 2 cycles leads to 41% 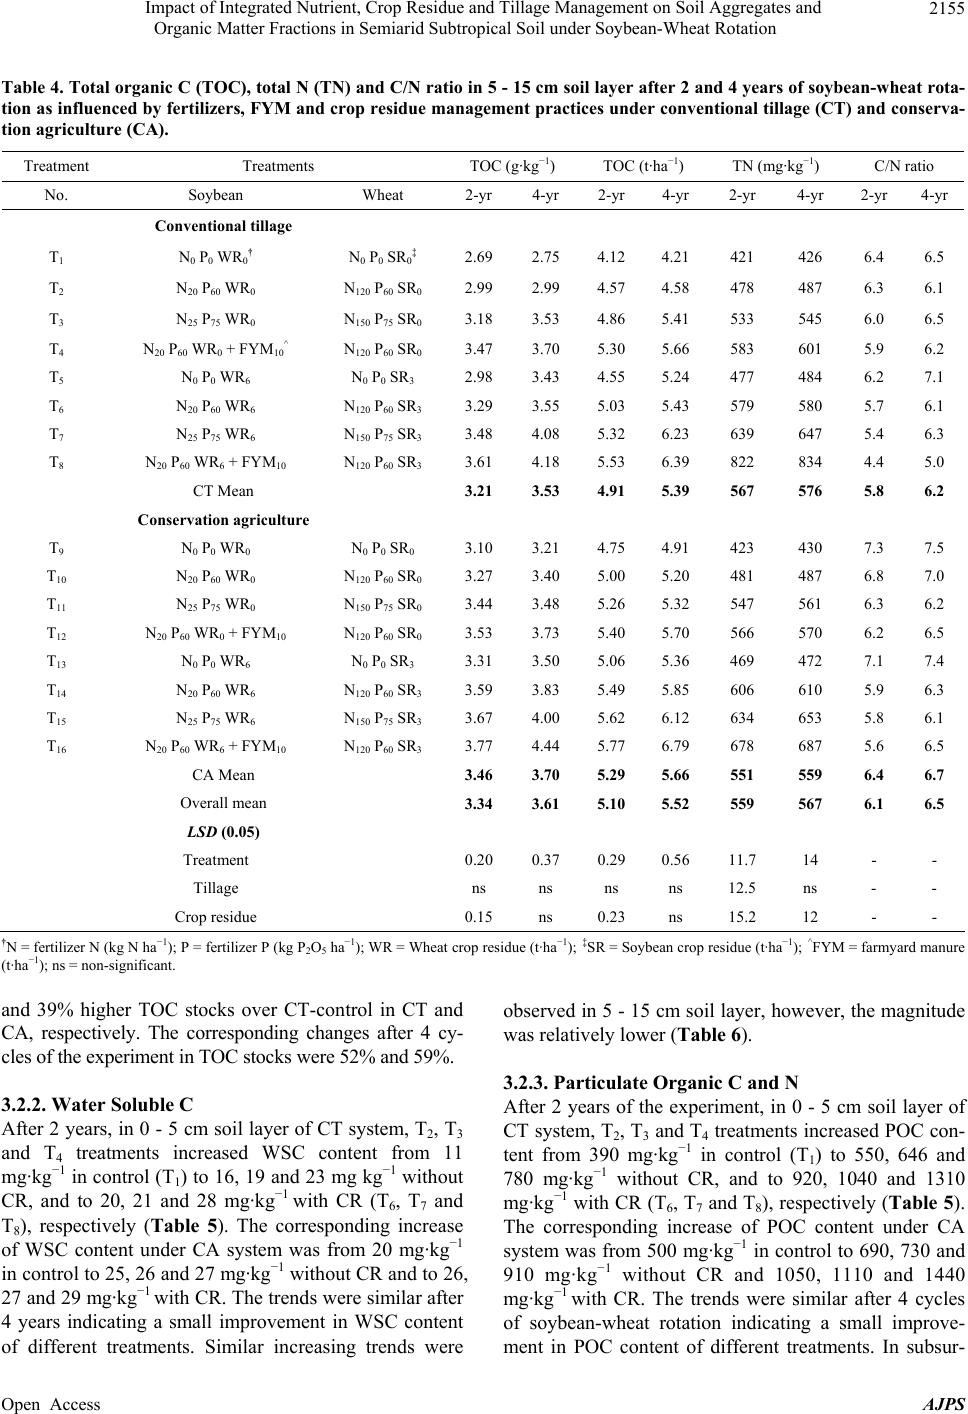 Impact of Integrated Nutrient, Crop Residue and Tillage Management on Soil Aggregates and Organic Matter Fractions in Semiarid Subtropical Soil under Soybean-Wheat Rotation Open Access AJPS 2155 Table 4. Total organic C (TOC), total N (TN) and C/N ratio in 5 - 15 cm soil layer after 2 and 4 years of soybean-wheat rota- tion as influenced by fertilizers, FYM and crop residue management practices under conventional tillage (CT) and conserva- tion agriculture (CA). Treatment Treatments TOC (g·kg−1) TOC (t·ha−1) TN (mg·kg−1) C/N ratio No. Soybean Wheat 2-yr 4-yr 2-yr 4-yr 2-yr 4-yr 2-yr 4-yr Conventional tillage T1 N 0 P0 WR0† N 0 P0 SR0‡ 2.69 2.75 4.12 4.21 421 426 6.4 6.5 T2 N 20 P60 WR0 N 120 P60 SR0 2.99 2.99 4.57 4.58 478 487 6.3 6.1 T3 N 25 P75 WR0 N 150 P75 SR0 3.18 3.53 4.86 5.41 533 545 6.0 6.5 T4 N 20 P60 WR0 + FYM10^ N 120 P60 SR0 3.47 3.70 5.30 5.66 583 601 5.9 6.2 T5 N 0 P0 WR6 N 0 P0 SR3 2.98 3.43 4.55 5.24 477 484 6.2 7.1 T6 N 20 P60 WR6 N 120 P60 SR3 3.29 3.55 5.03 5.43 579 580 5.7 6.1 T7 N 25 P75 WR6 N 150 P75 SR3 3.48 4.08 5.32 6.23 639 647 5.4 6.3 T8 N 20 P60 WR6 + FYM10 N 120 P60 SR3 3.61 4.18 5.53 6.39 822 834 4.4 5.0 CT Mean 3.21 3.53 4.91 5.39 567 576 5.8 6.2 Conservation agriculture T9 N 0 P0 WR0 N 0 P0 SR0 3.10 3.21 4.75 4.91 423 430 7.3 7.5 T10 N 20 P60 WR0 N 120 P60 SR0 3.27 3.40 5.00 5.20 481 487 6.8 7.0 T11 N 25 P75 WR0 N 150 P75 SR0 3.44 3.48 5.26 5.32 547 561 6.3 6.2 T12 N 20 P60 WR0 + FYM10 N 120 P60 SR0 3.53 3.73 5.40 5.70 566 570 6.2 6.5 T13 N 0 P0 WR6 N 0 P0 SR3 3.31 3.50 5.06 5.36 469 472 7.1 7.4 T14 N 20 P60 WR6 N 120 P60 SR3 3.59 3.83 5.49 5.85 606 610 5.9 6.3 T15 N 25 P75 WR6 N 150 P75 SR3 3.67 4.00 5.62 6.12 634 653 5.8 6.1 T16 N 20 P60 WR6 + FYM10 N 120 P60 SR3 3.77 4.44 5.77 6.79 678 687 5.6 6.5 CA Mean 3.46 3.70 5.29 5.66 551 559 6.4 6.7 Overall mean 3.34 3.61 5.10 5.52 559 567 6.1 6.5 LSD (0.05) Treatment 0.20 0.37 0.29 0.56 11.7 14 - - Tillage ns ns ns ns 12.5 ns - - Crop residue 0.15 ns 0.23 ns 15.2 12 - - †N = fertilizer N (kg N ha−1); P = fertilizer P (kg P2O5 ha−1); WR = Wheat crop residue (t·ha−1); ‡SR = Soybean crop residue (t·ha−1); ^FYM = farmyard manure (t·ha−1); ns = non-significant. and 39% higher TOC stocks over CT-control in CT and CA, respectively. The corresponding changes after 4 cy- cles of the experiment in TOC stocks were 52% and 59%. 3.2.2. Water S ol ubl e C After 2 years, in 0 - 5 cm soil layer of CT system, T2, T3 and T4 treatments increased WSC content from 11 mg· k g −1 in control (T1) to 16, 19 and 23 mg kg−1 without CR, and to 20, 21 and 28 mg·kg−1 with CR (T6, T7 and T8), respectively (Table 5). The corresponding increase of WSC content under CA system was from 20 mg·kg−1 in control to 25, 26 and 27 mg·kg−1 without CR and to 26, 27 and 29 mg·kg−1 with CR. The trends were similar after 4 years indicating a small improvement in WSC content of different treatments. Similar increasing trends were observed in 5 - 15 cm soil layer, however, the magnitude was relatively lower (Table 6). 3.2.3. Particulate Organic C and N After 2 years of the experiment, in 0 - 5 cm soil layer of CT system, T2, T3 and T4 treatments increased POC con- tent from 390 mg·kg−1 in control (T1) to 550, 646 and 780 mg·kg−1 without CR, and to 920, 1040 and 1310 mg· k g −1 with CR (T6, T7 and T8), respectively (Table 5). The corresponding increase of POC content under CA system was from 500 mg·kg−1 in control to 690, 730 and 910 mg·kg−1 without CR and 1050, 1110 and 1440 mg· k g −1 with CR. The trends were similar after 4 cycles of soybean-wheat rotation indicating a small improve- ment in POC content of different treatments. In subsur-  Impact of Integrated Nutrient, Crop Residue and Tillage Management on Soil Aggregates and Organic Matter Fractions in Semiarid Subtropical Soil under Soybean-Wheat Rotation Open Access AJPS 2156 Table 5. Water soluble C (WSC), particulate organic C (POC), particulate organic N (PON), light fraction organic C (LFOC), and light fraction organic N (LFON) in 0 - 5 cm soil layer after 2 and 4 years of soybean-wheat rotation as influenced by fer- tilizers, FYM and crop residue management practices under conventional tillage (CT) and conservation agriculture (CA). Treatment No. Treatments WSC (mg·kg−1)POC (mg·kg−1)PON (mg·kg−1)LFOC (mg·kg−1) LFON (mg·kg−1) Soybean Wheat 2-year4-year2-year 4-year 2-year 4-year2-year 4-year 2-year 4-year Conventional tillage T1 N 0 P0 WR0† N 0 P0 SR0‡ 11.012.4390 409 17.417.640.0 41.1 5.6 5.8 T2 N 20 P60 WR0 N 120 P60 SR0 16.216.6550 643 59.561.676.7 79.7 8.6 9.2 T3 N 25 P75 WR0 N 150 P75 SR0 19.020.6646 690 79.980.394.2 94.9 10.0 11.1 T4 N 20 P60 WR0 + FYM10^ N 120 P60 SR0 22.924.0780 839 96.699.1149.1 149.9 13.0 14.0 T5 N 0 P0 WR6 N 0 P0 SR3 12.613.7500 613 19.6 20.362.9 64.2 8.3 8.8 T6 N 20 P60 WR6 N 120 P60 SR3 20.422.1920 964 69.069.293.2 95.5 9.9 10.3 T7 N 25 P75 WR6 N 150 P75 SR3 20.922.61040104589.190.8130.4 134.0 12.6 13.2 T8 N 20 P60 WR6 + FYM10 N 120 P60 SR3 28.425.813101332101.9104.2171.0 171.7 14.1 14.6 CT Mean 18.9 19.7767 817 66.667.9102.2 103.9 10.3 10.9 Conservation agriculture T9 N 0 P0 WR0 N 0 P0 SR0 20.120.9500 511 23.5 23.745.9 48.2 6.2 6.6 T10 N 20 P60 WR0 N 120 P60 SR0 24.724.8690 715 70.470.787.1 88.5 9.4 9.6 T11 N 25 P75 WR0 N 150 P75 SR0 26.126.4730 807 89.391.3121.3 122.7 12.2 12.7 T12 N 20 P60 WR0 + FYM10 N 120 P60 SR0 27.028.2910 942 112.2116.1174.0 176.4 13.7 14.0 T13 N 0 P 0 WR6 N 0 P0 SR3 23.525.2630 699 26.9 27.169.4 70.7 8.7 9.1 T14 N 20 P60 WR6 N 120 P60 SR3 26.228.11050116480.782.5105.1 106.5 10.8 11.5 T15 N 25 P75 WR6 N 150 P75 SR3 27.227.711101262102.9103.9141.0 142.1 13.3 13.7 T16 N 20 P60 WR6 + FYM10 N 120 P60 SR3 29.229.714401452122.2129.4193.5 194.6 14.6 14.9 CA Mean 25.5 26.4882 944 78.580.6 117.2 118.7 11.1 11.5 Overall mean 22.223.1825 880 72.6 74.2109.7 111.3 10.7 11.2 LSD (0.05) Treatment 0.4 2.4 38 66 1.4 3.9 5.3 4.1 0.5 1.0 Tillage 0.8 ns 108 ns 4.8 7.0 12.4 6.7 ns ns Crop residue 0.4 1.7 55 49 2.3 4.3 2.7 3.8 0.5 0.9 †N = fertilizer N (kg N ha−1); P = fertilizer P (kg P2O5 ha−1); WR = Wheat crop residue (t·ha−1); ‡SR = Soybean crop residue (t·ha−1); ^FYM = farmyard manure (t·ha−1); ns = non-significant. face layer, similar increasing trends were observed, however, the magnitude was relatively lower (Table 6). Results on PON content after 2-year showed that in 0-5 cm soil layer of CT system, T2, T3 and T4 treatments in- creased PON content from 17 mg·kg−1 in control (T1) to 60, 80 and 97 mg·kg−1 without CR, and to 69, 89 and 102 mg· k g −1 with CR (T6, T7 and T8) (Table 5). The corre- sponding increase of PON content under CA system was from 23.5 mg·kg−1 in control to 70, 89 and 112 mg·kg−1 without CR and 81, 103 and 122 mg·kg−1 with CR. Small improvement in PON content was observed after 4 years of the experiment. The increasing trends in PON content were observed in subsurface layer, however, the magni- tude was relatively lower (Table 6). 3.2.4. Light Fraction Organic C and N Results on LFOC content in 2-year experiment showed that in 0 - 5 cm soil layer of CT system, T2, T3 and T4 treatments increased LFOC content from 40 mg·kg−1 in control (T1) to 77, 94 and 149 mg·kg−1 without CR, and to 93, 130 and 171 mg·kg−1 with CR (T6, T7 and T8), re- spectively (Table 5). The corresponding increase of  Impact of Integrated Nutrient, Crop Residue and Tillage Management on Soil Aggregates and Organic Matter Fractions in Semiarid Subtropical Soil under Soybean-Wheat Rotation Open Access AJPS 2157 Table 6. Water soluble C (WSC), particulate organic C (POC), particulate organic N (PON), light fraction organic C (LFOC), and light fraction organic N (LFON) in 5 - 15 cm soil layer after 2 and 4 years of soybean-wheat rotation as influenced by fertilizers, FYM and crop residue management practices under conventional tillage (CT) and conservation agriculture (CA). Treatment No. Treatments WSC (mg·kg−1)POC (mg·kg−1)PON (mg·kg−1)LFOC (mg·kg−1) LFON (mg·kg−1) Soybean Wheat 2-year4-year2-year 4-year 2-year 4-year2-year 4-year 2-year 4-year Conventional tillage T1 N 0 P0 WR0† N 0 P0 SR0‡ 8.7 10.2 260 313 15.816.132.3 32.4 5.1 5.6 T2 N 20 P60 WR0 N 120 P60 SR0 10.611.8410 473 47.350.758.2 59.0 7.9 8.1 T3 N 25 P75 WR0 N 150 P75 SR0 12.313.8520 537 67.771.579.3 81.0 10.0 11.5 T4 N 20 P60 WR0 + FYM10^ N 120 P60 SR0 14.116.8600 687 85.386.4128.8 130.0 11.0 11.4 T5 N 0 P0 WR6 N 0 P0 SR3 10.312.2340 380 16.9 17.650.8 52.4 7.4 8.1 T6 N 20 P60 WR6 N 120 P60 SR3 12.913.9590 680 61.367.865.8 66.8 7.1 8.2 T7 N 25 P75 WR6 N 150 P75 SR3 14.817.1650 709 86.187.889.7 90.5 9.6 10.8 T8 N 20 P60 WR6 + FYM10 N 120 P60 SR3 16.419.2710 838 99.6100.5125.2 125.8 10.5 11.2 CT Mean 12.514.4510 577 60.0 62.378.8 79.7 8.6 9.4 Conservation agriculture T9 N 0 P0 WR0 N 0 P0 SR0 10.611.2320 367 20.6 21.337.8 40.1 5.6 5.9 T10 N 20 P60 WR0 N 120 P60 SR0 13.415.7460 531 61.762.369.8 71.0 8.1 8.7 T11 N 25 P75 WR0 N 150 P75 SR0 13.719.1580 617 81.082.0104.0 105.8 11.9 13.7 T12 N 20 P60 WR0 + FYM10 N 120 P60 SR0 20.221.9630 700 108.0109.2157.9 159.4 13.0 13.4 T13 N 0 P0 WR6 N 0 P0 SR3 12.613.3400 440 22.6 23.257.3 59.2 8.0 8.5 T14 N 20 P60 WR6 N 120 P60 SR3 15.116.5660 683 74.374.784.9 86.1 9.3 9.8 T15 N 25 P75 WR6 N 150 P75 SR3 18.520.7710 810 98.799.5109.2 111.9 11.4 12.2 T16 N 20 P60 WR6 + FYM10 N 120 P60 SR3 26.026.4780 827 115.3124.1153.6 154.4 12.3 13.0 CA Mean 16.3 18.1567 622 72.874.696.8 98.5 10.0 10.7 Overall mean 14.416.2539 600 66.4 68.487.8 89.1 9.3 10.0 LSD (0.05) Treatment 0.4 2.4 34 65 1.8 3.2 4.8 3.5 0.5 0.9 Tillage Ns 2.5 ns ns 3.1 3.1 1.3 3.4 0.8 ns Crop residue 0.4 ns 34 74 1.0 2.6 3.9 3.6 0.2 ns †N = fertilizer N (kg N ha−1); P = fertilizer P (kg P2O5 ha−1); WR = Wheat crop residue (t·ha−1); ‡SR = Soybean crop residue (t·ha−1); ^FYM = farmyard manure (t·ha−1); ns = non-significant. LFOC content under CA system was from 45.9 mg·kg−1 in control to 87, 121 and 174 mg·kg−1 without CR and 105, 141 and 194 mg·kg−1 with CR. After 4 years, there was a further increase in LFOC in most of the treatments. The trends were similar after 4 years of soybean-wheat experiment indicating a negligible improvement in LFOC content of different treatments. In 5 - 15 cm layer, the increasing trends in LFOC content due to the applica- tion of N and P fertilizers, FYM and CR were similar to those observed in 0 - 5 cm layer, however, the magnitude was relatively lower (Table 6). Results on LFON content in 2-year experiment showed that in 0 - 5 cm soil layer of CT system, T2, T3 and T4 treatments increased LFON content from 5.6 mg· k g −1 in control (T1) to 8.6, 10.0 and 13.0 mg·kg−1 without CR, and to 9.9, 12.6 and 14.1 mg·kg−1 with CR (T6, T7 and T8), respectively (Table 5). The correspond- ing increase of LFON content under CA system was from 6.2 mg·kg−1 in control to 9.4, 12.2 and 13.7 mg·kg−1 without CR and 10.8, 13.3 and 14.6 mg·kg−1 with CR. After 4 years, there was a small improvement in LFON in most of the treatments. In 5 - 15 cm layer, the increas- ing trends in LFON content due to the application of N and P fertilizers, FYM and CR were similar to those ob- served in 0 - 5 cm layer, however, the magnitude was relatively lower (Table 6). In general, the impact of applied fertilizer, FYM and CR in improving WSC, POC, PON, LFOC and LFON content was significant in 0 - 5 cm soil layer and was substantially higher than in 5 - 15 cm soil layer under  Impact of Integrated Nutrient, Crop Residue and Tillage Management on Soil Aggregates and Organic Matter Fractions in Semiarid Subtropical Soil under Soybean-Wheat Rotation Open Access AJPS 2158 both CA and CT system. 3.3. Soil Biological Properties 3.3.1. Potentially Mineralizable N Results on PMN content after 2 years of the experiment showed that in 0-5 cm soil layer of CT system, T2, T3 and T4 treatments increased PMN content from 2.7 mg·kg−1 7d−1 in control (T1) to 2.9, 3.9 and 5.1 mg·kg−1 7d−1 with- out CR, and to 6.9, 8.4 and 9.7 mg·kg−1 7d−1 with CR (T6, T7 and T8), respectively (Table 7). The corresponding increase of PMN content under CA system was from 3.6 mg· k g −1 7d−1 in control to 3.9, 5.1 and 6.5 mg·kg−1 7d−1 without CR and to 8.9, 10.3 and 12.1 mg·kg−1 7d−1 with CR. The trends were similar after 4 years of soybean- wheat experiment indicating a small improvement in PMN content of different treatments. In 5 - 15 cm layer, the increasing trends due to the application of N and P fertilizers, FYM and CR were similar to those observed in 0 - 5 cm layer, however, the magnitude was relatively lower (Table 7). 3.3.2. Mi cr obial Biomass C and N Results on MBC content after 2 years of the experiment showed that in CT system, T2, T3 and T4 treatments in creased MBC content from 93 mg·kg−1 in control (T1) to 126, 136 and 156 mg·kg−1 without CR, and to 147, 162 Table 7. Potentially mineralizable N (PMN), microbial biomass C (MBC) and microbial biomass N (MBN) in 0 - 5 cm soil layer after 2 and 4 years of soybean-wheat rotation as influenced by fertilizers, FYM and crop residue management practices under conventional tillage (CT) and conservation agriculture (CA). Treatment Treatments PMN (mg·kg−1) MBC (mg·kg−1) MBN (mg·kg−1) No. Soybean Wheat 0 - 5 cm 5 - 15 cm 0 - 5 cm 0 - 5 cm 2-yr4-yr2-yr4-yr2-yr 4-yr 2-yr 4-yr Conventional tillage T1 N 0 P0 WR0† N 0 P0 SR0‡ 2.73.31.41.693 94 5.9 6.3 T2 N 20 P60 WR0 N 120 P60 SR0 2.93.42.93.2126 132 9.5 9.8 T3 N 25 P75 WR0 N 150 P75 SR0 3.94.34.24.4136 140 12.7 13.7 T4 N 20 P60 WR0 + FYM10^ N 120 P60 SR0 5.15.34.95.1156 157 16.0 16.7 T5 N 0 P0 WR6 N 0 P0 SR3 3.33.41.81.9118 126 7.0 7.2 T6 N 20 P60 WR6 N 120 P60 SR3 6.97.15.96.2147 149 12.9 13.2 T7 N 25 P75 WR6 N 150 P75 SR3 8.48.77.17.5162 189 17.6 18.1 T8 N 20 P60 WR6 + FYM10 N 120 P60 SR3 9.710.49.39.6202 196 24.3 25.1 CT Mean 5.45.74.74.9143 148 13.2 13.7 Conservation agriculture T9 N 0 P0 WR0 N 0 P0 SR0 3.63.81.51.8116 119 6.4 6.8 T10 N 20 P60 WR0 N 120 P60 SR0 3.94.02.32.4142 143 10.4 10.6 T11 N 25 P75 WR0 N 150 P75 SR0 5.15.44.04.1153 155 15.6 16.2 T12 N 20 P60 WR0 + FYM10 N 120 P60 SR0 6.57.15.55.8170 171 16.8 17.1 T13 N 0 P0 WR6 N 0 P0 SR3 4.24.82.83.1139 140 7.2 7.9 T14 N 20 P60 WR6 N 120 P60 SR3 8.99.55.96.8159 162 15.4 16.0 T15 N 25 P75 WR6 N 150 P75 SR3 10.311.08.48.7168 193 20.5 22.7 T16 N 20 P60 WR6 + FYM10 N 120 P60 SR3 12.112.910.711.4227 215 27.3 26.1 CA Mean 6.87.35.15.5159 162 15.0 15.4 Overall mean 6.16.54.95.2151 155 14.1 14.6 LSD (0.05) Treatment 0.60.60.40.55.5 6.0 0.5 0.8 Tillage nsnsns ns 10.9 10.8 1.1 0.7 Crop residue 0.40.60.70.75.7 6.8 0.6 0.3 †N = fertilizer N (kg N ha−1); P = fertilizer P (kg P2O5 ha−1); WR = Wheat crop residue (t·ha−1); ‡SR = Soybean crop residue (t·ha−1); ^FYM = farmyard manure (t·ha−1); ns = non-significant.  Impact of Integrated Nutrient, Crop Residue and Tillage Management on Soil Aggregates and Organic Matter Fractions in Semiarid Subtropical Soil under Soybean-Wheat Rotation Open Access AJPS 2159 and 202 mg·kg−1 with CR (T6, T7 and T8), respectively (Table 7). The corresponding increase of MBC content under CA system was from 116 mg·kg−1 in control to 142, 153 and 170 mg·kg−1 without CR and to 159, 168 and 227 mg·kg−1 with CR. Similar trends were observed after 4 years indicating a small improvement in MBC content of different treatments. Results on MBN content after 2 years showed that in CT system, T2, T3 and T4 treatments increased MBN content from 5.9 mg·kg−1 in control (T1) to 9.5, 12.7 and 16.0 mg·kg−1 without CR, and to 12.9, 17.6 and 24.3 mg·kg−1 with CR (T6, T7 and T8), respec- tively (Table 7). The corresponding increase of MBN content under CA system was from 6.4 mg·kg−1 in con- trol to 10.4, 15.6 and 16.8 mg·kg−1 without CR and to 15.4, 20.5 and 27.3 mg·kg−1 with CR. Maximum MBN contents were found in T8 and T16 treatments plots of both CT and CA systems. 3.3.3. Proporti o n of Labile Organic C and N Fractions in Total Organic C and Total N After 2 years of the experiment, WSC accounted for 0.29% to 0.52% and 0.44% to 0.55% of TOC in different treatments of CT and CA system, respectively in 0 - 5 cm soil layer (Table 8). While POC accounted for 10.2% to 22.6% and 11.0% to 27.2%, the proportion of LFOC ranged from 1.0% to 3.3% and 1.0% to 3.6% of TOC, respectively in CT and CA system. In 5 - 15 cm layer, the trends of WSC, POC and LFOC in TOC due to the application of N and P fertilizers, FYM and CR were similar to those observed in 0 - 5 cm layer (Table 9). The proportion of MBC ranged from 2.4% to 3.5% under CT and 2.5% to 4.3% of TOC under CA system, which showed gradual increase with the application of N and P, FYM and CR treatments (Table 10) and was maximum in N20 P 60 WR6 + FYM10 treatment under both tillage systems. After 4 years, there were minor changes in the proportion of different labile C fractions in TOC. PON accounted for 4.0% to 18.2% of TN content in 0 - 5 cm soil layer under both CT and CA system after 2 years of experimentation (Table 8). The MBN content ranged from 1.4% to 2.9% and 1.4% to 3.1% of TN in CT and CA system, respectively. The proportion of both PMN and MBN gradually increased with the application of N and P, FYM and CR treatments. While the propor- tion of PMN was highest in T7 and T15 treatments, MBN was highest in T8 and T16 treatment under CT and CA systems respectively after 2 years of the experiment (Ta- ble 10). 4. Discussion Application of FYM enhances the soil organic C content (SOC) and has direct and indirect effects on soil proper- ties and processes. There was a significant improvement in water stable aggregation and proportion of macro-ag- gregates, SOC content, labile C and N fractions such as water soluble C, particulate and light fraction organic matter, potentially mineralizable N and microbial bio- mass with the application of 10 t FYM ha−1 along with recommended rate of NP to soybean. After 2 years of the experiment, total WSA in 0 - 5 cm soil layer increased from 71% in control (T1) to a maxi- mum of 83 (T8) and 85% (T16) treatments in CT and CA, respectively with the addition of FYM and incorporation of crop residues (Figure 1). Likewise, the increase in total WSA was from 62% in control to 77 and 81%, re- spectively in 5 - 15 cm layer (Figure 2), indicating the beneficial effect of integrated use of inorganic fertilizers and organic materials on the formation of aggregates over the unmanured treatments. The effects were similar after 4 years of experiment with further improvement in WSA, and the effect of tillage was statistically significant. The CA system causes less disturbance of soil and retains CR on soil surface than CT system, which could enhance and protect SOM content and improve soil structure. TOC and TN contents of 0 - 5 cm surface soil layer significantly improved with N and P, FYM and CR under both CT and CA systems. After 4 years of study, maxi- mum TOC content was recorded in T8 and T16 treatments, which was 5.89 and 5.99 g·kg−1 in 0 - 5 cm and 4.18 and 4.44 g·kg−1 in 5 - 15 cm soil layer in CT and CA, respec- tively (Tables 3 and 4). Integrated use of inorganic fer- tilizers, FYM and CR significantly improved both TOC content and stock. The beneficial effects were more pro- nounced in 0 - 5 cm surface layer than 5 - 15 cm subsur- face soil layer. Conservation tillage resulted in signifi- cantly higher TOC than CT. The narrowest C/N ratio of 6.9 and 6.0 was found in 0 - 5 cm in N20P60WR6 + FYM10 – N120P60SR3 treatment of CT and CA system, respec- tively indicating improvement in N supplying capability of soil as the plant materials and residues in the soil de- compose rapidly at narrow C/N ratio and convert un- available plant nutrients to available form [14]. These results are in conformity with Hao et al. [15] who ob- served that application of inorganic fertilizer alone did not significantly improve TOC content as compared to the control while the application of inorganic fertilizer along with manure or straw significantly increased TOC content. Kaur et al. [16] reported that continuous crop- ping with and without use of chemical fertilizers and FYM resulted in the improvement of TOC content in a long-term CT experiment. While intensive tillage prac- tices enhance the decomposition of SOM, no-till prac- tices generally enhance the TOC concentration in surface soil. No-till provides greater physical protection to TOC within macro-aggregate protected TOC than with CT but mostly at soil surface [17]. The higher TOC content and 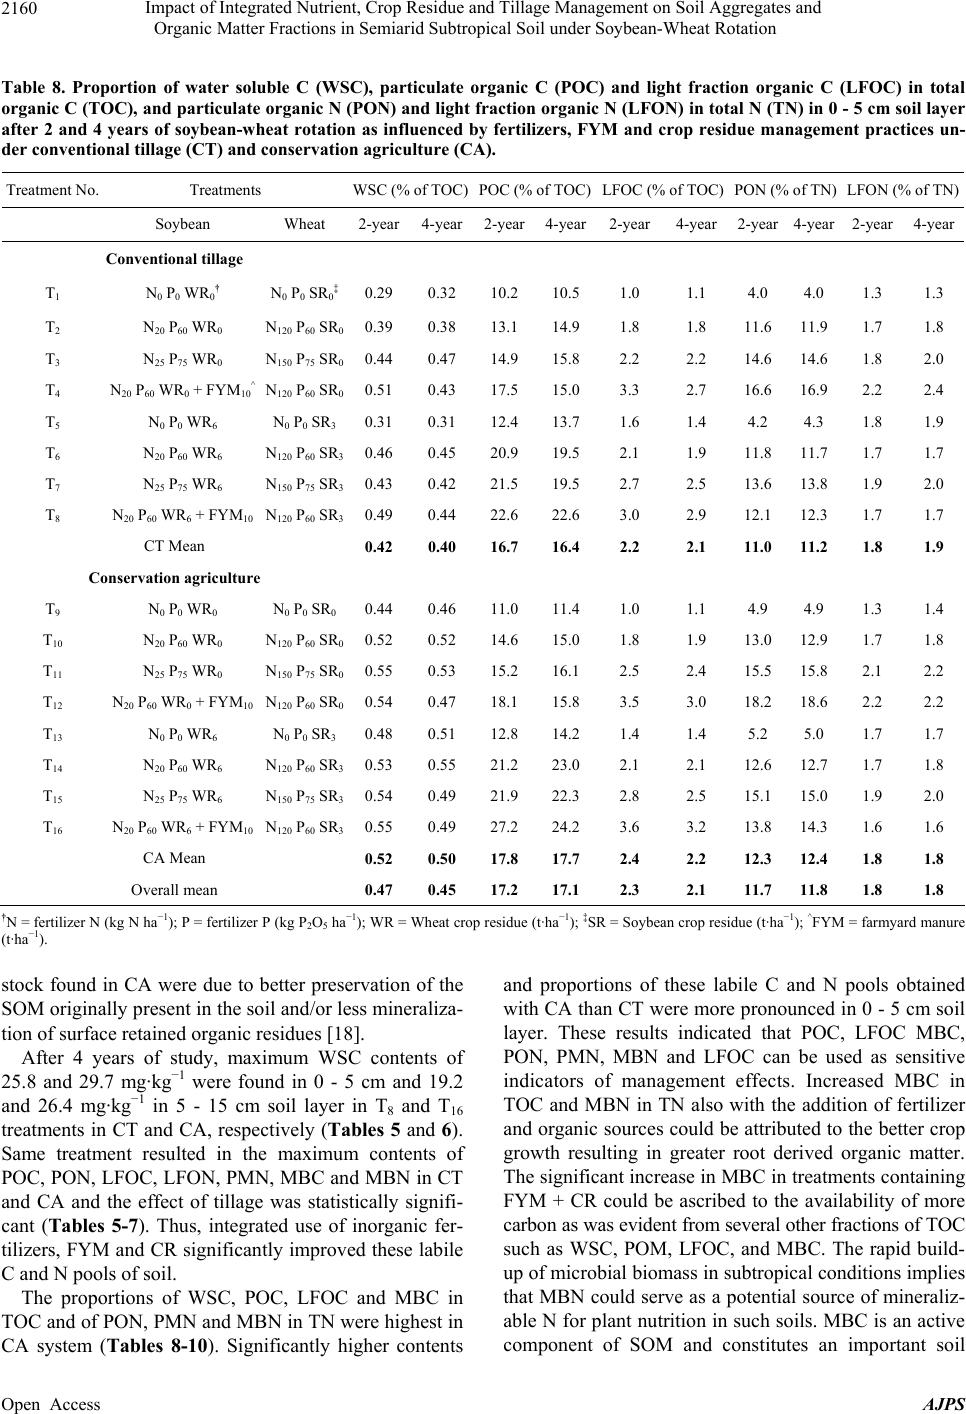 Impact of Integrated Nutrient, Crop Residue and Tillage Management on Soil Aggregates and Organic Matter Fractions in Semiarid Subtropical Soil under Soybean-Wheat Rotation Open Access AJPS 2160 Table 8. Proportion of water soluble C (WSC), particulate organic C (POC) and light fraction organic C (LFOC) in total organic C (TOC), and particulate organic N (PON) and light fraction organic N (LFON) in total N (TN) in 0 - 5 cm soil layer after 2 and 4 years of soybean-wheat rotation as influenced by fertilizers, FYM and crop residue management practices un- der conventional tillage (CT) and conservation agriculture (CA). Treatment No. Treatments WSC (% of TOC)POC (% of TOC)LFOC (% of TOC)PON (% of TN) LFON (% of TN) Soybean Wheat 2-year4-year2-year 4-year2-year4-year2-year 4-year 2-year4-year Conventional tillage T1 N 0 P0 WR0† N 0 P0 SR0‡ 0.29 0.32 10.2 10.5 1.0 1.1 4.0 4.0 1.3 1.3 T2 N 20 P60 WR0 N 120 P60 SR0 0.39 0.38 13.1 14.9 1.8 1.8 11.6 11.9 1.7 1.8 T3 N 25 P75 WR0 N 150 P75 SR0 0.44 0.47 14.9 15.8 2.2 2.2 14.6 14.6 1.8 2.0 T4 N 20 P60 WR0 + FYM10^N120 P60 SR0 0.51 0.43 17.5 15.0 3.3 2.7 16.6 16.9 2.2 2.4 T5 N 0 P0 WR6 N 0 P0 SR3 0.31 0.31 12.4 13.7 1.6 1.4 4.2 4.3 1.8 1.9 T6 N 20 P60 WR6 N 120 P60 SR3 0.46 0.45 20.9 19.5 2.1 1.9 11.8 11.7 1.7 1.7 T7 N 25 P75 WR6 N 150 P75 SR3 0.43 0.42 21.5 19.5 2.7 2.5 13.6 13.8 1.9 2.0 T8 N 20 P60 WR6 + FYM10 N120 P60 SR3 0.49 0.44 22.6 22.6 3.0 2.9 12.1 12.3 1.7 1.7 CT Mean 0.42 0.40 16.7 16.4 2.2 2.1 11.0 11.2 1.8 1.9 Conservation agriculture T9 N 0 P0 WR0 N 0 P0 SR0 0.44 0.46 11.0 11.4 1.0 1.1 4.9 4.9 1.3 1.4 T10 N 20 P60 WR0 N 120 P60 SR0 0.52 0.52 14.6 15.0 1.8 1.9 13.0 12.9 1.7 1.8 T11 N 25 P75 WR0 N 150 P75 SR0 0.55 0.53 15.2 16.1 2.5 2.4 15.5 15.8 2.1 2.2 T12 N 20 P60 WR0 + FYM10 N120 P60 SR0 0.54 0.47 18.1 15.8 3.5 3.0 18.2 18.6 2.2 2.2 T13 N 0 P0 WR6 N 0 P0 SR3 0.48 0.51 12.8 14.2 1.4 1.4 5.2 5.0 1.7 1.7 T14 N 20 P60 WR6 N 120 P60 SR3 0.53 0.55 21.2 23.0 2.1 2.1 12.6 12.7 1.7 1.8 T15 N 25 P75 WR6 N 150 P75 SR3 0.54 0.49 21.9 22.3 2.8 2.5 15.1 15.0 1.9 2.0 T16 N 20 P60 WR6 + FYM10 N120 P60 SR3 0.55 0.49 27.2 24.2 3.6 3.2 13.8 14.3 1.6 1.6 CA Mean 0.52 0.50 17.8 17.7 2.4 2.2 12.3 12.4 1.8 1.8 Overall mean 0.47 0.45 17.2 17.1 2.3 2.1 11.7 11.8 1.8 1.8 †N = fertilizer N (kg N ha−1); P = fertilizer P (kg P2O5 ha−1); WR = Wheat crop residue (t·ha−1); ‡SR = Soybean crop residue (t·ha−1); ^FYM = farmyard manure (t·ha−1). stock found in CA were due to better preservation of the SOM originally present in the soil and/or less mineraliza- tion of surface retained organic residues [18]. After 4 years of study, maximum WSC contents of 25.8 and 29.7 mg·kg−1 were found in 0 - 5 cm and 19.2 and 26.4 mg·kg−1 in 5 - 15 cm soil layer in T8 and T16 treatments in CT and CA, respectively (Tables 5 and 6). Same treatment resulted in the maximum contents of POC, PON, LFOC, LFON, PMN, MBC and MBN in CT and CA and the effect of tillage was statistically signifi- cant (Tables 5-7). Thus, integrated use of inorganic fer- tilizers, FYM and CR significantly improved these labile C and N pools of soil. The proportions of WSC, POC, LFOC and MBC in TOC and of PON, PMN and MBN in TN were highest in CA system (Tables 8-10). Significantly higher contents and proportions of these labile C and N pools obtained with CA than CT were more pronounced in 0 - 5 cm soil layer. These results indicated that POC, LFOC MBC, PON, PMN, MBN and LFOC can be used as sensitive indicators of management effects. Increased MBC in TOC and MBN in TN also with the addition of fertilizer and organic sources could be attributed to the better crop growth resulting in greater root derived organic matter. The significant increase in MBC in treatments containing FYM + CR could be ascribed to the availability of more carbon as was evident from several other fractions of TOC such as WSC, POM, LFOC, and MBC. The rapid build- up of microbial biomass in subtropical conditions implies that MBN could serve as a potential source of mineraliz- able N for plant nutrition in such soils. MBC is an active component of SOM and constitutes an important soil 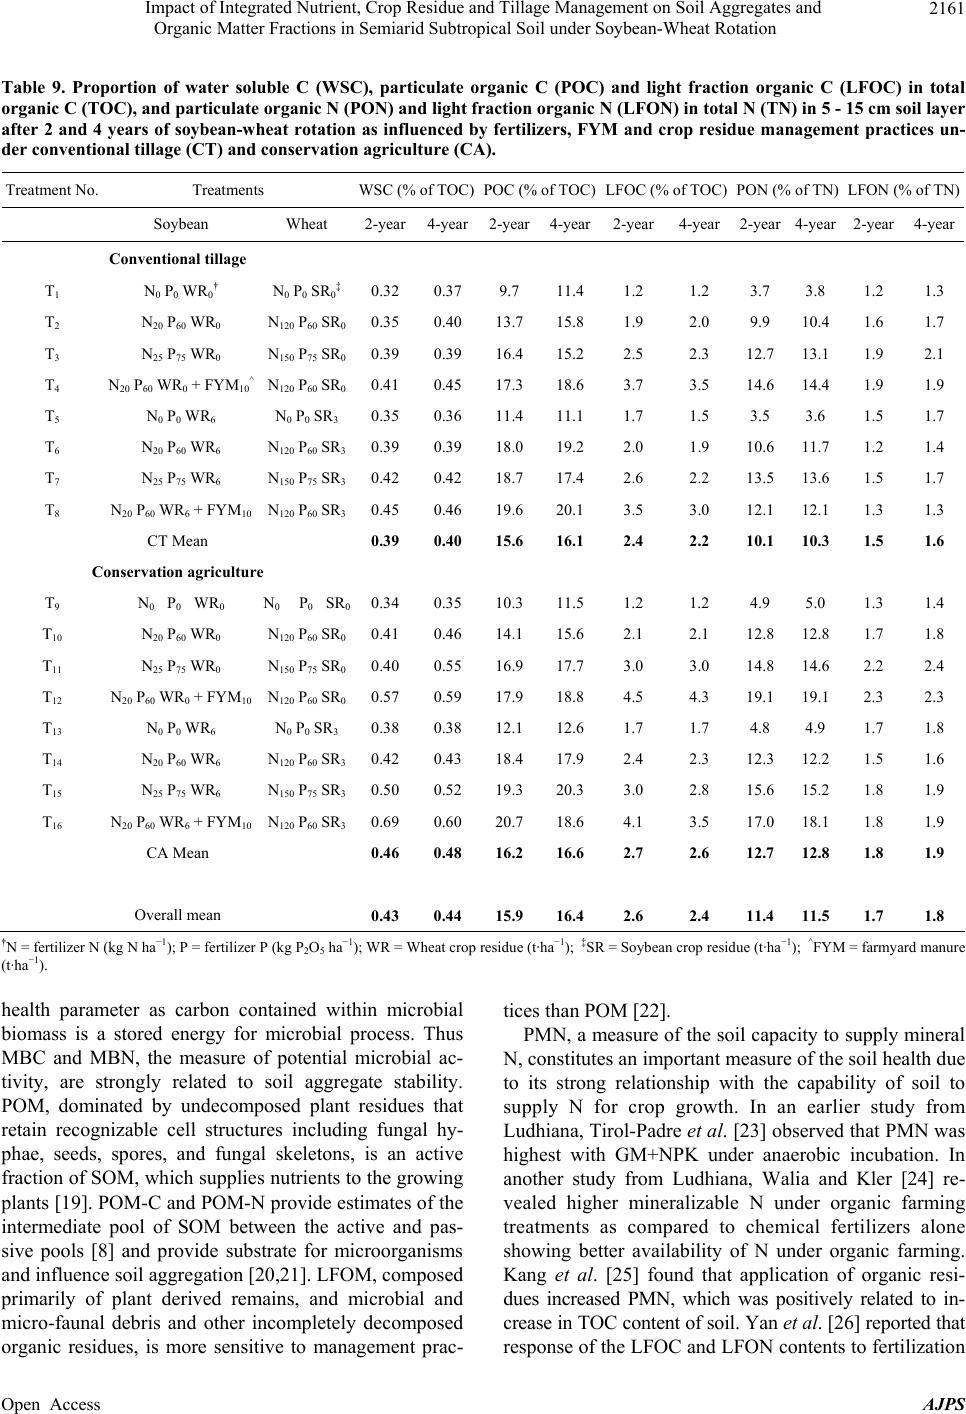 Impact of Integrated Nutrient, Crop Residue and Tillage Management on Soil Aggregates and Organic Matter Fractions in Semiarid Subtropical Soil under Soybean-Wheat Rotation Open Access AJPS 2161 Table 9. Proportion of water soluble C (WSC), particulate organic C (POC) and light fraction organic C (LFOC) in total organic C (TOC), and particulate organic N (PON) and light fraction organic N (LFON) in total N (TN) in 5 - 15 cm soil layer after 2 and 4 years of soybean-wheat rotation as influenced by fertilizers, FYM and crop residue management practices un- der conventional tillage (CT) and conservation agriculture (CA). Treatment No. Treatments WSC (% of TOC)POC (% of TOC)LFOC (% of TOC)PON (% of TN) LFON (% of TN) Soybean Wheat 2-year4-year2-year4-year2-year4-year2-year 4-year 2-year4-year Conventional tillage T1 N 0 P0 WR0† N 0 P0 SR0‡ 0.32 0.37 9.7 11.4 1.2 1.2 3.7 3.8 1.2 1.3 T2 N 20 P60 WR0 N 120 P60 SR0 0.35 0.40 13.7 15.8 1.9 2.0 9.9 10.4 1.6 1.7 T3 N 25 P75 WR0 N 150 P75 SR0 0.39 0.39 16.4 15.2 2.5 2.3 12.7 13.1 1.9 2.1 T4 N 20 P60 WR0 + FYM10^N120 P60 SR0 0.41 0.45 17.3 18.6 3.7 3.5 14.6 14.4 1.9 1.9 T5 N 0 P0 WR6 N 0 P0 SR3 0.35 0.36 11.4 11.1 1.7 1.5 3.5 3.6 1.5 1.7 T6 N 20 P60 WR6 N 120 P60 SR3 0.39 0.39 18.0 19.2 2.0 1.9 10.6 11.7 1.2 1.4 T7 N 25 P75 WR6 N 150 P75 SR3 0.42 0.42 18.7 17.4 2.6 2.2 13.5 13.6 1.5 1.7 T8 N 20 P60 WR6 + FYM10 N120 P60 SR3 0.45 0.46 19.6 20.1 3.5 3.0 12.1 12.1 1.3 1.3 CT Mean 0.39 0.40 15.6 16.1 2.4 2.2 10.1 10.3 1.5 1.6 Conservation agriculture T9 N 0 P 0 WR0 N 0 P 0 SR 0 0.34 0.35 10.3 11.5 1.2 1.2 4.9 5.0 1.3 1.4 T10 N 20 P60 WR0 N 120 P60 SR0 0.41 0.46 14.1 15.6 2.1 2.1 12.8 12.8 1.7 1.8 T11 N 25 P75 WR0 N 150 P75 SR0 0.40 0.55 16.9 17.7 3.0 3.0 14.8 14.6 2.2 2.4 T12 N 20 P60 WR0 + FYM10 N120 P60 SR0 0.57 0.59 17.9 18.8 4.5 4.3 19.1 19.1 2.3 2.3 T13 N 0 P0 WR6 N 0 P0 SR3 0.38 0.38 12.1 12.6 1.7 1.7 4.8 4.9 1.7 1.8 T14 N 20 P60 WR6 N 120 P60 SR3 0.42 0.43 18.4 17.9 2.4 2.3 12.3 12.2 1.5 1.6 T15 N 25 P75 WR6 N 150 P75 SR3 0.50 0.52 19.3 20.3 3.0 2.8 15.6 15.2 1.8 1.9 T16 N 20 P60 WR6 + FYM10 N120 P60 SR3 0.69 0.60 20.7 18.6 4.1 3.5 17.0 18.1 1.8 1.9 CA Mean 0.46 0.48 16.2 16.6 2.7 2.6 12.7 12.8 1.8 1.9 Overall mean 0.43 0.44 15.9 16.4 2.6 2.4 11.4 11.5 1.7 1.8 †N = fertilizer N (kg N ha−1); P = fertilizer P (kg P2O5 ha−1); WR = Wheat crop residue (t·ha−1); ‡SR = Soybean crop residue (t·ha−1); ^FYM = farmyard manure (t·ha−1). health parameter as carbon contained within microbial biomass is a stored energy for microbial process. Thus MBC and MBN, the measure of potential microbial ac- tivity, are strongly related to soil aggregate stability. POM, dominated by undecomposed plant residues that retain recognizable cell structures including fungal hy- phae, seeds, spores, and fungal skeletons, is an active fraction of SOM, which supplies nutrients to the growing plants [19]. POM-C and POM-N provide estimates of the intermediate pool of SOM between the active and pas- sive pools [8] and provide substrate for microorganisms and influence soil aggregation [20,21]. LFOM, composed primarily of plant derived remains, and microbial and micro-faunal debris and other incompletely decomposed organic residues, is more sensitive to management prac- tices than POM [22]. PMN, a measure of the soil capacity to supply mineral N, constitutes an important measure of the soil health due to its strong relationship with the capability of soil to supply N for crop growth. In an earlier study from Ludhiana, Tirol-Padre et al. [23] observed that PMN was highest with GM+NPK under anaerobic incubation. In another study from Ludhiana, Walia and Kler [24] re- vealed higher mineralizable N under organic farming treatments as compared to chemical fertilizers alone showing better availability of N under organic farming. Kang et al. [25] found that application of organic resi- dues increased PMN, which was positively related to in- crease in TOC content of soil. Yan et al. [26] reported that response of the LFOC and LFON contents to fertilization 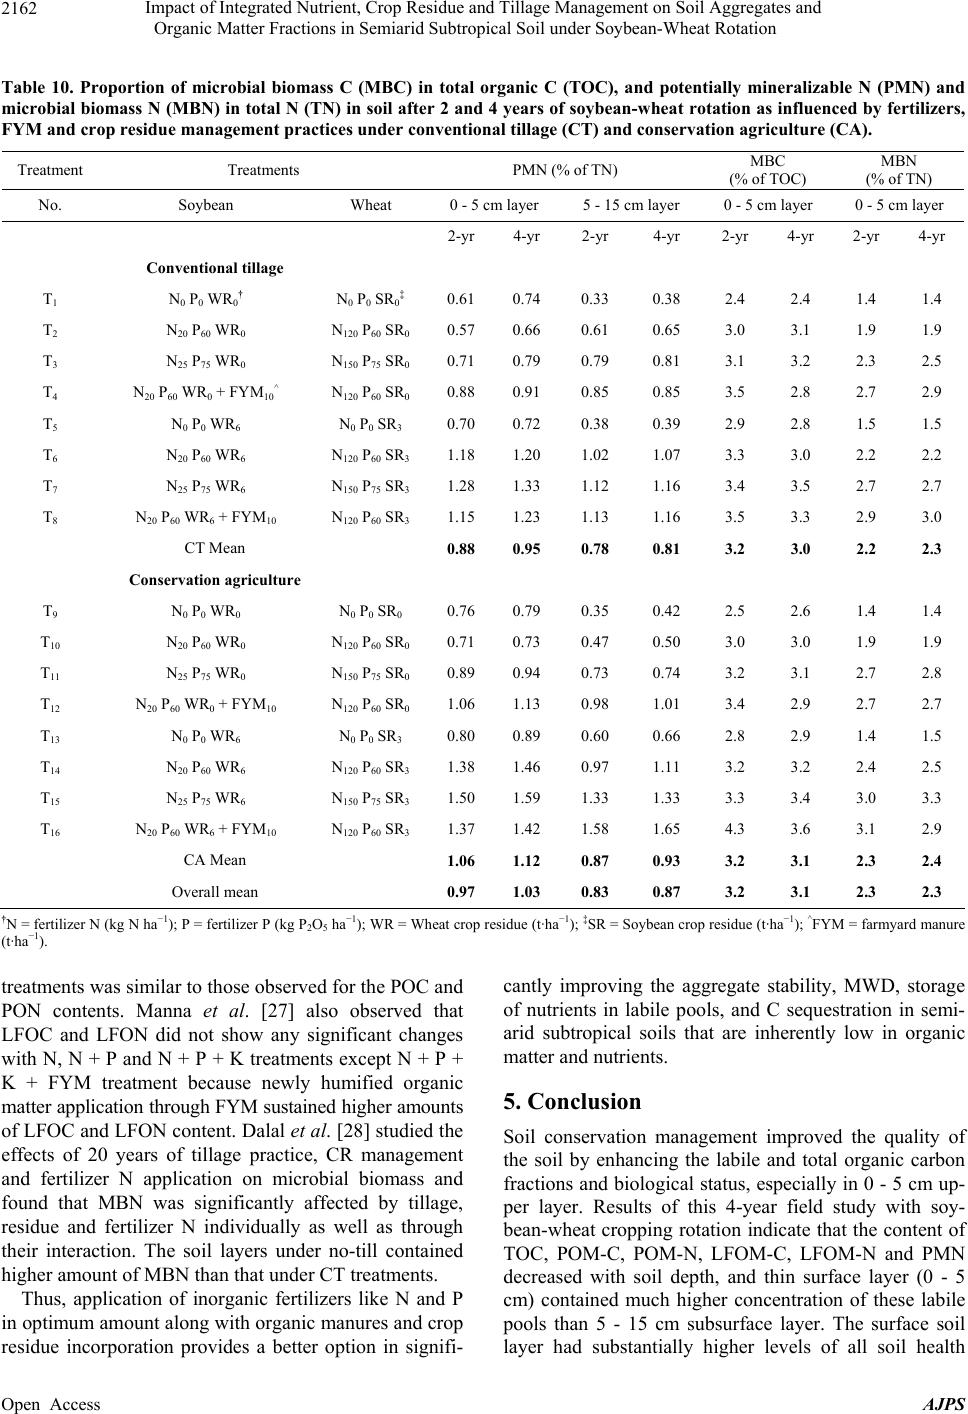 Impact of Integrated Nutrient, Crop Residue and Tillage Management on Soil Aggregates and Organic Matter Fractions in Semiarid Subtropical Soil under Soybean-Wheat Rotation Open Access AJPS 2162 Table 10. Proportion of microbial biomass C (MBC) in total organic C (TOC), and potentially mineralizable N (PMN) and microbial biomass N (MBN) in total N (TN) in soil after 2 and 4 years of soybean-wheat rotation as influenced by fertilizers, FYM and crop residue management practices under conventional tillage (CT) and conservation agriculture (CA). Treatment Treatments PMN (% of TN) MBC (% of TOC) MBN (% of TN) No. Soybean Wheat 0 - 5 cm layer 5 - 15 cm layer 0 - 5 cm layer 0 - 5 cm layer 2-yr 4-yr 2-yr 4-yr 2-yr 4-yr 2-yr 4-yr Conventional tillage T1 N 0 P0 WR0† N 0 P0 SR0‡ 0.61 0.74 0.33 0.38 2.4 2.4 1.4 1.4 T2 N 20 P60 WR0 N 120 P60 SR0 0.57 0.66 0.61 0.65 3.0 3.1 1.9 1.9 T3 N 25 P75 WR0 N 150 P75 SR0 0.71 0.79 0.79 0.81 3.1 3.2 2.3 2.5 T4 N 20 P60 WR0 + FYM10^ N 120 P60 SR0 0.88 0.91 0.85 0.85 3.5 2.8 2.7 2.9 T5 N 0 P0 WR6 N 0 P0 SR3 0.70 0.72 0.38 0.39 2.9 2.8 1.5 1.5 T6 N 20 P60 WR6 N 120 P60 SR3 1.18 1.20 1.02 1.07 3.3 3.0 2.2 2.2 T7 N 25 P75 WR6 N 150 P75 SR3 1.28 1.33 1.12 1.16 3.4 3.5 2.7 2.7 T8 N 20 P60 WR6 + FYM10 N 120 P60 SR3 1.15 1.23 1.13 1.16 3.5 3.3 2.9 3.0 CT Mean 0.88 0.95 0.78 0.81 3.2 3.0 2.2 2.3 Conservation agriculture T9 N 0 P0 WR0 N 0 P0 SR0 0.76 0.79 0.35 0.42 2.5 2.6 1.4 1.4 T10 N 20 P60 WR0 N 120 P60 SR0 0.71 0.73 0.47 0.50 3.0 3.0 1.9 1.9 T11 N 25 P75 WR0 N 150 P75 SR0 0.89 0.94 0.73 0.74 3.2 3.1 2.7 2.8 T12 N 20 P60 WR0 + FYM10 N 120 P60 SR0 1.06 1.13 0.98 1.01 3.4 2.9 2.7 2.7 T13 N 0 P0 WR6 N 0 P0 SR3 0.80 0.89 0.60 0.66 2.8 2.9 1.4 1.5 T14 N 20 P60 WR6 N 120 P60 SR3 1.38 1.46 0.97 1.11 3.2 3.2 2.4 2.5 T15 N 25 P75 WR6 N 150 P75 SR3 1.50 1.59 1.33 1.33 3.3 3.4 3.0 3.3 T16 N 20 P60 WR6 + FYM10 N 120 P60 SR3 1.37 1.42 1.58 1.65 4.3 3.6 3.1 2.9 CA Mean 1.06 1.12 0.87 0.93 3.2 3.1 2.3 2.4 Overall mean 0.97 1.03 0.83 0.87 3.2 3.1 2.3 2.3 †N = fertilizer N (kg N ha−1); P = fertilizer P (kg P2O5 ha−1); WR = Wheat crop residue (t·ha−1); ‡SR = Soybean crop residue (t·ha−1); ^FYM = farmyard manure (t·ha−1). treatments was similar to those observed for the POC and PON contents. Manna et al. [27] also observed that LFOC and LFON did not show any significant changes with N, N + P and N + P + K treatments except N + P + K + FYM treatment because newly humified organic matter application through FYM sustained higher amounts of LFOC and LFON content. Dalal et al. [28] studied the effects of 20 years of tillage practice, CR management and fertilizer N application on microbial biomass and found that MBN was significantly affected by tillage, residue and fertilizer N individually as well as through their interaction. The soil layers under no-till contained higher amount of MBN than that under CT treatments. Thus, application of inorganic fertilizers like N and P in optimum amount along with organic manures and crop residue incorporation provides a better option in signifi- cantly improving the aggregate stability, MWD, storage of nutrients in labile pools, and C sequestration in semi- arid subtropical soils that are inherently low in organic matter and nutrients. 5. Conclusion Soil conservation management improved the quality of the soil by enhancing the labile and total organic carbon fractions and biological status, especially in 0 - 5 cm up- per layer. Results of this 4-year field study with soy- bean-wheat cropping rotation indicate that the content of TOC, POM-C, POM-N, LFOM-C, LFOM-N and PMN decreased with soil depth, and thin surface layer (0 - 5 cm) contained much higher concentration of these labile pools than 5 - 15 cm subsurface layer. The surface soil layer had substantially higher levels of all soil health  Impact of Integrated Nutrient, Crop Residue and Tillage Management on Soil Aggregates and Organic Matter Fractions in Semiarid Subtropical Soil under Soybean-Wheat Rotation Open Access AJPS 2163 parameters than subsurface layer, presumably due to higher retention of crop stubbles, fallen leaves and root biomass. The enhanced proportions of WSC, POM-C, LFOM-C, MBC in TOC and that of POM-N, LFOM-N, MBN in TN with the supply of optimum and balanced N, P and organic manures and incorporation of crop resi- dues indicate that the improvement in labile forms of both C and N was relatively rapid than control suggesting that active C and N pools reflect changes due to inte- grated nutrient management (INM). INM significantly increased water stable aggregates and had profound ef- fects in increasing the mean weight diameter as well as the formation of macro-aggregates, which were highest in both surface (85%) and subsurface (81%) soil layers with application of 20 kg N + 60 kg P2O5 + 10 t FYM + 6 t WR ha−1 applied to soybean and 120 kg N + 60 kg P2O5 + 3 t SR ha−1 applied to wheat crops in CA (T16) and re- spectively, 83% and 77% in CT (T8) treatments after 2 cycles of the experiment. Similarly, the content and stock of TOC and contents of POM-C, LFOC-C, PMN, MBC and MBN were highest with the INM. Thus, application of fertilizer in optimum amounts and inclusion of manure in the fertilizer schedule could maintain the soil health under intensive agriculture. In conclusion, INM plays a significant role in building-up/restoring soil health and productivity with co-benefits of improved C sequestra- tion in semiarid subtropical soils inherently low in or- ganic matter and nutrients. 6. Acknowledgements The financial support provided by FAO/IAEA Coordi- nated Research Project D15009 on “Integrated soil, water and nutrient management for conservation agriculture”, through Research Contract No. IND/12980 is gratefully acknowledged by the authors. REFERENCES [1] R. T. Conant, M. Easter, K. Paustian, A. Swan and S. Williams, “Impacts of Periodic Tillage on Soil C Stocks: A Synthesis,” Soil Tillage and Research, Vol. 95, No. 1-2, 2007, pp. 1-10. http://dx.doi.org/10.1016/j.still.2006.12.006 [2] S. Kumar, M. S. Aulakh and A. K. Garg, “Soil Aggregates, Organic Matter, and Labile C and N Fractions after 37 Years of N, P and K Applications to an Irrigated Sub- tropical Soil under Maize-Wheat Rotation,” Journal of Agricultural Science and Technology, Vol. 1, No. 2A, 2011, pp. 170-181. [3] K. K. M. Nambiar, “Major Cropping Systems in India,” In: Barnett, et al., Eds., Agricultural Sustainability: Eco- nomics, Environmental and Statistical Considerations, John Wiley & Sons, Chichester, 1995, pp. 135-142. [4] M. S. Aulakh, N. S. Pasricha and G. S. Bahl, “Phosphorus Fertilizer Response in an Irrigated Soybean-Wheat Pro- duction System on a Subtropical, Semiarid Soil,” Field Crops Research, Vol. 80, No. 2, 2003, pp. 99-109. http://dx.doi.org/10.1016/S0378-4290(02)00172-7 [5] M. S. Aulakh, J. S. Manchanda, A. K. Garg, S. Kumar, G. Dercon and M. L. Nguyen, “Crop production and Nutrient Use Efficiency of Conservation Agriculture for Soybean- Wheat Rotation in the Indo-Gangetic Plains of North- western India,” Soil Tillage and Research, Vol. 120, 2012, pp. 50-60. http://dx.doi.org/10.1016/j.still.2011.11.001 [6] R. E. Yoder, “A Direct Method of Aggregate Analysis of Soils and a Study of the Physical Nature of Soil Erosion Losses,” Journal of American Society of Agronomy, Vol. 28, No. 5, 1936, pp. 337-351. http://dx.doi.org/10.2134/agronj1936.0002196200280005 0001x [7] W. B. McGill, K. R. Cannon, J. A. Robertson and F. D. Cook, “Dynamics of Soil Microbial Biomass and Water Soluble Organic C in Breton L after 50 Years of Cropping to Two Rotations,” Canadian Journal of Soil Science, Vol. 66, No. 1, 1986, pp. 1-19. http://dx.doi.org/10.4141/cjss86-001 [8] C. A. Cambardella and E. T. Elliott, “Particulate Soil Organic Matter Changes across a Grassland Cultivation Sequence,” Soil Science Society of America Journal, Vol. 56, No. 3, 1992, pp. 777-783. http://dx.doi.org/10.2136/sssaj1992.03615995005600030 017x [9] J. E. Compton and R. D. Boone, “Soil Nitrogen Trans- formation and the Role of Light Fraction Organic Matter in Forest Soils,” Soil Biology and Biochemistry, Vol. 34, No. 7, 2002, pp. 933-943. http://dx.doi.org/10.1016/S0038-0717(02)00025-1 [10] D. R. Keeney, “Nitrogen-Availability Indices” In: A. L. Page, et al., Eds., Methods in Soil Analysis—Part 2, Chemical and Microbial Properties, 2nd Edition, Soil Science Society of America, Madison, 1982, pp. 711-733. [11] W. R. Horwath and E. A. Paul, “Microbial Biomass,” In: R. W. Weaver, et al., Eds., Methods of Soil Analysis— Part 2, Microbiological and Biochemical Properties, 2nd Edition, Soil Science Society of America, Madison, 1994, pp. 753-771. [12] P. C. Brookes, A. Landman, G. Pruden and D. S. Jenkin- son, “Chloroform Fumigation and the Release of Soil Ni- trogen: A Rapid Direct Extraction Method to Measure Microbial Biomass Nitrogen in Soil,” Soil Biology and Biochemistry, Vol. 17, No. 6, 1985, pp. 837-842. http://dx.doi.org/10.1016/0038-0717(85)90144-0 [13] W. G. Cochran and G. M. Cox, “Experimental Designs,” Wiley, New York, 1950. [14] M. S. Aulakh, T. S. Khera, J. W. Doran, Kuldip-Singh and Bijay-Singh, “Yields and Nitrogen Dynamics in a Rice-Wheat System Using Green Manure and Inorganic Fertilizer,” Soil Science Society of America Journal, Vol. 64, 2000, pp. 1867-1876. [15] X. H. Hao, S. L. Liu, J. S. Wu, R. G. Hu, C. L. Tong and Y. Y. Su, “Effect of Long-Term Application of Inor- ganic Fertilizer and Organic Amendments on Soil Organic Matter and Microbial Biomass in Three Subtropical  Impact of Integrated Nutrient, Crop Residue and Tillage Management on Soil Aggregates and Organic Matter Fractions in Semiarid Subtropical Soil under Soybean-Wheat Rotation Open Access AJPS 2164 Paddy Soils,” Nutrient Cycling in Agroecosystems, Vol. 81, No. 1, 2008, pp. 17-24. http://dx.doi.org/10.1007/s10705-007-9145-z [16] T. Kaur, B. S. Brar and N. S. Dhillon, “Soil Organic Mat- ter Dynamics as Affected by Long-Term Use of Organic and Inorganic Fertilizers under Maize-Wheat Cropping System,” Nutrient Cycling in Agroecosystems, Vol. 81, No. 1, 2008, pp. 59-69. http://dx.doi.org/10.1007/s10705-007-9152-0 [17] A. J. Franzluebbers and M. A. Arshad, “Soil Microbial Biomass and Mineralizable Carbon of Water-Stable Ag- gregates,” Soil Science Society of America Journal, Vol. 61, No. 4, 1997, pp. 1090-1097. http://dx.doi.org/10.2136/sssaj1997.03615995006100040 015x [18] J. Balasdent, C. Chenu and M. Balabane, “Relationship of Soil Organic Matter Dynamics to Physical Protection and Tillage,” Soil Tillage and Research, Vol. 53, No. 3-4, 2000, pp. 215-230. http://dx.doi.org/10.1016/S0167-1987(99)00107-5 [19] E. G. Gregorich and H. H. Janzen, “Storage of Soil Car- bon in the Light Fraction and Macro Organic Matter,” In: M. R. Carter and B. A. Stewart, Eds., Advances in Soil Science, Structure and Organic Matter Storage in Agri- cultural Soils, CRC Press, Lewis Publisher, Boca Raton, 1996, pp. 167-190. [20] A. J. Franzluebbers, G. W. Langdale and H. H. Schomberg, “Soil Carbon, Nitrogen and Aggregation in Response to Type and Frequency of Tillage,” Soil Science Society of America Journal, Vol. 63, No. 2, 1999, pp. 349-355. http://dx.doi.org/10.2136/sssaj1999.03615995006300020 012x [21] J. Six, E. T. Elliott and K. Paustian, “Aggregate and Soil Organic Matter Dynamics under Conventional and No- Tillage Systems,” Soil Science Society of America Jour- nal, Vol. 63, No. 5, 1999, pp. 1350-1358. http://dx.doi.org/10.2136/sssaj1999.6351350x [22] M. R. Carter, D. A. Angers, E. G. Gregorich and M. A. Bolinder, “Characterizing Organic Matter Retention for Surface Soils in Eastern Canada Using Density and Parti- cle Size Fractions,” Canadian Journal of Soil Science, Vol. 83, No. 1, 2003, pp. 11-23. http://dx.doi.org/10.4141/S01-087 [23] A. Tirol-Padre, K. Tsuchiya, K. Inubushi and J. K. Ladha, “Organic Amendments Affect Soil Parameters in Two Long-Term Rice-Wheat Experiments,” Soil Science Soci- ety of America Journal, Vol. 71, No. 2, 2007, pp. 442-452. http://dx.doi.org/10.2136/sssaj2006.0141 [24] S. S. Walia and D. S. Kler, “Effect of Farmyard Manure on Soil Properties in Maize-Wheat System,” Journal of Research, Punjab Agricultural University, Vol. 43, No. 4, 2006, pp. 292-295. [25] G. S. Kang, V. Beri, B. S. Sidhu and O. P. Rupela, “A New Index to Assess Soil Quality and Sustainability of Wheat-Based Cropping Systems,” Biology and Fertility of Soils, Vol. 41, No. 6, 2005, pp. 389-398. http://dx.doi.org/10.1007/s00374-005-0857-4 [26] D. Yan, D. Wang and L. Yang, “Long-Term Effect of Chemical Fertilizer, Straw and Manure on Labile Organic Matter Fractions in a Paddy Soil,” Biology and Fertility of Soils, Vol. 44, No. 1, 2007, pp. 93-101. http://dx.doi.org/10.1007/s00374-007-0183-0 [27] M. C. Manna, A. Swarup, R. H. Wanjari, Y. V. Singh, P. K. Ghosh, K. N. Singh, A. K. Tripathi and M. N. Saha, “Soil Organic Matter in West Bengal Inceptisol after 30 Years of Multiple Cropping and Fertilization,” Soil Sci- ence Society of America Journal, Vol. 70, No. 1, 2006, pp. 121-129. http://dx.doi.org/10.2136/sssaj2005.0180 [28] R. C. Dalal, P. A. Henderson and J. M. Glasby, “Organic Matter and Microbial Biomass in a Vertisol after 20 yr of Zero-Tillage,” Soil Biology and Biochemistry, Vol. 23, No. 5, 1991, pp. 435-441. http://dx.doi.org/10.1016/0038-0717(91)90006-6
|