Genetic Divergence Studies in Pigeonpea [Cajanus cajan (L.) Millsp.] 2127
been repeatedly emphasized [2-6]. Earlier workers con-
sidered distances in place of origin as index of genetic
diversity and used it for selection of parents for hybridi-
zation programme. However, the genetic diversity of the
selected parents has not been always found to be based
on factors such as geographic diversity/place of release
or ploidy level [7,8]. Hence, characterization of genetic
divergence for selection of suitable and diverse geno-
types should be based on sound statistical procedures,
such as D2 cluster analysis. Keeping in view, an experi-
ment was taken up to study genetic diversity for selecting
the diverse parents for hybridization programme aimed at
isolating desirable segregants for seed yield and other
important characters in pigeonpea.
2. Materials and Methods
2.1. Experimental Detail
Twenty three pigeonpea parental materials of hybrids (3
cytoplasmic male sterile lines and 20 restorers/maintain-
ers genotypes) were evaluated in a randomized block
design with three replications at Research Farm of Ge-
netics and Plant Breeding, Narendra Deva University of
Agriculture & Technology, Kumarganj, Faizabad during
Kharif season of 2012. The experimental site is located at
26.47˚N latitude, 82.12˚E longitudes and an altitude of
113 m above mean sea level. This site is in the eastern
Gangetic plains of India an d has sandy loam soil texture.
Each genotype was raised in single row plots of 4 m
length with intra-row and inter-row spacing of 25 cm and
75 cm, respectively. The recommended agronomic prac-
tices followed to raise good crop stand.
2.2. Data Collection
The observations were recorded on five randomly se-
lected competitive plants of a genotype for eleven char-
acters viz., days to 50% flowering, days to maturity,
number of primary branches per plant, number of secon-
dary branches per plant, plant height (cm), pods per plant,
seeds per pod, 100-seed weight, seed yield per plant (g),
biological yield per plant (g) and harvest index (%).
2.3. Statistical Analysis
The mean data on eleven quantitative characters fro m the
experiment were utilized for analysis of variance to test
the significance for each character as per methodology
advocated by [9]. Genetic diversity was estimated by [10]
and the grouping of the genotypes into different clusters
were done by using the procedure of [11].
3. Results and Discussion
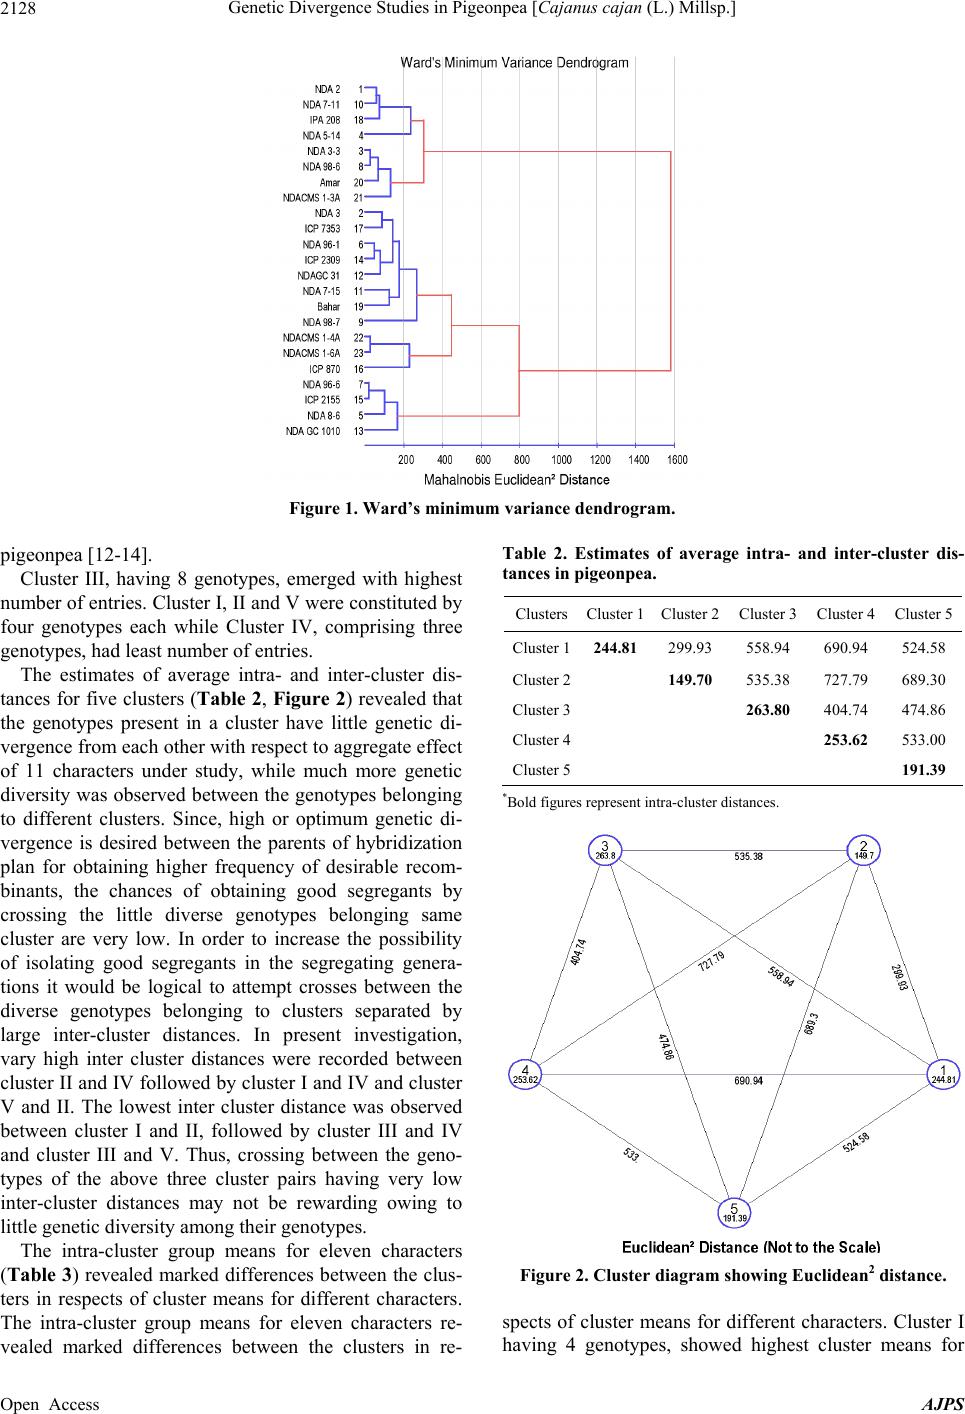
The Mahalanobis D2 cluster analysis grouped all the 23
pigeonpea genotypes of the present investigation into five
distinct non-overlapping clusters (Table 1 and Figure 1).
The discrimination of genotypes into discrete clusters
suggested presence of high degree of genetic diversity in
the material evaluated. Earlier workers have also re-
ported substantial genetic divergence in the pigeonpea
materials [4-6,12,13]. Presence of substantial genetic
diversity among the parental material screened in the
present study indicated that this material may serve as
good source for selecting the diverse parents for hybridi-
zation programme aimed at isolating desirable segregants
for seed yield and other important characters.
An examination of the clustering pattern of the 23 pi-
geonpea genotypes into five clusters revealed that the
genotypes of heterogeneous origin were frequently pre-
sent in same cluster. Although the genotypes originated
in same place or ge ographic reg ion were also fo und to be
grouped together in same cluster, the instances of group-
ing of genotypes of different origin or geographical re-
gions in same cluster were observed in case of all the
clusters. This indicated lack of any definite relationship
or correlation between genetic diversity and geographic
origin of the pigeonpea genotypes evaluated in the pre-
sent study. Therefore, the selection of parental material
for hybridization programme simply based on geographic
diversity may not be rewarding exercise. The choice of
suitable diverse parents based on genetic divergence
analysis would be more fruitful than the choice made on
the basis of geographical distances. This finding is in
conformity with the previous reports advocating lack of
parallelism between genetic and geographic diversity in
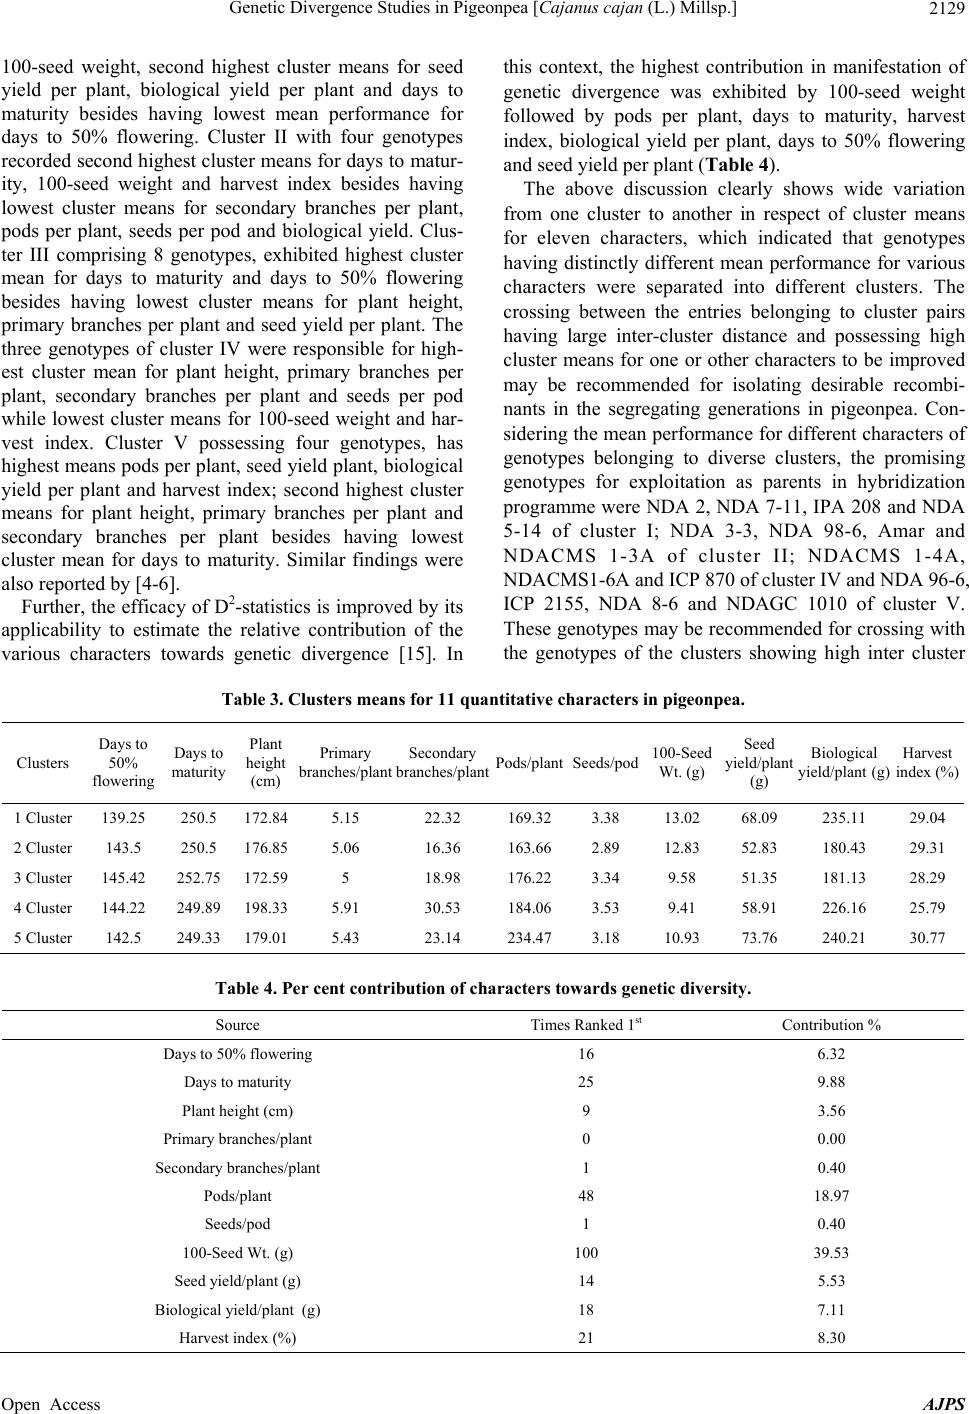
Table 1. Distribution of parents into different clusters on the basis of Mahalanobis D2 statistics.
Clusters Name of genotypes included No. of genotypes included
1 Cluster NDA 2, NDA 7-11, IPA 208, NDA 5-14 4
2 Cluster NDA 3-3, NDA 98-6, Amar, NDACMS 1-3A 4
3 Cluster NDA 3, ICP 7353, NDA 96-1, ICP 2309, NDAGC 31, NDA 7-15, Bahar, NDA 98-7 8
4 Cluster NDACMS1-4A, ICP 870 NDACMS 1-6A 3
5 Cluster NDA 96-6, ICP 2155, NDA 8-6, NDAGC 1010 4
Open Access AJPS