 American Journal of Plant Sciences, 2013, 4, 2083-2091 Published Online November 2013 (http://www.scirp.org/journal/ajps) http://dx.doi.org/10.4236/ajps.2013.411260 Open Access AJPS 2083 Growth and Economic Assessment of Wheat under Tillage and Nitrogen Levels in Rice-Wheat System Rafi Qamar1*, Ehsanullah2, Abdul Rehman1, Amjed Ali1, Abdul Ghaffar3, Athar Mahmood1, Hafiz Muhammad Rashad Javeed4, Mudassir Aziz1 1Department of Agronomy, University College of Agriculture, University of Sargodha, Sargodha, Pakistan; 2Department of Agron- omy, Faculty of Agriculture, University of Agriculture, Faisalabad, Pakistan; 3Plant Physiology Section, Ayub Agricultural Research Institute, Faisalabad, Pakistan; 4Department of Environmental Sciences, NFC Institute of Engineering and Technology, Multan, Paki- stan. Email: *rafi1573@gmail.com Received September 1st, 2013; revised October 1st, 2013; accepted October 15th, 2013 Copyright © 2013 Rafi Qamar et al. This is an open access article distributed under the Creative Commons Attribution License, which permits unrestricted use, distribution, and reproduction in any medium, provided the original work is properly cited. ABSTRACT Mechanically post-harvest puddled rice field has stubbles that often delay timely planting of winter wheat crop. Zero tillage increased the net return by decreasing the unwise tillage operations and labor charges. Keep in view, a random- ized complete block design experiment in a split plot arrangement was conducted with four tillage system [conventional tillage, CT; deep tillage, DT; zero tillage with zone disc tiller, ZDT; and happy seeder, HS] in main plots and five ni- trogen levels [0, 75, 100, 125, and 150 kg·ha−1] in subplots during 2009 to 2010 and 2010 to 2011 cropping seasons. Results showed that in 2009-10 and 2010-11 grain yield (4.6 Mg·ha−1 and 5.7 Mg·ha−1) in DT and (4.5 Mg·ha−1 and 5.8 Mg·ha−1) in HS were significantly higher compared with CT and ZDT. Significantly, maximum leaf area index (5.18 and 5.24) and crop growth rate (12.14 g·m−2·d−1 and 13.15 g·m−2·d−1) were noted in DT. Grain protein (11.78%) was significantly higher in DT compared with CT, ZDT, and HS during 2009-10 and 2010-11. Total yield (12.4 Mg·ha−1 and 16.4 Mg·ha−1) and grain yield (4.9 Mg·ha−1 and 6.5 Mg·ha−1) at N125 kg·ha−1 while grain protein (13.52%) at N150 kg·ha−1 was significantly higher than other nitrogen levels. Maximum LAI (5.08 and 5.51) and crop growth rate (14.68 g m−2·d−1 and 15.77 g·m−2·d−1) were recorded at N125 kg·ha−1 respectively. During both the years, all the tillage systems gave higher net return at N125 kg·ha−1 during both the growing seasons. DT and HS gave more than 20% higher yield and improved crop growth of irrigated wheat than CT and ZDT. Happy seeder provides immediate, identifiable, and demonstrable economic benefits by reducing production costs. Keywords: Leaf Area Index; Grain Yield; Protein Content; Net Return; Wheat 1. Introduction Rice-wheat cropping system has substantial role in world food security and provides about 8% staple grain to the world’s population (Timsina and Connor) [1]. In South Asia, the area under rice-wheat cropping system is about 13.5 million hectares, which has meaningful role in food self-sufficiency (Saharawat et al.) [2]. In rice-wheat sys- tem, wheat yield is stagnant due to long-term use of conventional management practices, which exerts de- structive effects on soil productivity and farm economics in post-harvest paddy field (Duxbury et al.) [3]. However, conventional tillage system reduces the soil compaction and enhances the nutrient stratification (Boydas and Turgut) [4]. Subsurface soil compaction by conventional tillage decreased both the nutrient and wa- ter use efficiencies and reduced the root growth of fol- lowing wheat (Qamar et al.) [5]. Deep plowing breaks the sub-surface hard pan and improves the wheat crop growth and yield by increasing the rooting depth (Chaudhary et al.) [6]. No doubt, deep tillage has good response on crop yield due to fine seedbed preparation but it is expansive in terms of fuel and time (Qin et al.) [7]. Zero till wheat cultivation after rice is the most pro- ductive and resource-conserving technology (Erenstein et al., 2007) [8]; Erenstein and Laxmi) [9], which has been successfully practiced on more than 111 million hectare *Corresponding author. 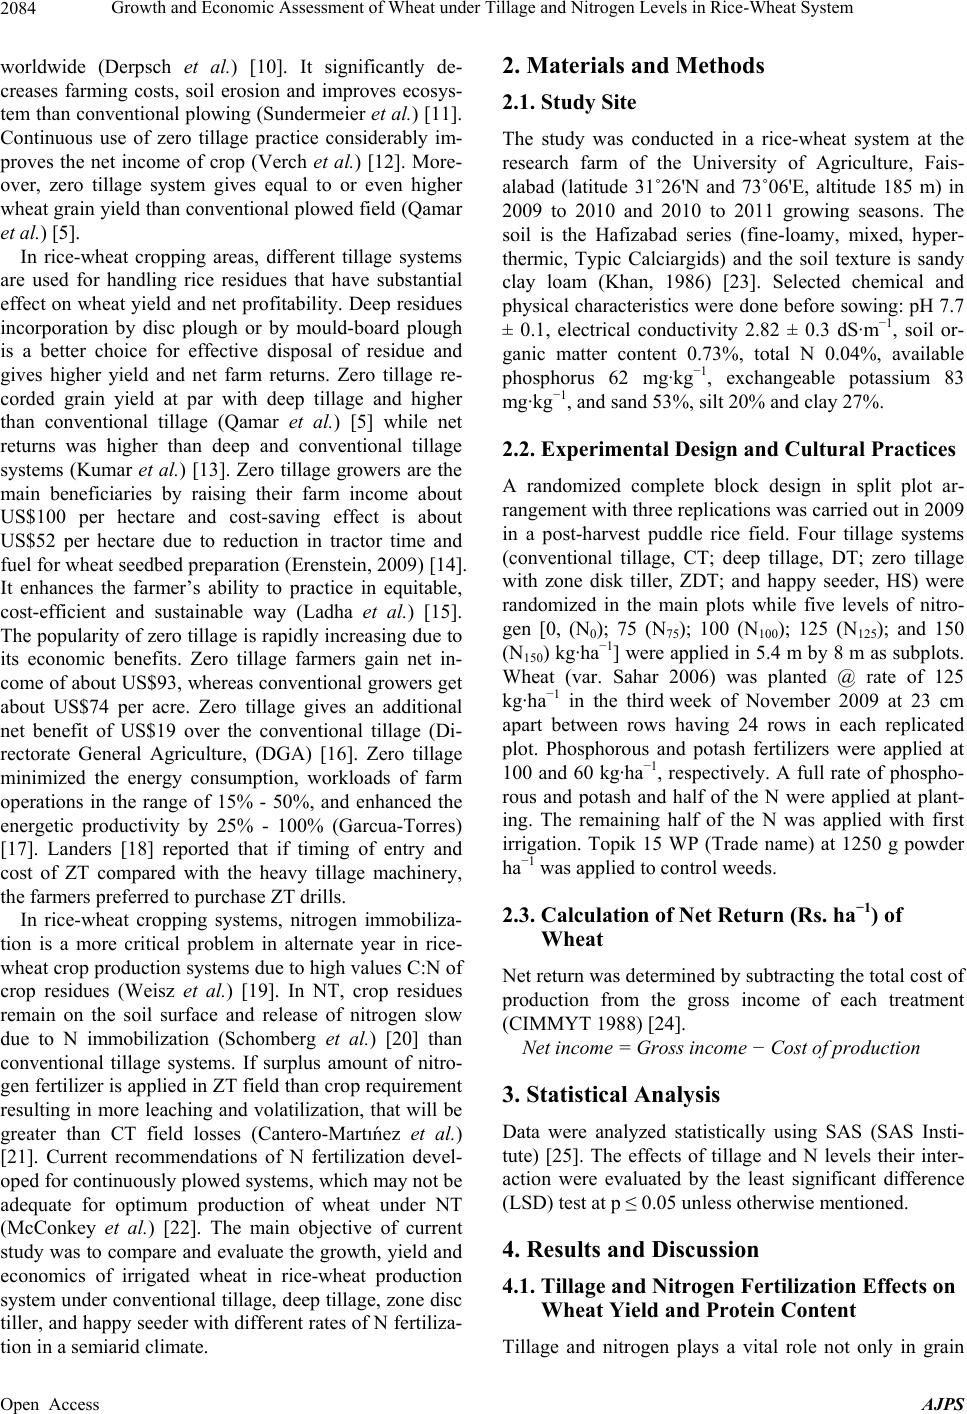 Growth and Economic Assessment of Wheat under Tillage and Nitrogen Levels in Rice-Wheat System 2084 worldwide (Derpsch et al.) [10]. It significantly de- creases farming costs, soil erosion and improves ecosys- tem than conventional plowing (Sundermeier et al.) [11]. Continuous use of zero tillage practice considerably im- proves the net income of crop (Verch et al.) [12]. More- over, zero tillage system gives equal to or even higher wheat grain yield than conventional plowed field (Qamar et al.) [5]. In rice-wheat cropping areas, different tillage systems are used for handling rice residues that have substantial effect on wheat yield and net profitability. Deep residues incorporation by disc plough or by mould-board plough is a better choice for effective disposal of residue and gives higher yield and net farm returns. Zero tillage re- corded grain yield at par with deep tillage and higher than conventional tillage (Qamar et al.) [5] while net returns was higher than deep and conventional tillage systems (Kumar et al.) [13]. Zero tillage growers are the main beneficiaries by raising their farm income about US$100 per hectare and cost-saving effect is about US$52 per hectare due to reduction in tractor time and fuel for wheat seedbed preparation (Erenstein, 2009) [14]. It enhances the farmer’s ability to practice in equitable, cost-efficient and sustainable way (Ladha et al.) [15]. The popularity of zero tillage is rapidly increasing due to its economic benefits. Zero tillage farmers gain net in- come of about US$93, whereas conventional growers get about US$74 per acre. Zero tillage gives an additional net benefit of US$19 over the conventional tillage (Di- rectorate General Agriculture, (DGA) [16]. Zero tillage minimized the energy consumption, workloads of farm operations in the range of 15% - 50%, and enhanced the energetic productivity by 25% - 100% (Garcua-Torres) [17]. Landers [18] reported that if timing of entry and cost of ZT compared with the heavy tillage machinery, the farmers preferred to purchase ZT drills. In rice-wheat cropping systems, nitrogen immobiliza- tion is a more critical problem in alternate year in rice- wheat crop production systems due to high values C:N of crop residues (Weisz et al.) [19]. In NT, crop residues remain on the soil surface and release of nitrogen slow due to N immobilization (Schomberg et al.) [20] than conventional tillage systems. If surplus amount of nitro- gen fertilizer is applied in ZT field than crop requirement resulting in more leaching and volatilization, that will be greater than CT field losses (Cantero-Martıńez et al.) [21]. Current recommendations of N fertilization devel- oped for continuously plowed systems, which may not be adequate for optimum production of wheat under NT (McConkey et al.) [22]. The main objective of current study was to compare and evaluate the growth, yield and economics of irrigated wheat in rice-wheat production system under conventional tillage, deep tillage, zone disc tiller, and happy seeder with different rates of N fertiliza- tion in a semiarid climate. 2. Materials and Methods 2.1. Study Site The study was conducted in a rice-wheat system at the research farm of the University of Agriculture, Fais- alabad (latitude 31˚26'N and 73˚06'E, altitude 185 m) in 2009 to 2010 and 2010 to 2011 growing seasons. The soil is the Hafizabad series (fine-loamy, mixed, hyper- thermic, Typic Calciargids) and the soil texture is sandy clay loam (Khan, 1986) [23]. Selected chemical and physical characteristics were done before sowing: pH 7.7 ± 0.1, electrical conductivity 2.82 ± 0.3 dS·m−1, soil or- ganic matter content 0.73%, total N 0.04%, available phosphorus 62 mg·kg−1, exchangeable potassium 83 mg· k g −1, and sand 53%, silt 20% and clay 27%. 2.2. Experimental Design and Cultural Practices A randomized complete block design in split plot ar- rangement with three replications was carried out in 2009 in a post-harvest puddle rice field. Four tillage systems (conventional tillage, CT; deep tillage, DT; zero tillage with zone disk tiller, ZDT; and happy seeder, HS) were randomized in the main plots while five levels of nitro- gen [0, (N0); 75 (N75); 100 (N100); 125 (N125); and 150 (N150) kg·ha−1] were applied in 5.4 m by 8 m as subplots. Wheat (var. Sahar 2006) was planted @ rate of 125 kg·ha−1 in the third week of November 2009 at 23 cm apart between rows having 24 rows in each replicated plot. Phosphorous and potash fertilizers were applied at 100 and 60 kg·ha−1, respectively. A full rate of phospho- rous and potash and half of the N were applied at plant- ing. The remaining half of the N was applied with first irrigation. Topik 15 WP (Trade name) at 1250 g powder ha−1 was applied to control weeds. 2.3. Calculation of Net Return (Rs. ha−1) of Wheat Net return was determined by subtracting the total cost of production from the gross income of each treatment (CIMMYT 1988) [24]. Net income = Gross income − Cost of production 3. Statistical Analysis Data were analyzed statistically using SAS (SAS Insti- tute) [25]. The effects of tillage and N levels their inter- action were evaluated by the least significant difference (LSD) test at p ≤ 0.05 unless otherwise mentioned. 4. Results and Discussion 4.1. Tillage and Nitrogen Fertilization Effects on Wheat Yield and Protein Content Tillage and nitrogen plays a vital role not only in grain Open Access AJPS 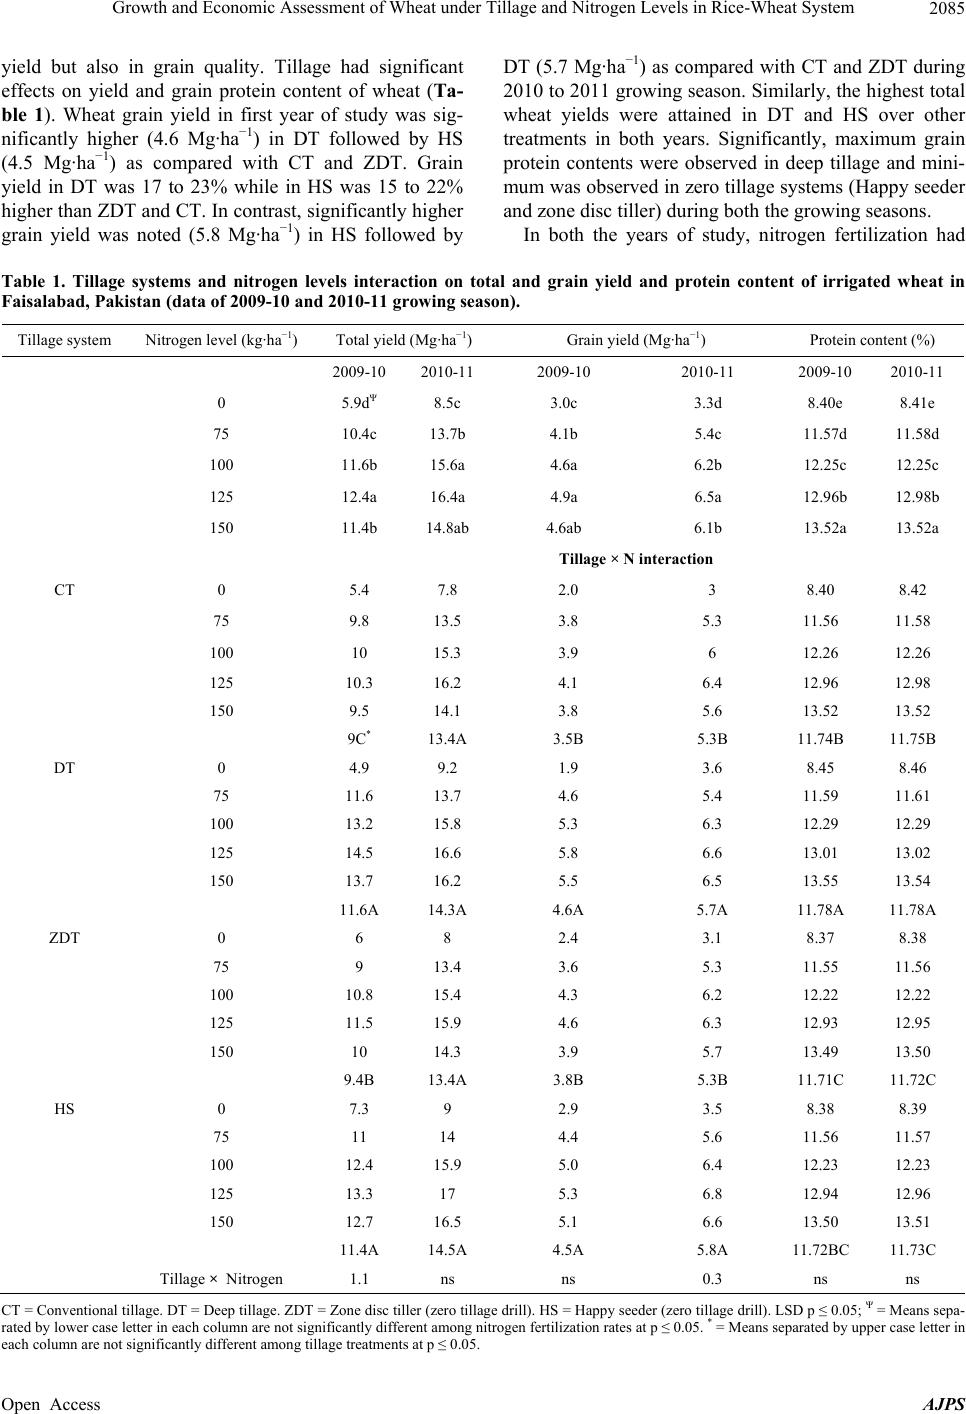 Growth and Economic Assessment of Wheat under Tillage and Nitrogen Levels in Rice-Wheat System Open Access AJPS 2085 yield but also in grain quality. Tillage had significant effects on yield and grain protein content of wheat (Ta- ble 1). Wheat grain yield in first year of study was sig- nificantly higher (4.6 Mg·ha−1) in DT followed by HS (4.5 Mg·ha−1) as compared with CT and ZDT. Grain yield in DT was 17 to 23% while in HS was 15 to 22% higher than ZDT and CT. In contrast, significantly higher grain yield was noted (5.8 Mg·ha−1) in HS followed by DT (5.7 Mg·ha−1) as compared with CT and ZDT during 2010 to 2011 growing season. Similarly, the highest total wheat yields were attained in DT and HS over other treatments in both years. Significantly, maximum grain protein contents were observed in deep tillage and mini- mum was observed in zero tillage systems (Happy seeder and zone disc tiller) during both the growing seasons. In both the years of study, nitrogen fertilization had Table 1. Tillage systems and nitrogen levels interaction on total and grain yield and protein content of irrigated wheat in Faisalabad, Pakistan (data of 2009-10 and 2010-11 growing season). Tillage system Nitrogen level (kg·ha−1) Total yield (Mg·ha−1) Grain yield (Mg·ha−1) Protein content (%) 2009-10 2010-11 2009-10 2010-11 2009-10 2010-11 0 5.9dΨ 8.5c 3.0c 3.3d 8.40e 8.41e 75 10.4c 13.7b 4.1b 5.4c 11.57d 11.58d 100 11.6b 15.6a 4.6a 6.2b 12.25c 12.25c 125 12.4a 16.4a 4.9a 6.5a 12.96b 12.98b 150 11.4b 14.8ab 4.6ab 6.1b 13.52a 13.52a Tillage × N interaction CT 0 5.4 7.8 2.0 3 8.40 8.42 75 9.8 13.5 3.8 5.3 11.56 11.58 100 10 15.3 3.9 6 12.26 12.26 125 10.3 16.2 4.1 6.4 12.96 12.98 150 9.5 14.1 3.8 5.6 13.52 13.52 9C* 13.4A 3.5B 5.3B 11.74B 11.75B DT 0 4.9 9.2 1.9 3.6 8.45 8.46 75 11.6 13.7 4.6 5.4 11.59 11.61 100 13.2 15.8 5.3 6.3 12.29 12.29 125 14.5 16.6 5.8 6.6 13.01 13.02 150 13.7 16.2 5.5 6.5 13.55 13.54 11.6A 14.3A 4.6A 5.7A 11.78A 11.78A ZDT 0 6 8 2.4 3.1 8.37 8.38 75 9 13.4 3.6 5.3 11.55 11.56 100 10.8 15.4 4.3 6.2 12.22 12.22 125 11.5 15.9 4.6 6.3 12.93 12.95 150 10 14.3 3.9 5.7 13.49 13.50 9.4B 13.4A 3.8B 5.3B 11.71C 11.72C HS 0 7.3 9 2.9 3.5 8.38 8.39 75 11 14 4.4 5.6 11.56 11.57 100 12.4 15.9 5.0 6.4 12.23 12.23 125 13.3 17 5.3 6.8 12.94 12.96 150 12.7 16.5 5.1 6.6 13.50 13.51 11.4A 14.5A 4.5A 5.8A 11.72BC 11.73C Tillage × Nitrogen 1.1 ns ns 0.3 ns ns CT = Conventional tillage. DT = Deep tillage. ZDT = Zone disc tiller (zero tillage drill). HS = Happy seeder (zero tillage drill). LSD p ≤ 0.05; Ψ = Means sepa- rated by lower case letter in each column are not significantly different among nitrogen fertilization rates at p ≤ 0.05. * = Means separated by upper case letter in ach column are not significantly different among tillage treatments at p ≤ 0.05. e 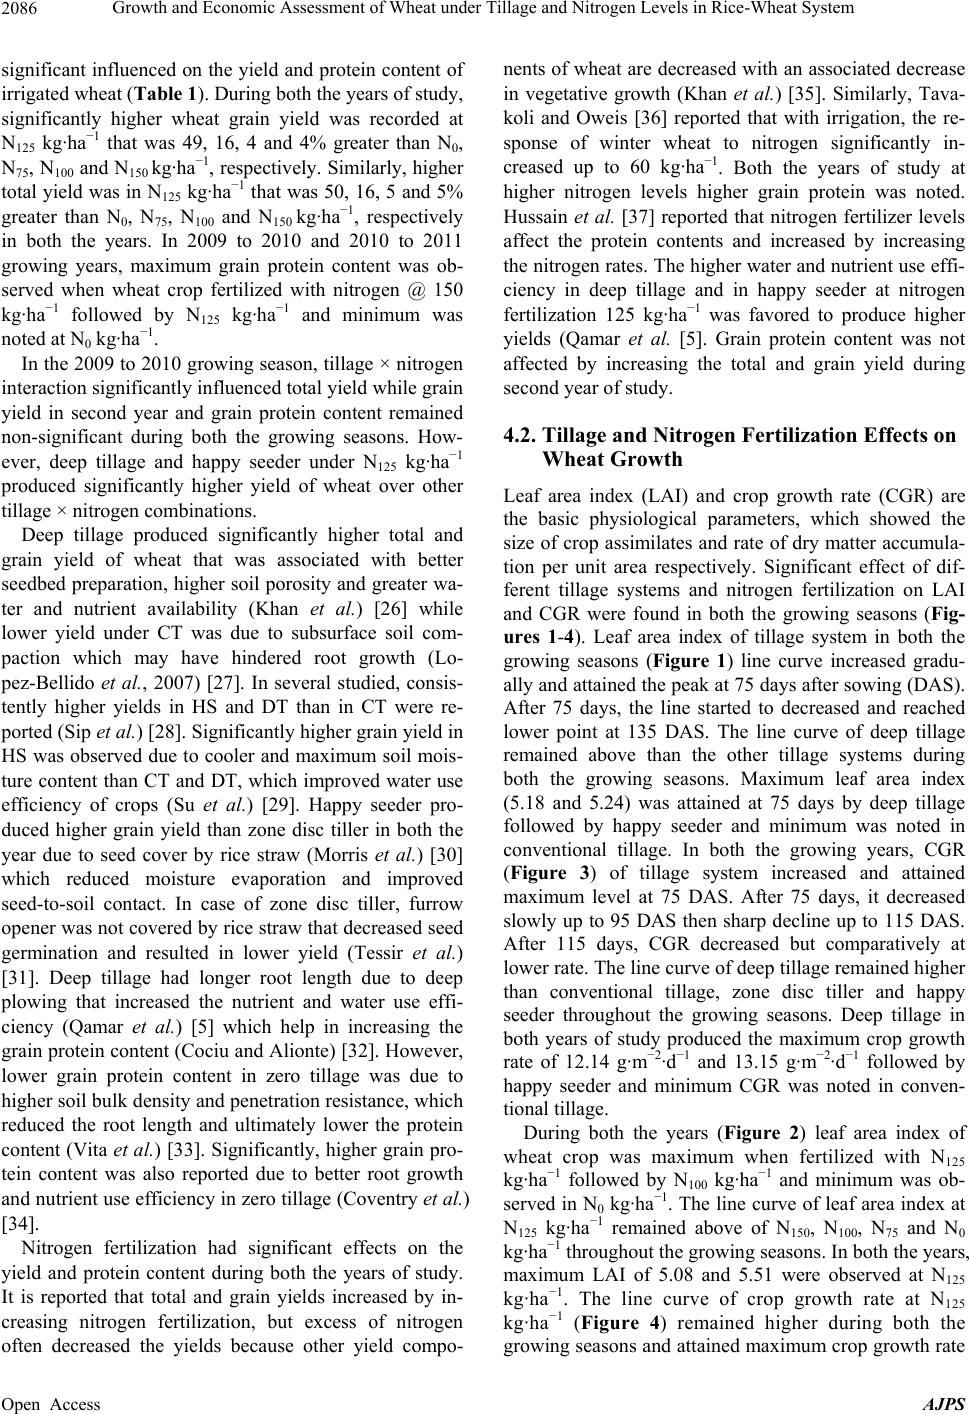 Growth and Economic Assessment of Wheat under Tillage and Nitrogen Levels in Rice-Wheat System 2086 significant influenced on the yield and protein content of irrigated wheat (Table 1). During both the years of study, significantly higher wheat grain yield was recorded at N125 kg·ha−1 that was 49, 16, 4 and 4% greater than N0, N75, N100 and N150 kg·ha−1, respectively. Similarly, higher total yield was in N125 kg·ha−1 that was 50, 16, 5 and 5% greater than N0, N75, N100 and N150 kg·ha−1, respectively in both the years. In 2009 to 2010 and 2010 to 2011 growing years, maximum grain protein content was ob- served when wheat crop fertilized with nitrogen @ 150 kg·ha−1 followed by N125 kg·ha−1 and minimum was noted at N0 kg·ha−1. In the 2009 to 2010 growing season, tillage × nitrogen interaction significantly influenced total yield while grain yield in second year and grain protein content remained non-significant during both the growing seasons. How- ever, deep tillage and happy seeder under N125 kg·ha−1 produced significantly higher yield of wheat over other tillage × nitrogen combinations. Deep tillage produced significantly higher total and grain yield of wheat that was associated with better seedbed preparation, higher soil porosity and greater wa- ter and nutrient availability (Khan et al.) [26] while lower yield under CT was due to subsurface soil com- paction which may have hindered root growth (Lo- pez-Bellido et al., 2007) [27]. In several studied, consis- tently higher yields in HS and DT than in CT were re- ported (Sip et al.) [28]. Significantly higher grain yield in HS was observed due to cooler and maximum soil mois- ture content than CT and DT, which improved water use efficiency of crops (Su et al.) [29]. Happy seeder pro- duced higher grain yield than zone disc tiller in both the year due to seed cover by rice straw (Morris et al.) [30] which reduced moisture evaporation and improved seed-to-soil contact. In case of zone disc tiller, furrow opener was not covered by rice straw that decreased seed germination and resulted in lower yield (Tessir et al.) [31]. Deep tillage had longer root length due to deep plowing that increased the nutrient and water use effi- ciency (Qamar et al.) [5] which help in increasing the grain protein content (Cociu and Alionte) [32]. However, lower grain protein content in zero tillage was due to higher soil bulk density and penetration resistance, which reduced the root length and ultimately lower the protein content (Vita et al.) [33]. Significantly, higher grain pro- tein content was also reported due to better root growth and nutrient use efficiency in zero tillage (Coventry et al.) [34]. Nitrogen fertilization had significant effects on the yield and protein content during both the years of study. It is reported that total and grain yields increased by in- creasing nitrogen fertilization, but excess of nitrogen often decreased the yields because other yield compo- nents of wheat are decreased with an associated decrease in vegetative growth (Khan et al.) [35]. Similarly, Tava- koli and Oweis [36] reported that with irrigation, the re- sponse of winter wheat to nitrogen significantly in- creased up to 60 kg·ha−1. Both the years of study at higher nitrogen levels higher grain protein was noted. Hussain et al. [37] reported that nitrogen fertilizer levels affect the protein contents and increased by increasing the nitrogen rates. The higher water and nutrient use effi- ciency in deep tillage and in happy seeder at nitrogen fertilization 125 kg·ha−1 was favored to produce higher yields (Qamar et al. [5]. Grain protein content was not affected by increasing the total and grain yield during second year of study. 4.2. Tillage and Nitrogen Fertilization Effects on Wheat Growth Leaf area index (LAI) and crop growth rate (CGR) are the basic physiological parameters, which showed the size of crop assimilates and rate of dry matter accumula- tion per unit area respectively. Significant effect of dif- ferent tillage systems and nitrogen fertilization on LAI and CGR were found in both the growing seasons (Fig- ures 1-4). Leaf area index of tillage system in both the growing seasons (Figure 1) line curve increased gradu- ally and attained the peak at 75 days after sowing (DAS). After 75 days, the line started to decreased and reached lower point at 135 DAS. The line curve of deep tillage remained above than the other tillage systems during both the growing seasons. Maximum leaf area index (5.18 and 5.24) was attained at 75 days by deep tillage followed by happy seeder and minimum was noted in conventional tillage. In both the growing years, CGR (Figure 3) of tillage system increased and attained maximum level at 75 DAS. After 75 days, it decreased slowly up to 95 DAS then sharp decline up to 115 DAS. After 115 days, CGR decreased but comparatively at lower rate. The line curve of deep tillage remained higher than conventional tillage, zone disc tiller and happy seeder throughout the growing seasons. Deep tillage in both years of study produced the maximum crop growth rate of 12.14 g·m−2·d−1 and 13.15 g·m−2·d−1 followed by happy seeder and minimum CGR was noted in conven- tional tillage. During both the years (Figure 2) leaf area index of wheat crop was maximum when fertilized with N125 kg·ha−1 followed by N100 kg·ha−1 and minimum was ob- served in N0 kg·ha−1. The line curve of leaf area index at N125 kg·ha−1 remained above of N150, N100, N75 and N0 kg·ha−1 throughout the growing seasons. In both the years, maximum LAI of 5.08 and 5.51 were observed at N125 kg·ha−1. The line curve of crop growth rate at N125 kg·ha−1 (Figure 4) remained higher during both the growing seasons and attained maximum crop growth rate Open Access AJPS 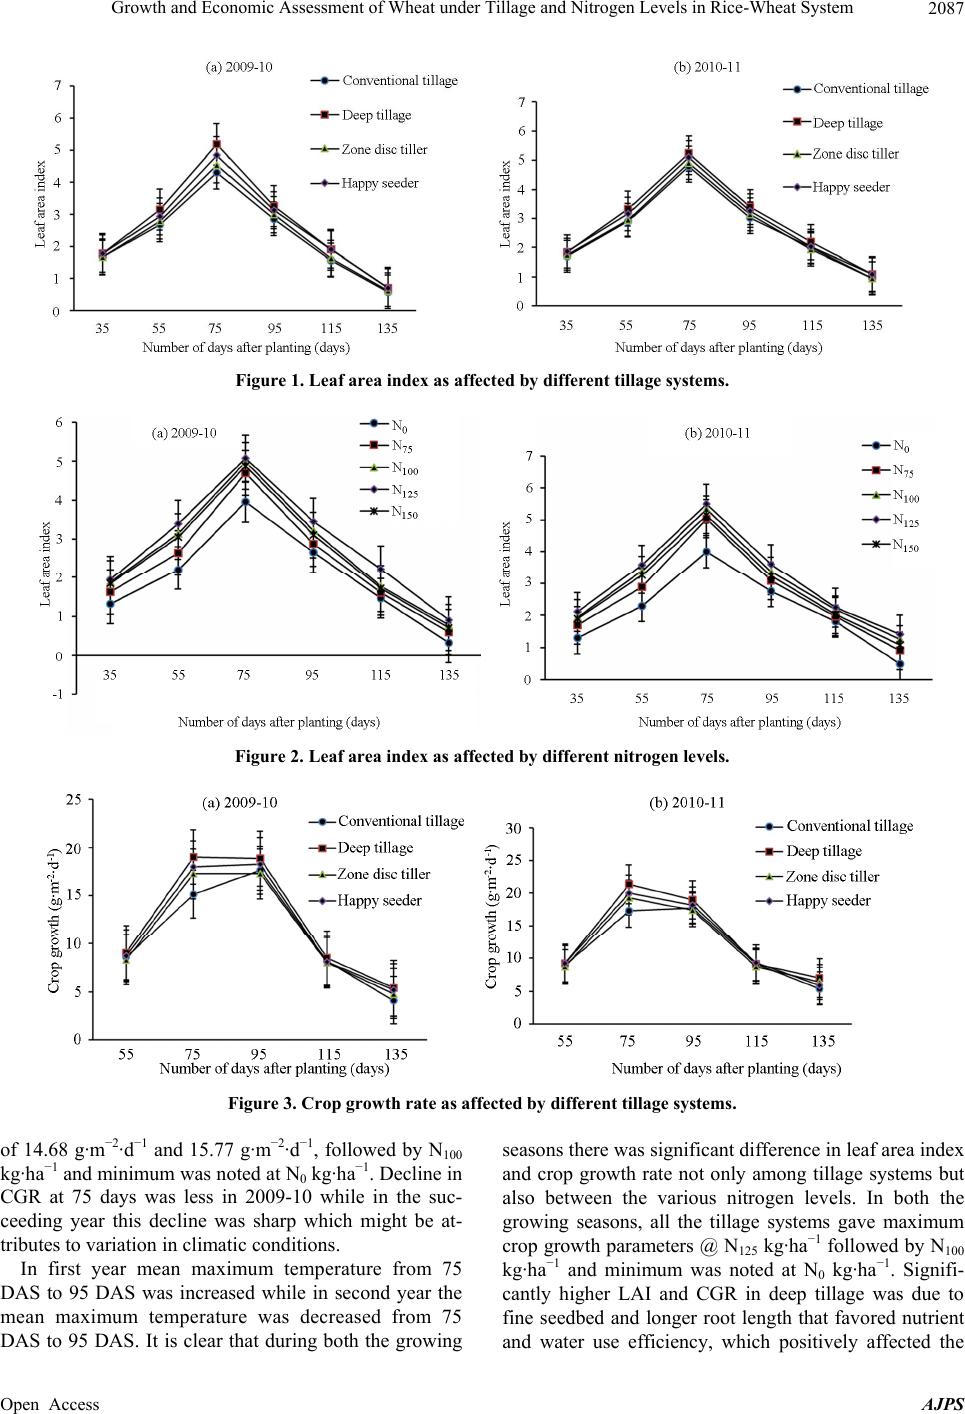 Growth and Economic Assessment of Wheat under Tillage and Nitrogen Levels in Rice-Wheat System 2087 Figure 1. Leaf area index as affected by different tillage systems. Figure 2. Leaf area index as affected by different nitrogen levels. Figure 3. Crop growth rate as affected by different tillage systems. of 14.68 g·m−2·d−1 and 15.77 g·m−2·d−1, followed by N100 kg·ha−1 and minimum was noted at N0 kg·ha−1. Decline in CGR at 75 days was less in 2009-10 while in the suc- ceeding year this decline was sharp which might be at- tributes to variation in climatic conditions. In first year mean maximum temperature from 75 DAS to 95 DAS was increased while in second year the mean maximum temperature was decreased from 75 DAS to 95 DAS. It is clear that during both the growing seasons there was significant difference in leaf area index and crop growth rate not only among tillage systems but also between the various nitrogen levels. In both the growing seasons, all the tillage systems gave maximum crop growth parameters @ N125 kg·ha−1 followed by N100 kg·ha−1 and minimum was noted at N0 kg·ha−1. Signifi- cantly higher LAI and CGR in deep tillage was due to fine seedbed and longer root length that favored nutrient and water use efficiency, wh positively affected the ich Open Access AJPS 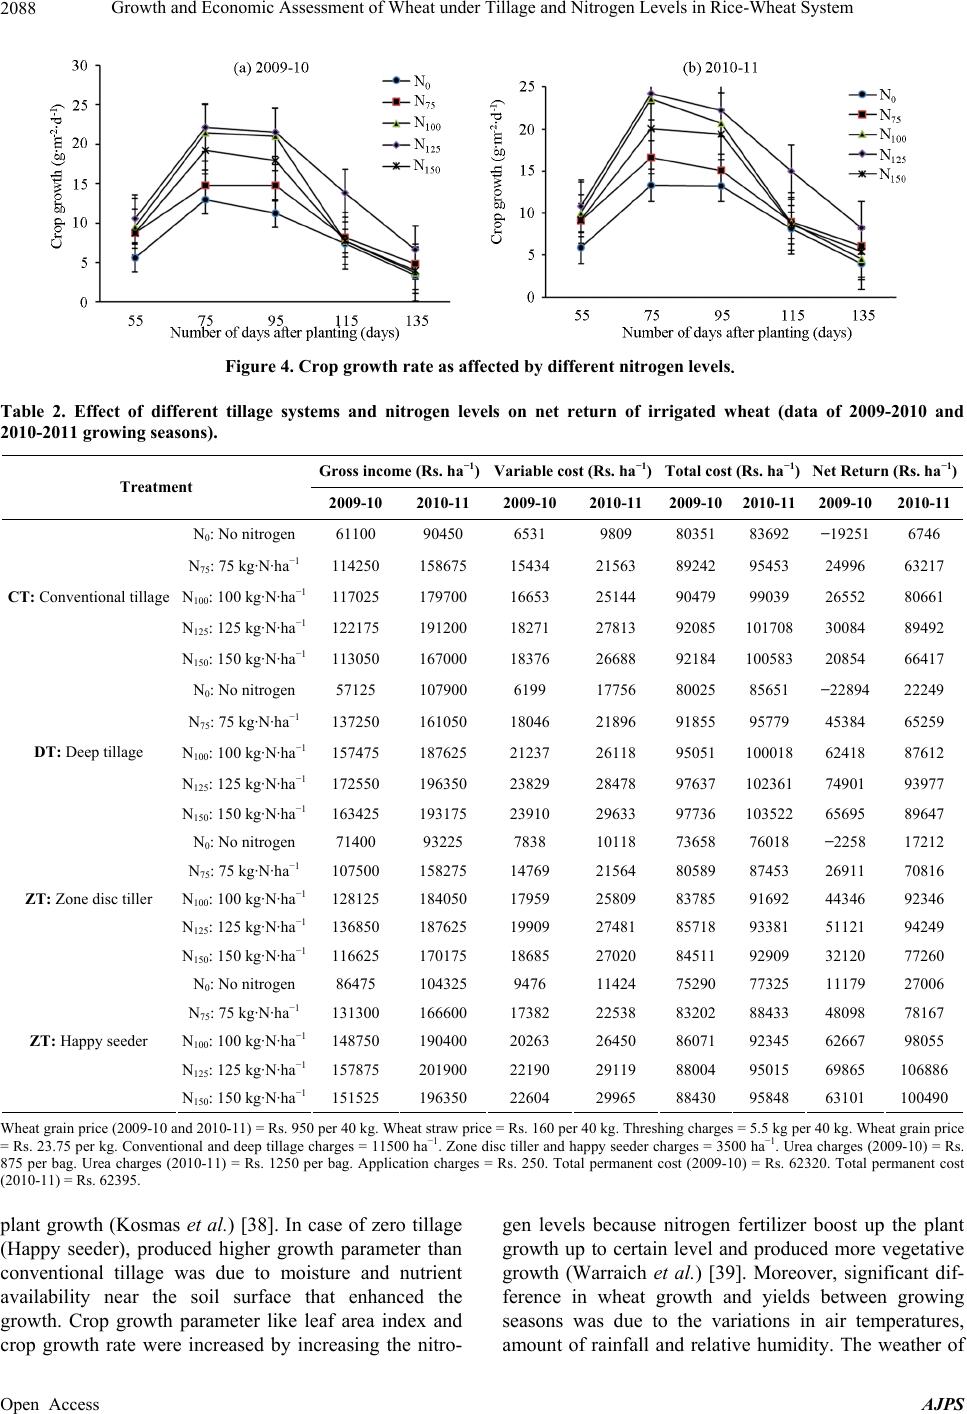 Growth and Economic Assessment of Wheat under Tillage and Nitrogen Levels in Rice-Wheat System 2088 Figure 4. Crop growth rate as affected by different nitrogen levels. Table 2. Effect of different tillage systems and nitrogen levels on net return of irrigated wheat (data of 2009-2010 and 2010-2011 growing seasons). Gross income (Rs. ha−1)Variable cost (Rs. ha−1)Total cost (Rs. ha−1) Net Return (Rs. ha−1) Treatment 2009-10 2010-11 2009-10 2010-112009-102010-11 2009-102010-11 N0: No nitrogen 61100 90450 6531 9809 80351 83692 −19251 6746 N75: 75 kg·N·ha−1 114250 158675 15434 21563 89242 95453 24996 63217 N100: 100 kg·N·ha−1 117025 179700 16653 25144 90479 99039 26552 80661 N125: 125 kg·N·ha−1 122175 191200 18271 27813 92085 101708 30084 89492 CT: Conventional tillage N150: 150 kg·N·ha−1 113050 167000 18376 26688 92184 100583 20854 66417 N0: No nitrogen 57125 107900 6199 17756 80025 85651 −22894 22249 N75: 75 kg·N·ha−1 137250 161050 18046 21896 91855 95779 45384 65259 N100: 100 kg·N·ha−1 157475 187625 21237 26118 95051 100018 62418 87612 N125: 125 kg·N·ha−1 172550 196350 23829 28478 97637 102361 74901 93977 DT: Deep tillage N150: 150 kg·N·ha−1 163425 193175 23910 29633 97736 103522 65695 89647 N0: No nitrogen 71400 93225 7838 10118 73658 76018 −2258 17212 N75: 75 kg·N·ha−1 107500 158275 14769 21564 80589 87453 26911 70816 N100: 100 kg·N·ha−1 128125 184050 17959 25809 83785 91692 44346 92346 N125: 125 kg·N·ha−1 136850 187625 19909 27481 85718 93381 51121 94249 ZT: Zone disc tiller N150: 150 kg·N·ha−1 116625 170175 18685 27020 84511 92909 32120 77260 N0: No nitrogen 86475 104325 9476 11424 75290 77325 11179 27006 N75: 75 kg·N·ha−1 131300 166600 17382 22538 83202 88433 48098 78167 N100: 100 kg·N·ha−1 148750 190400 20263 26450 86071 92345 62667 98055 N125: 125 kg·N·ha−1 157875 201900 22190 29119 88004 95015 69865 106886 ZT: Happy seeder N150: 150 kg·N·ha−1 151525 196350 22604 29965 88430 95848 63101 100490 Wheat grain price (2009-10 and 2010-11) = Rs. 950 per 40 kg. Wheat straw price = Rs. 160 per 40 kg. Threshing charges = 5.5 kg per 40 kg. Wheat grain price = Rs. 23.75 per kg. Conventional and deep tillage charges = 11500 ha−1. Zone disc tiller and happy seeder charges = 3500 ha−1. Urea charges (2009-10) = Rs. 875 per bag. Urea charges (2010-11) = Rs. 1250 per bag. Application charges = Rs. 250. Total permanent cost (2009-10) = Rs. 62320. Total permanent cost (2010-11) = Rs. 62395. plant growth (Kosmas et al.) [38]. In case of zero tillage (Happy seeder), produced higher growth parameter than conventional tillage was due to moisture and nutrient availability near the soil surface that enhanced the growth. Crop growth parameter like leaf area index and crop growth rate were increased by increasing the nitro- gen levels because nitrogen fertilizer boost up the plant growth up to certain level and produced more vegetative growth (Warraich et al.) [39]. Moreover, significant dif- ference in wheat growth and yields between growing seasons was due to the variations in air temperatures, amount of rainfall and relative humidity. The weather of Open Access AJPS 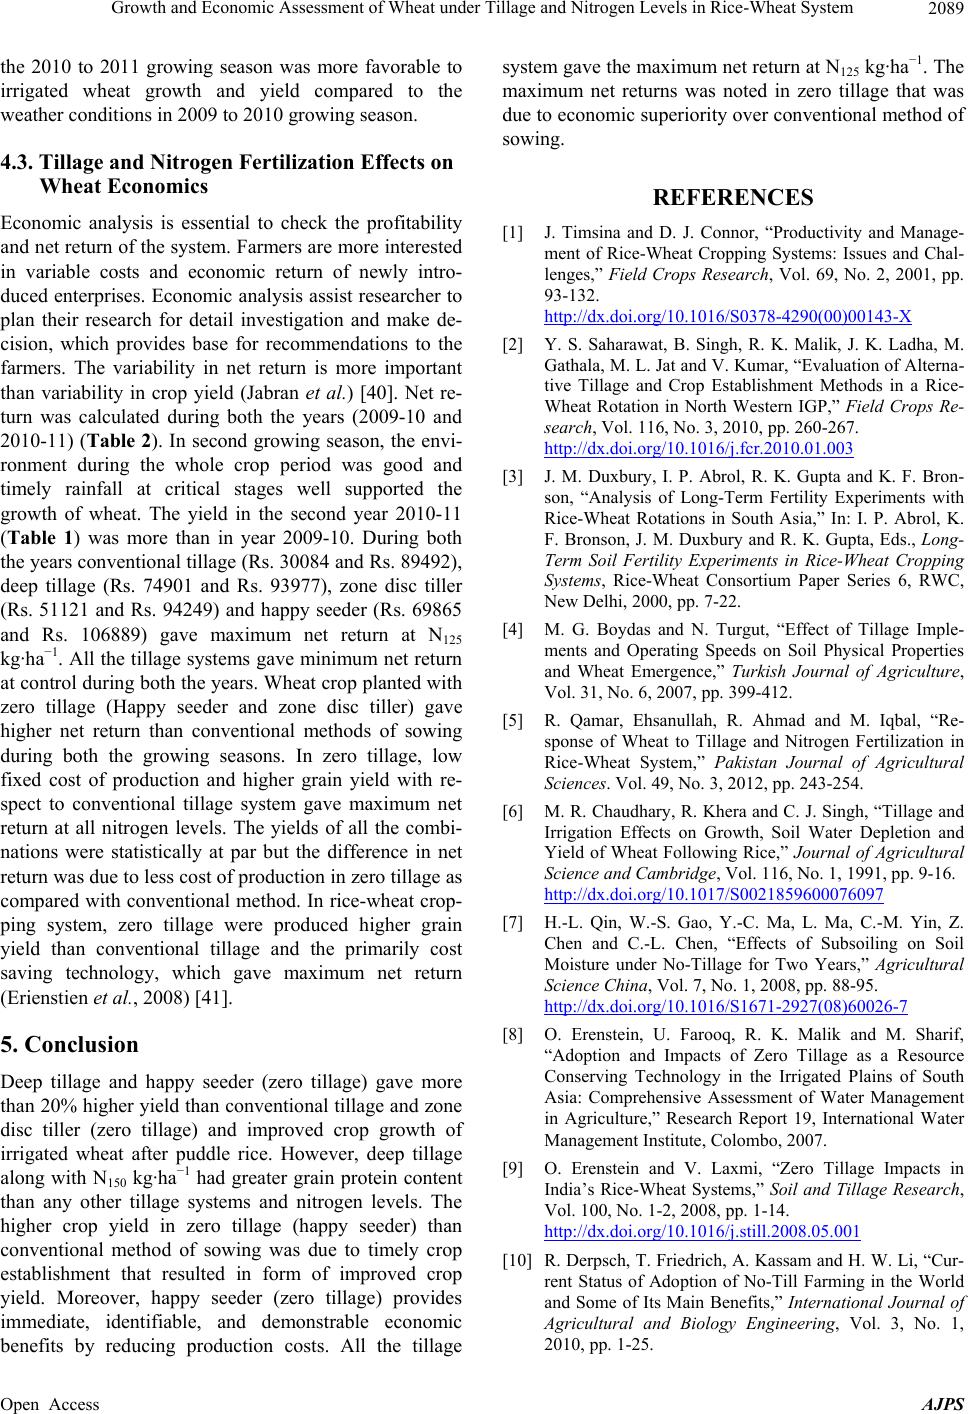 Growth and Economic Assessment of Wheat under Tillage and Nitrogen Levels in Rice-Wheat System 2089 the 2010 to 2011 growing season was more favorable to irrigated wheat growth and yield compared to the weather conditions in 2009 to 2010 growing season. 4.3. Tillage and Nitrogen Fertilization Effects on Wheat Economics Economic analysis is essential to check the profitability and net return of the system. Farmers are more interested in variable costs and economic return of newly intro- duced enterprises. Economic analysis assist researcher to plan their research for detail investigation and make de- cision, which provides base for recommendations to the farmers. The variability in net return is more important than variability in crop yield (Jabran et al.) [40]. Net re- turn was calculated during both the years (2009-10 and 2010-11) (Table 2). In second growing season, the envi- ronment during the whole crop period was good and timely rainfall at critical stages well supported the growth of wheat. The yield in the second year 2010-11 (Table 1) was more than in year 2009-10. During both the years conventional tillage (Rs. 30084 and Rs. 89492), deep tillage (Rs. 74901 and Rs. 93977), zone disc tiller (Rs. 51121 and Rs. 94249) and happy seeder (Rs. 69865 and Rs. 106889) gave maximum net return at N125 kg·ha−1. All the tillage systems gave minimum net return at control during both the years. Wheat crop planted with zero tillage (Happy seeder and zone disc tiller) gave higher net return than conventional methods of sowing during both the growing seasons. In zero tillage, low fixed cost of production and higher grain yield with re- spect to conventional tillage system gave maximum net return at all nitrogen levels. The yields of all the combi- nations were statistically at par but the difference in net return was due to less cost of production in zero tillage as compared with conventional method. In rice-wheat crop- ping system, zero tillage were produced higher grain yield than conventional tillage and the primarily cost saving technology, which gave maximum net return (Erienstien et al., 2008) [41]. 5. Conclusion Deep tillage and happy seeder (zero tillage) gave more than 20% higher yield than conventional tillage and zone disc tiller (zero tillage) and improved crop growth of irrigated wheat after puddle rice. However, deep tillage along with N150 kg·ha−1 had greater grain protein content than any other tillage systems and nitrogen levels. The higher crop yield in zero tillage (happy seeder) than conventional method of sowing was due to timely crop establishment that resulted in form of improved crop yield. Moreover, happy seeder (zero tillage) provides immediate, identifiable, and demonstrable economic benefits by reducing production costs. All the tillage system gave the maximum net return at N125 kg·ha−1. The maximum net returns was noted in zero tillage that was due to economic superiority over conventional method of sowing. REFERENCES [1] J. Timsina and D. J. Connor, “Productivity and Manage- ment of Rice-Wheat Cropping Systems: Issues and Chal- lenges,” Field Crops Research, Vol. 69, No. 2, 2001, pp. 93-132. http://dx.doi.org/10.1016/S0378-4290(00)00143-X [2] Y. S. Saharawat, B. Singh, R. K. Malik, J. K. Ladha, M. Gathala, M. L. Jat and V. Kumar, “Evaluation of Alterna- tive Tillage and Crop Establishment Methods in a Rice- Wheat Rotation in North Western IGP,” Field Crops Re- search, Vol. 116, No. 3, 2010, pp. 260-267. http://dx.doi.org/10.1016/j.fcr.2010.01.003 [3] J. M. Duxbury, I. P. Abrol, R. K. Gupta and K. F. Bron- son, “Analysis of Long-Term Fertility Experiments with Rice-Wheat Rotations in South Asia,” In: I. P. Abrol, K. F. Bronson, J. M. Duxbury and R. K. Gupta, Eds., Long- Term Soil Fertility Experiments in Rice-Wheat Cropping Systems, Rice-Wheat Consortium Paper Series 6, RWC, New Delhi, 2000, pp. 7-22. [4] M. G. Boydas and N. Turgut, “Effect of Tillage Imple- ments and Operating Speeds on Soil Physical Properties and Wheat Emergence,” Turkish Journal of Agriculture, Vol. 31, No. 6, 2007, pp. 399-412. [5] R. Qamar, Ehsanullah, R. Ahmad and M. Iqbal, “Re- sponse of Wheat to Tillage and Nitrogen Fertilization in Rice-Wheat System,” Pakistan Journal of Agricultural Sciences. Vol. 49, No. 3, 2012, pp. 243-254. [6] M. R. Chaudhary, R. Khera and C. J. Singh, “Tillage and Irrigation Effects on Growth, Soil Water Depletion and Yield of Wheat Following Rice,” Journal of Agricultural Science and Cambridge, Vol. 116, No. 1, 1991, pp. 9-16. http://dx.doi.org/10.1017/S0021859600076097 [7] H.-L. Qin, W.-S. Gao, Y.-C. Ma, L. Ma, C.-M. Yin, Z. Chen and C.-L. Chen, “Effects of Subsoiling on Soil Moisture under No-Tillage for Two Years,” Agricultural Science China, Vol. 7, No. 1, 2008, pp. 88-95. http://dx.doi.org/10.1016/S1671-2927(08)60026-7 [8] O. Erenstein, U. Farooq, R. K. Malik and M. Sharif, “Adoption and Impacts of Zero Tillage as a Resource Conserving Technology in the Irrigated Plains of South Asia: Comprehensive Assessment of Water Management in Agriculture,” Research Report 19, International Water Management Institute, Colombo, 2007. [9] O. Erenstein and V. Laxmi, “Zero Tillage Impacts in India’s Rice-Wheat Systems,” Soil and Tillage Research, Vol. 100, No. 1-2, 2008, pp. 1-14. http://dx.doi.org/10.1016/j.still.2008.05.001 [10] R. Derpsch, T. Friedrich, A. Kassam and H. W. Li, “Cur- rent Status of Adoption of No-Till Farming in the World and Some of Its Main Benefits,” International Journal of Agricultural and Biology Engineering, Vol. 3, No. 1, 2010, pp. 1-25. Open Access AJPS 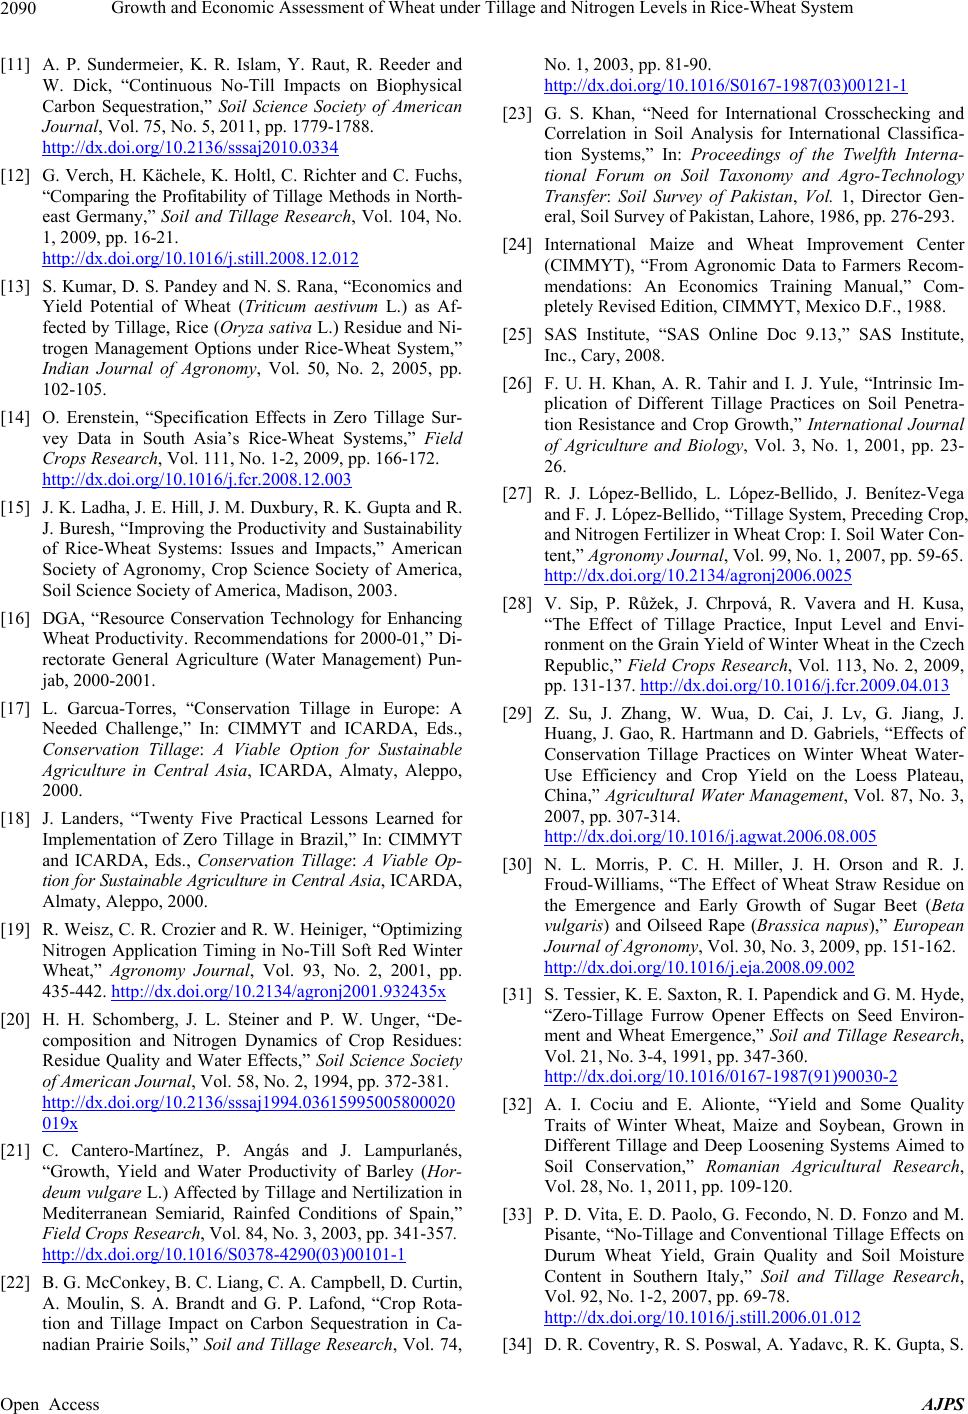 Growth and Economic Assessment of Wheat under Tillage and Nitrogen Levels in Rice-Wheat System 2090 [11] A. P. Sundermeier, K. R. Islam, Y. Raut, R. Reeder and W. Dick, “Continuous No-Till Impacts on Biophysical Carbon Sequestration,” Soil Science Society of American Journal, Vol. 75, No. 5, 2011, pp. 1779-1788. http://dx.doi.org/10.2136/sssaj2010.0334 [12] G. Verch, H. Kächele, K. Holtl, C. Richter and C. Fuchs, “Comparing the Profitability of Tillage Methods in North- east Germany,” Soil and Tillage Research, Vol. 104, No. 1, 2009, pp. 16-21. http://dx.doi.org/10.1016/j.still.2008.12.012 [13] S. Kumar, D. S. Pandey and N. S. Rana, “Economics and Yield Potential of Wheat (Triticum aestivum L.) as Af- fected by Tillage, Rice (Oryza sativa L.) Residue and Ni- trogen Management Options under Rice-Wheat System,” Indian Journal of Agronomy, Vol. 50, No. 2, 2005, pp. 102-105. [14] O. Erenstein, “Specification Effects in Zero Tillage Sur- vey Data in South Asia’s Rice-Wheat Systems,” Field Crops Research, Vol. 111, No. 1-2, 2009, pp. 166-172. http://dx.doi.org/10.1016/j.fcr.2008.12.003 [15] J. K. Ladha, J. E. Hill, J. M. Duxbury, R. K. Gupta and R. J. Buresh, “Improving the Productivity and Sustainability of Rice-Wheat Systems: Issues and Impacts,” American Society of Agronomy, Crop Science Society of America, Soil Science Society of America, Madison, 2003. [16] DGA, “Resource Conservation Technology for Enhancing Wheat Productivity. Recommendations for 2000-01,” Di- rectorate General Agriculture (Water Management) Pun- jab, 2000-2001. [17] L. Garcua-Torres, “Conservation Tillage in Europe: A Needed Challenge,” In: CIMMYT and ICARDA, Eds., Conservation Tillage: A Viable Option for Sustainable Agriculture in Central Asia, ICARDA, Almaty, Aleppo, 2000. [18] J. Landers, “Twenty Five Practical Lessons Learned for Implementation of Zero Tillage in Brazil,” In: CIMMYT and ICARDA, Eds., Conservation Tillage: A Viable Op- tion for Sustainable Agriculture in Central Asia, ICARDA, Almaty, Aleppo, 2000. [19] R. Weisz, C. R. Crozier and R. W. Heiniger, “Optimizing Nitrogen Application Timing in No-Till Soft Red Winter Wheat,” Agronomy Journal, Vol. 93, No. 2, 2001, pp. 435-442. http://dx.doi.org/10.2134/agronj2001.932435x [20] H. H. Schomberg, J. L. Steiner and P. W. Unger, “De- composition and Nitrogen Dynamics of Crop Residues: Residue Quality and Water Effects,” Soil Science Society of American Journal, Vol. 58, No. 2, 1994, pp. 372-381. http://dx.doi.org/10.2136/sssaj1994.03615995005800020 019x [21] C. Cantero-Martínez, P. Angás and J. Lampurlanés, “Growth, Yield and Water Productivity of Barley (Hor- deum vulgare L.) Affected by Tillage and Nertilization in Mediterranean Semiarid, Rainfed Conditions of Spain,” Field Crops Research, Vol. 84, No. 3, 2003, pp. 341-357. http://dx.doi.org/10.1016/S0378-4290(03)00101-1 [22] B. G. McConkey, B. C. Liang, C. A. Campbell, D. Curtin, A. Moulin, S. A. Brandt and G. P. Lafond, “Crop Rota- tion and Tillage Impact on Carbon Sequestration in Ca- nadian Prairie Soils,” Soil and Tillage Research, Vol. 74, No. 1, 2003, pp. 81-90. http://dx.doi.org/10.1016/S0167-1987(03)00121-1 [23] G. S. Khan, “Need for International Crosschecking and Correlation in Soil Analysis for International Classifica- tion Systems,” In: Proceedings of the Twelfth Interna- tional Forum on Soil Taxonomy and Agro-Technology Transfer: Soil Survey of Pakistan, Vol. 1, Director Gen- eral, Soil Survey of Pakistan, Lahore, 1986, pp. 276-293. [24] International Maize and Wheat Improvement Center (CIMMYT), “From Agronomic Data to Farmers Recom- mendations: An Economics Training Manual,” Com- pletely Revised Edition, CIMMYT, Mexico D.F., 1988. [25] SAS Institute, “SAS Online Doc 9.13,” SAS Institute, Inc., Cary, 2008. [26] F. U. H. Khan, A. R. Tahir and I. J. Yule, “Intrinsic Im- plication of Different Tillage Practices on Soil Penetra- tion Resistance and Crop Growth,” International Journal of Agriculture and Biology, Vol. 3, No. 1, 2001, pp. 23- 26. [27] R. J. López-Bellido, L. López-Bellido, J. Benítez-Vega and F. J. López-Bellido, “Tillage System, Preceding Crop, and Nitrogen Fertilizer in Wheat Crop: I. Soil Water Con- tent,” Agronomy Journal, Vol. 99, No. 1, 2007, pp. 59-65. http://dx.doi.org/10.2134/agronj2006.0025 [28] V. Sip, P. Růžek, J. Chrpová, R. Vavera and H. Kusa, “The Effect of Tillage Practice, Input Level and Envi- ronment on the Grain Yield of Winter Wheat in the Czech Republic,” Field Crops Research, Vol. 113, No. 2, 2009, pp. 131-137. http://dx.doi.org/10.1016/j.fcr.2009.04.013 [29] Z. Su, J. Zhang, W. Wua, D. Cai, J. Lv, G. Jiang, J. Huang, J. Gao, R. Hartmann and D. Gabriels, “Effects of Conservation Tillage Practices on Winter Wheat Water- Use Efficiency and Crop Yield on the Loess Plateau, China,” Agricultural Water Management, Vol. 87, No. 3, 2007, pp. 307-314. http://dx.doi.org/10.1016/j.agwat.2006.08.005 [30] N. L. Morris, P. C. H. Miller, J. H. Orson and R. J. Froud-Williams, “The Effect of Wheat Straw Residue on the Emergence and Early Growth of Sugar Beet (Beta vulgaris) and Oilseed Rape (Brassica napus),” European Journal of Agronomy, Vol. 30, No. 3, 2009, pp. 151-162. http://dx.doi.org/10.1016/j.eja.2008.09.002 [31] S. Tessier, K. E. Saxton, R. I. Papendick and G. M. Hyde, “Zero-Tillage Furrow Opener Effects on Seed Environ- ment and Wheat Emergence,” Soil and Tillage Research, Vol. 21, No. 3-4, 1991, pp. 347-360. http://dx.doi.org/10.1016/0167-1987(91)90030-2 [32] A. I. Cociu and E. Alionte, “Yield and Some Quality Traits of Winter Wheat, Maize and Soybean, Grown in Different Tillage and Deep Loosening Systems Aimed to Soil Conservation,” Romanian Agricultural Research, Vol. 28, No. 1, 2011, pp. 109-120. [33] P. D. Vita, E. D. Paolo, G. Fecondo, N. D. Fonzo and M. Pisante, “No-Tillage and Conventional Tillage Effects on Durum Wheat Yield, Grain Quality and Soil Moisture Content in Southern Italy,” Soil and Tillage Research, Vol. 92, No. 1-2, 2007, pp. 69-78. http://dx.doi.org/10.1016/j.still.2006.01.012 [34] D. R. Coventry, R. S. Poswal, A. Yadavc, R. K. Gupta, S. Open Access AJPS  Growth and Economic Assessment of Wheat under Tillage and Nitrogen Levels in Rice-Wheat System Open Access AJPS 2091 C. Gill, R. S. Chhokar, V. Kumard, R. K. Sharma, A. Kumar, A. Mehtae, S. G. L. Kleemanna and J. A. Cum- mins, “Effect of Tillage and Nutrient Management on Wheat Productivity and Quality in Haryana, India,” Field Crops Research, Vol. 123, No. 3, 2011, pp. 234-240. http://dx.doi.org/10.1016/j.fcr.2011.05.016 [35] M. A. Khan, I. Hussain and M. S. Baloch, “Wheat Yield Potential Current Status and Future Strategies,” Pakistan Journal of Biological Sciences, Vol. 3, No. 1, 2000, pp. 82-86. http://dx.doi.org/10.3923/pjbs.2000.82.86 [36] A. R. Tavakoli and T. Y. Oweis, “The Role of Supple- mental Irrigation and Nitrogen in Producing Bread Wheat in the Highlands of Iran,” Agricultural Water Manage- ment, Vol. 65, No. 3, 2004, pp. 225-236. http://dx.doi.org/10.1016/j.agwat.2003.09.001 [37] H. Hussain, M. A. Khan and E. A. Khan, “Bread Wheat Varieties as Influenced by Different Nitrogen Levels,” Journal of Zhejiang University Science and Biology, Vol. 7, No. 1, 2006, pp. 70-78. http://dx.doi.org/10.1631/jzus.2006.B0070 [38] C. Kosmas, S. Gerontidis, M. Marathianou, B. Detsis, T. Zafiriou, W. N. Muysen, G. Govers, T. Quinec and K. Vanoost, “The Effects of Tillage Displaced Soil on Soil Properties and Wheat Biomass,” Soil and Tillage Re- search, Vol. 58, No. 1-2, 2001, pp. 31-44. http://dx.doi.org/10.1016/S0167-1987(00)00175-6 [39] E. A. Warraich, N. Ahmad, S. M. A. Basra and I. Afzal, “Effect of Nitrogen on Source-Sink Relationship in Wheat,” International Journal of Agriculture and Biology, Vol. 4, No. 2, 2002, pp. 300-302. [40] K. Jabran, Z. A. Cheema, M. Farooq, S. M. A. Basra, M. Hussain and H. Rehman, “Tank Mixing of Allelopathic Crop Water Extracts with Pendimethalin Helps in the Management of Weeds in Canola (Brassica napus) Field,” International Journal of Agriculture and Biology, Vol. 10, No. 3, 2008, pp. 293-296. [41] O. Erenstein, K. Sayre, P. Wall, J. Dixon and J. Hellin, “Adapting No-Tillage Agriculture to the Conditions of Smallholder Maize and Wheat Farmers in the Tropics and Sub-Tropics,” In: T. Goddard, M. Zoebisch, Y. Gan, W. Ellis, A. Watson and S. Sombatpanit, Eds., No-Till Farm- ing Systems, Special Publication 3, World Association of Soil and Water Conservation (WASWC), Bangkok, 2008, pp. 253-278.
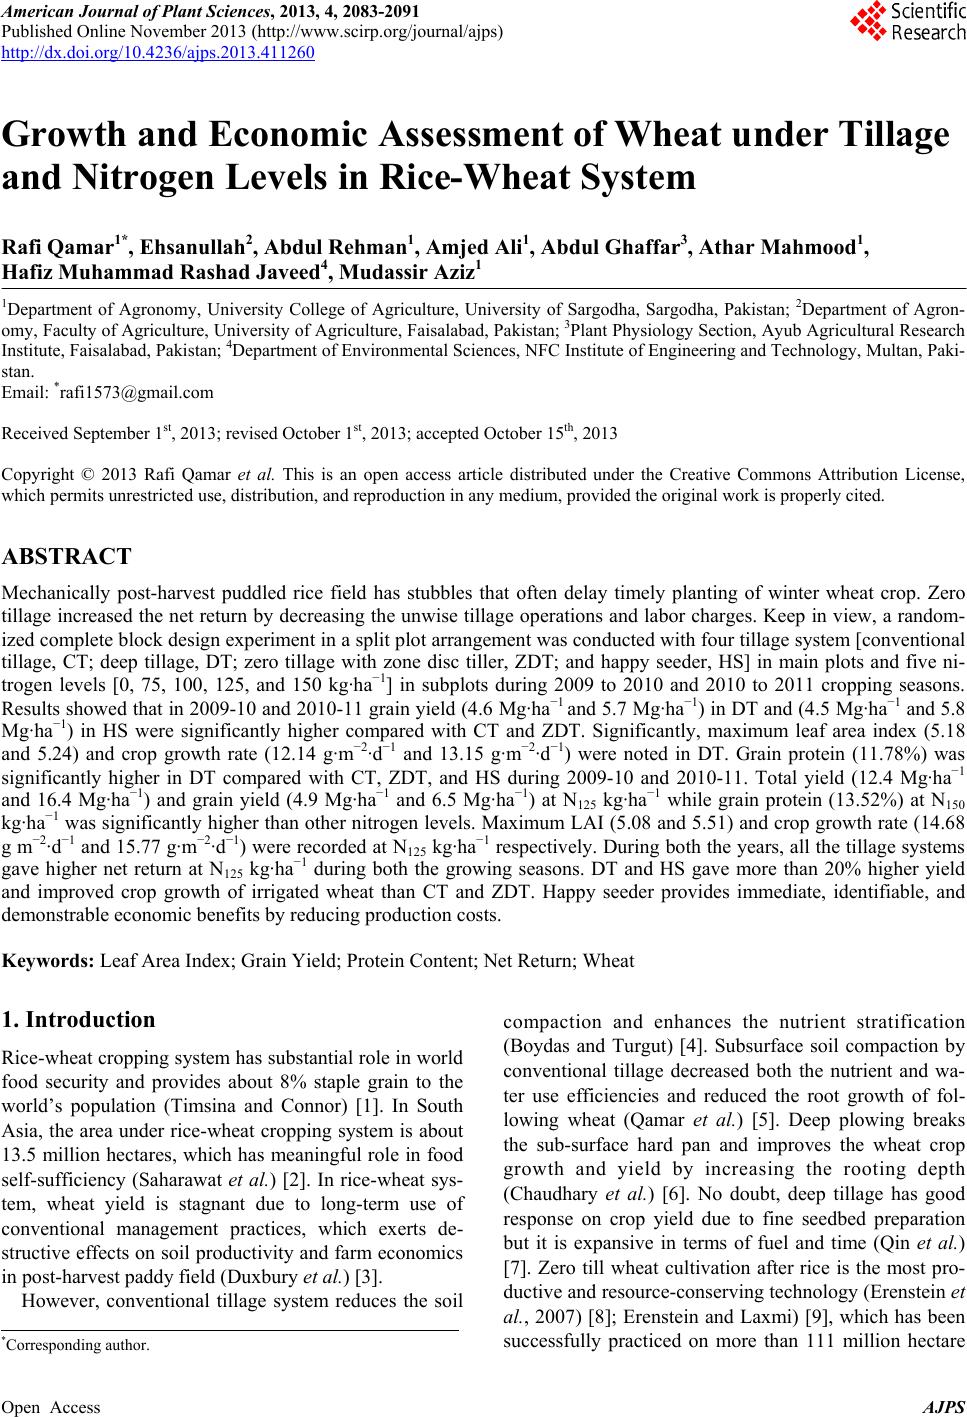
|