 American Journal of Plant Sciences, 2013, 4, 2060-2069 Published Online November 2013 (http://www.scirp.org/journal/ajps) http://dx.doi.org/10.4236/ajps.2013.411258 Open Access AJPS Stability of Soybean Genotypes and Their Classification into Relative Maturity Groups in Brazil José Elzevir Cavassim1*, João Carlos Bespalhok Filho1, Luis Fernando Alliprandini1, Ricardo Augusto de Oliveira1, Edelclaiton Daros1, Edson Perez Guerra2 1Department of Plant Science and Crop Protection, Federal University of Parana, Curitiba, Brazil; 2State University of Center-West (Unicentro), Guarapuava, Brazil. Email: *cavassim@hotmail.com Received September 5th, 2013; revised October 5th, 2013; accepted October 21st, 2013 Copyright © 2013 José Elzevir Cavassim et al. This is an open access article distributed under the Creative Commons Attribution License, which permits unrestricted use, distribution, and reproduction in any medium, provided the original work is properly cited. ABSTRACT The stability of soybean genotypes is very important in breeding programs for not only the evaluation, selection, and production of cultivars but also the establishment of parameters required for the classification of genotypes into relative maturity groups (RMG). The aim of this study was to define stable genotypes for traits, such as days to flowering, days to maturity, and length of the reproductive period, and to classify them into RMG. For this purpose, 20 commercial soybean cultivars were evaluated in 12 environments distributed in the major producing regions of Brazil. Assessments according to the Eberhart and Russell method and the additive main effects and multiplicative interaction (AMMI) method were effective in the identification of stable genotypes and their classification into RMG. These methods can also be used collectively for this purpose. Our results showed that the AMMI method led to a better interpretation of genotype-environment interactions. Thus, RMG obtained on the basis of stable genotypes represented a good estimate of the relative maturity of soybean crops throughout Brazil. Keywords: Glycine max. (L.) Merrill; Genotype-Environment Interaction; Eberhart and Russell Method; AMMI 1. Introduction The classical approach to describe the maturity of soy- beans is given by the classification of genotypes into early, medium, and late phases. In Brazil, breeding com- panies used a simple categorization based on the matura- tion cycle of soybean cultivars and classified them as early, medium early, medium, medium late, and late [1]. This method is effective for evaluating crop maturity levels in a local setting, but it is not adequate for de- scribing the relative maturity of soybean crops for a wide range of environments and latitudes in Brazilian areas where these crops are being currently cultivated [2]. This is a simple and effective system from a local standpoint, but as cultivars are cultivated in different regions and environments, the results obtained using this old classi- fication system in such situations may be inaccurate. Moreover, this system does not consider the effects of the time of planting. In the United States, a rating system has been devel- oped, ranging from Group 00, in the northern region of the country, to Group VIII, in the southern region of the country [3]. The adaptation range of each American ma- turity group is between 200 and 300 km, following a north-south axis in the territory [4]. Alliprandini et al. [2] conducted the first study on RMG in Brazil. Using a system similar to the one em- ployed in the United States, they presented results that allowed the classification of soybean genotypes into RMG throughout the country. After the approval of the Cultivar Protection Law in Brazil [5], several private companies have released soybean cultivars in the market, especially genetically modified glyphosate-resistant cul- tivars. At present, these resistant cultivars account for approximately 88.8% of the total area cultivated with soybeans in Brazil [6]. The standardization of cultivar witnesses is essential for the RMG classification of soybean genotypes to be effective. Moreover, these standards are required for the registration and protection of soybean cultivars in Brazil and need to be used jointly by agricultural improvement *Corresponding author. 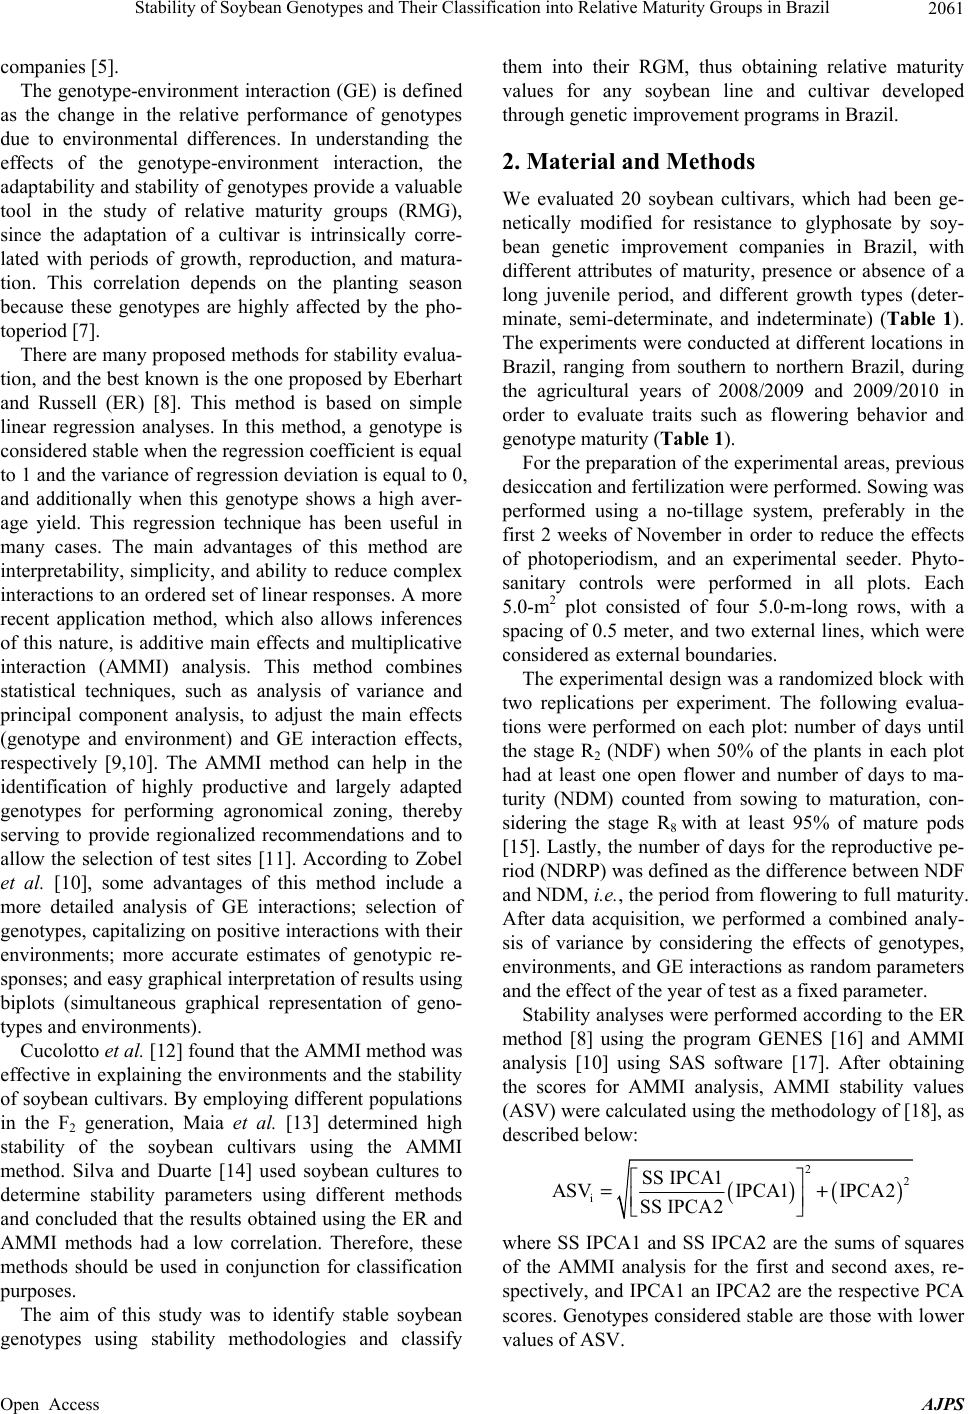 Stability of Soybean Genotypes and Their Classification into Relative Maturity Groups in Brazil 2061 companies [5]. The genotype-environment interaction (GE) is defined as the change in the relative performance of genotypes due to environmental differences. In understanding the effects of the genotype-environment interaction, the adaptability and stability of genotypes provide a valuable tool in the study of relative maturity groups (RMG), since the adaptation of a cultivar is intrinsically corre- lated with periods of growth, reproduction, and matura- tion. This correlation depends on the planting season because these genotypes are highly affected by the pho- toperiod [7]. There are many proposed methods for stability evalua- tion, and the best known is the one proposed by Eberhart and Russell (ER) [8]. This method is based on simple linear regression analyses. In this method, a genotype is considered stable when the regression coefficient is equal to 1 and the variance of regression deviation is equal to 0, and additionally when this genotype shows a high aver- age yield. This regression technique has been useful in many cases. The main advantages of this method are interpretability, simplicity, and ability to reduce complex interactions to an ordered set of linear responses. A more recent application method, which also allows inferences of this nature, is additive main effects and multiplicative interaction (AMMI) analysis. This method combines statistical techniques, such as analysis of variance and principal component analysis, to adjust the main effects (genotype and environment) and GE interaction effects, respectively [9,10]. The AMMI method can help in the identification of highly productive and largely adapted genotypes for performing agronomical zoning, thereby serving to provide regionalized recommendations and to allow the selection of test sites [11]. According to Zobel et al. [10], some advantages of this method include a more detailed analysis of GE interactions; selection of genotypes, capitalizing on positive interactions with their environments; more accurate estimates of genotypic re- sponses; and easy graphical interpretation of results using biplots (simultaneous graphical representation of geno- types and environments). Cucolotto et al. [12] found that the AMMI method was effective in explaining the environments and the stability of soybean cultivars. By employing different populations in the F2 generation, Maia et al. [13] determined high stability of the soybean cultivars using the AMMI method. Silva and Duarte [14] used soybean cultures to determine stability parameters using different methods and concluded that the results obtained using the ER and AMMI methods had a low correlation. Therefore, these methods should be used in conjunction for classification purposes. The aim of this study was to identify stable soybean genotypes using stability methodologies and classify them into their RGM, thus obtaining relative maturity values for any soybean line and cultivar developed through genetic improvement programs in Brazil. 2. Material and Methods We evaluated 20 soybean cultivars, which had been ge- netically modified for resistance to glyphosate by soy- bean genetic improvement companies in Brazil, with different attributes of maturity, presence or absence of a long juvenile period, and different growth types (deter- minate, semi-determinate, and indeterminate) (Table 1). The experiments were conducted at different locations in Brazil, ranging from southern to northern Brazil, during the agricultural years of 2008/2009 and 2009/2010 in order to evaluate traits such as flowering behavior and genotype maturity (Table 1). For the preparation of the experimental areas, previous desiccation and fertilization were performed. Sowing was performed using a no-tillage system, preferably in the first 2 weeks of November in order to reduce the effects of photoperiodism, and an experimental seeder. Phyto- sanitary controls were performed in all plots. Each 5.0-m2 plot consisted of four 5.0-m-long rows, with a spacing of 0.5 meter, and two external lines, which were considered as external boundaries. The experimental design was a randomized block with two replications per experiment. The following evalua- tions were performed on each plot: number of days until the stage R2 (NDF) when 50% of the plants in each plot had at least one open flower and number of days to ma- turity (NDM) counted from sowing to maturation, con- sidering the stage R8 with at least 95% of mature pods [15]. Lastly, the number of days for the reproductive pe- riod (NDRP) was defined as the difference between NDF and NDM, i.e., the period from flowering to full maturity. After data acquisition, we performed a combined analy- sis of variance by considering the effects of genotypes, environments, and GE interactions as random parameters and the effect of the year of test as a fixed parameter. Stability analyses were performed according to the ER method [8] using the program GENES [16] and AMMI analysis [10] using SAS software [17]. After obtaining the scores for AMMI analysis, AMMI stability values (ASV) were calculated using the methodology of [18], as described below: ()( ) 2 2 i SS IPCA1 ASVIPCA1 IPCA2 SS IPCA2 =+ where SS IPCA1 and SS IPCA2 are the sums of squares of the AMMI analysis for the first and second axes, re- spectively, and IPCA1 an IPCA2 are the respective PCA scores. Genotypes considered stable are those with lower values of ASV. Open Access AJPS  Stability of Soybean Genotypes and Their Classification into Relative Maturity Groups in Brazil 2062 Based on the results of stability analyses, genotypes considered stable were defined and were used as a refer- ence for determining regression values for the maturity parameters. Using the fitting equation, RMG of the re- maining genotypes were established according to the method of Alliprandini et al. [2]. Subsequently, the rela- tive maturity of each genotype was compared with that reported previously [19]. 3. Results and Discussion 3.1. Variance Analysis The experiments were conducted in various environ- ments, representing the main regions of soybean cultiva- tion in Brazil (Table 1). According to the pooled analysis, low coefficients of variation were obtained for the traits evaluated (2.3% for NDF, 1.1% for NDM, and 3.3% for NDRP), indicating good precision in establishing and conducting the experiments, as reported by Carvalho et al. [20]. The largest variances for all traits were due to the effects of location (Table 2). The estimates for aver- age heritability were above 90%. Interaction effects were observed in all situations, especially in the year-location interaction, highlighting the major differences between the sites tested. However, the year of test had no effect on any of the traits studied, indicating that the evaluated years produced no significant differences in these traits of the genotypes tested. It had been reported that the west and southwest regions in the state of Paraná, taken in isolation, had less rain in 2008 [21] compared to other locations and years, thus influencing the genotypes allo- cated in this region to some extent. This conclusion re- garding the influence of the environmental conditions on genotypes was drawn by assessing the flowering and ripening periods. Significant differences related to the year–location interaction are due in part to the great variability of the environments tested, from southern to northern Brazil, indicating that, as a whole, years and locations are distinct environmental parameters and should both be considered for the correct evaluation of flowering traits. The effects of different genotypes were also significant for the traits evaluated, and greater variability was ob- served for NDM (Table 2). This range of variation had also been verified by Alliprandini et al. [2], making it possible to classify genotypes into distinct RMG, ranging from 5 to 9. The effects of the genotype-location interac- tion were also significant for all three traits evaluated, but with lower variability compared to the main effects. This indicates that although this interaction exists, be- cause of regionalized latitude and altitude adaptations, this effect has little influence on the evaluation of geno- types for the traits evaluated (Table 2). Alliprandini et al. [2] reported that the GE interaction was weak for all traits, suggesting that the classification of genotypes into RMG can be performed effectively when considering environments representative of the regions where one wants to produce and commercialize a cultivar. The smaller interaction values are related to the interaction effects of the genotype-year interaction, suggesting that if an array of experiments representative of the cultiva- tion sites is installed, the number of years for the evalua- tion of cultivars can be reduced. Another important as- pect to be noted is the larger magnitude of the GE inter- action than the genotype-year interaction. According to Cruz [16], these interactions require a detailed study of the behavior of cultivars and the environment by plant breeders through analysis of stability and adaptability. It is essential to determine the most stable genotypes with greater predictability because they will be the bench- marks for the calculation of maturity [2]. 3.2. ER Analysis Flowering (NDF) and maturity (NDM) data for the crops showed the expected average values when the crops were cultivated in their areas of adaptation, since the geno- types showed a predictable response to the environments tested, as can be seen by the values of β and R2 (Table 3). The cultivars mostly showed R2 values above 90%, indi- cating that the regression equation was well adjusted. However, we observed that cultivars having a long juve- nile period, because of breeding programs conducted in the northern Brazil, tend to increase their flowering pe- riods when grown in the southern region of the country. Similarly, a cultivar developed in the southern region, which hasn’t juvenile traits, tends to accelerate their flowering and maturation cycles when grown in low lati- tudes [4]. Allied to this is the effect of temperature be- cause as we move the crop to the north and places of lower altitudes, the temperature ranges become higher, particularly after sowing. However, the effects of differ- ent latitudes on genotypes is not clearly defined, consid- ering that in northern cultivars, the long juvenile period favors a higher initial growth before flowering, causing prolonged cultivar cycles when sown in the southern region [22]. Regarding the stability of cultivars, deviation from the regression for NDF demonstrated that only the cultivar CD219RR showed lower values that were not significant, thus indicating good stability. As shown in Table 3, de- viation values were all highly significant for NDM ac- cording to the ER method. Thus, all genotypes showed behavioral differences in maturity, and therefore were not considered stable by the ER method. One alternative would be to consider the smaller deviation values com- bined with β values, but this alternative was not consid- ered. Open Access AJPS 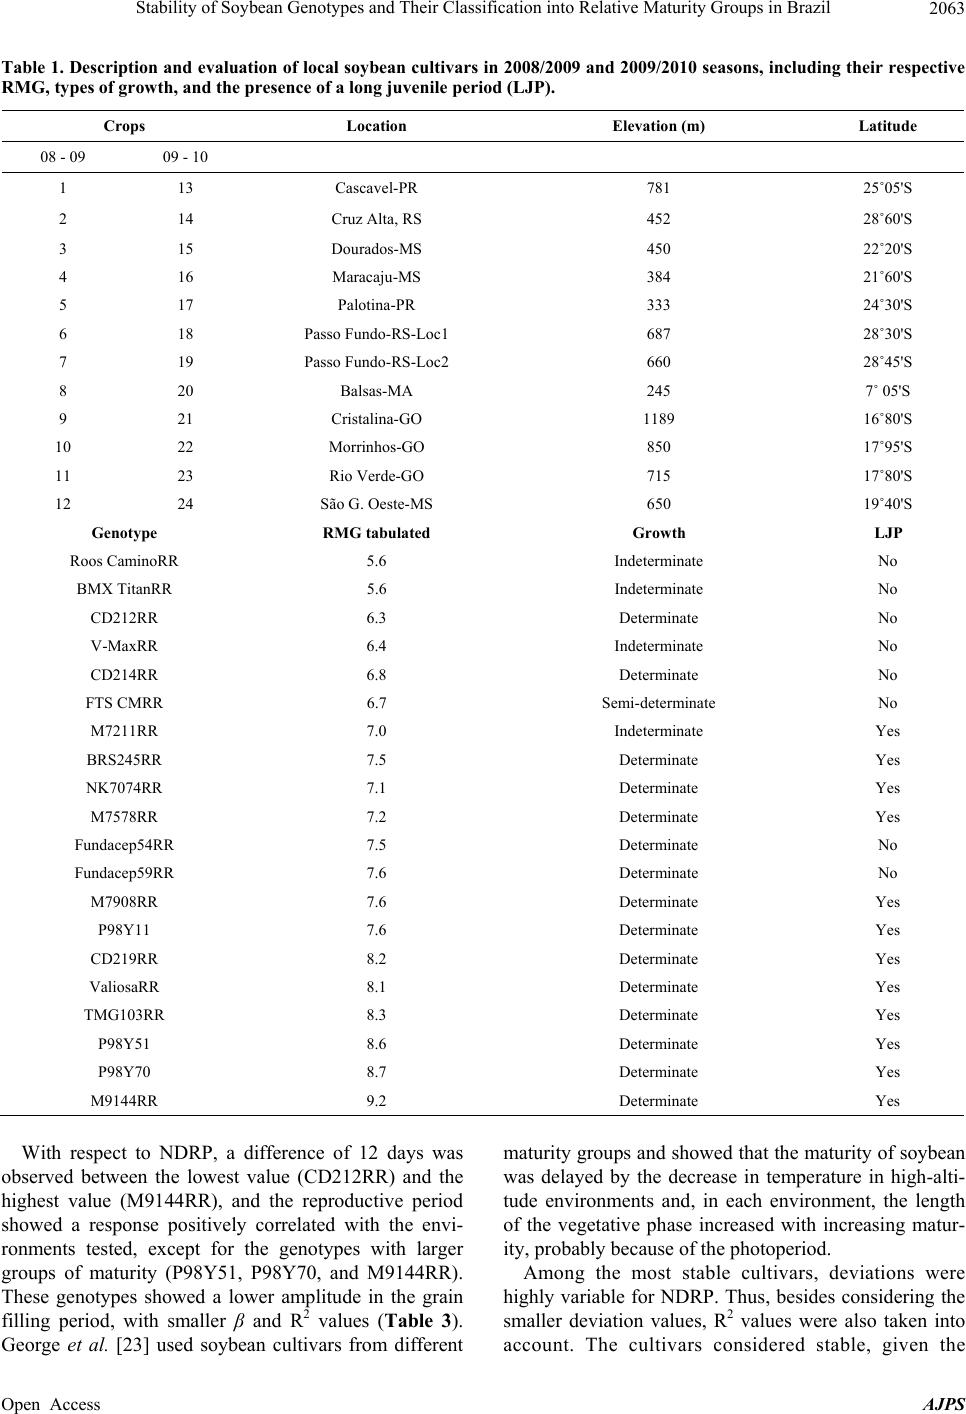 Stability of Soybean Genotypes and Their Classification into Relative Maturity Groups in Brazil Open Access AJPS 2063 Table 1. Description and evaluation of local soybean cultivars in 2008/2009 and 2009/2010 seasons, including their respective RMG, types of growth, and the presence of a long juvenile period (LJP). Crops Location Elevation (m) Latitude 08 - 09 09 - 10 1 13 Cascavel-PR 781 25˚05'S 2 14 Cruz Alta, RS 452 28˚60'S 3 15 Dourados-MS 450 22˚20'S 4 16 Maracaju-MS 384 21˚60'S 5 17 Palotina-PR 333 24˚30'S 6 18 Passo Fundo-RS-Loc1 687 28˚30'S 7 19 Passo Fundo-RS-Loc2 660 28˚45'S 8 20 Balsas-MA 245 7˚ 05'S 9 21 Cristalina-GO 1189 16˚80'S 10 22 Morrinhos-GO 850 17˚95'S 11 23 Rio Verde-GO 715 17˚80'S 12 24 São G. Oeste-MS 650 19˚40'S Genotype RMG tabulated Growth LJP Roos CaminoRR 5.6 Indeterminate No BMX TitanRR 5.6 Indeterminate No CD212RR 6.3 Determinate No V-MaxRR 6.4 Indeterminate No CD214RR 6.8 Determinate No FTS CMRR 6.7 Semi-determinate No M7211RR 7.0 Indeterminate Yes BRS245RR 7.5 Determinate Yes NK7074RR 7.1 Determinate Yes M7578RR 7.2 Determinate Yes Fundacep54RR 7.5 Determinate No Fundacep59RR 7.6 Determinate No M7908RR 7.6 Determinate Yes P98Y11 7.6 Determinate Yes CD219RR 8.2 Determinate Yes ValiosaRR 8.1 Determinate Yes TMG103RR 8.3 Determinate Yes P98Y51 8.6 Determinate Yes P98Y70 8.7 Determinate Yes M9144RR 9.2 Determinate Yes With respect to NDRP, a difference of 12 days was observed between the lowest value (CD212RR) and the highest value (M9144RR), and the reproductive period showed a response positively correlated with the envi- ronments tested, except for the genotypes with larger groups of maturity (P98Y51, P98Y70, and M9144RR). These genotypes showed a lower amplitude in the grain filling period, with smaller β and R2 values (Table 3). George et al. [23] used soybean cultivars from different maturity groups and showed that the maturity of soybean was delayed by the decrease in temperature in high-alti- tude environments and, in each environment, the length of the vegetative phase increased with increasing matur- ity, probably because of the photoperiod. Among the most stable cultivars, deviations were highly variable for NDRP. Thus, besides considering the smaller deviation values, R2 values were also taken into account. The cultivars considered stable, given the 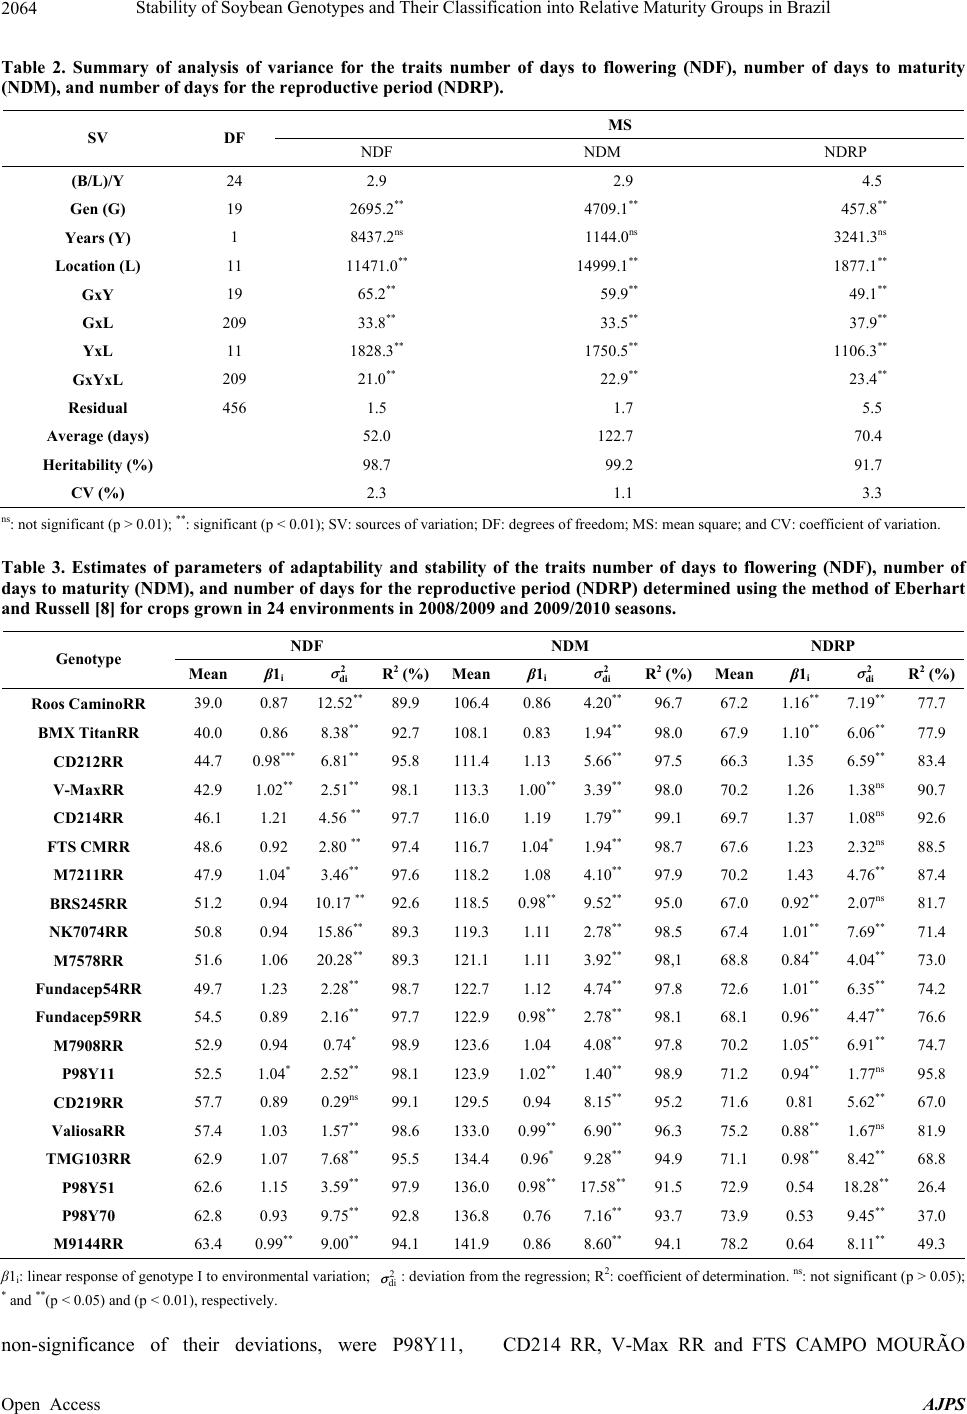 Stability of Soybean Genotypes and Their Classification into Relative Maturity Groups in Brazil 2064 Table 2. Summary of analysis of variance for the traits number of days to flowering (NDF), number of days to maturity (NDM), and number of day s for the re pr o ductive period (NDRP). MS SV DF NDF NDM NDRP (B/L)/Y 24 2.9 2.9 4.5 Gen (G) 19 2695.2** 4709.1** 457.8** Years (Y) 1 8437.2ns 1144.0ns 3241.3ns Location (L) 11 11471.0** 14999.1** 1877.1** GxY 19 65.2** 59.9** 49.1** GxL 209 33.8** 33.5** 37.9** YxL 11 1828.3** 1750.5** 1106.3** GxYxL 209 21.0** 22.9** 23.4** Residual 456 1.5 1.7 5.5 Average (days) 52.0 122.7 70.4 Heritability (%) 98.7 99.2 91.7 CV (%) 2.3 1.1 3.3 ns: not significant (p > 0.01); **: significant (p < 0.01); SV: sources of variation; DF: degrees of freedom; MS: mean square; and CV: coefficient of variation. Table 3. Estimates of parameters of adaptability and stability of the traits number of days to flowering (NDF), number of days to maturity (NDM), and number of day s for the reproductive per iod (NDRP) determined using the method of Eberhart and Russell [8] for crops grown in 24 environments in 2008/2009 and 2009/2010 seasons. NDF NDM NDRP Genotype Mean β1i σ 2 di R2 (%)Meanβ1i σ 2 di R2 (%)Mean β1i σ 2 di R2 (%) Roos CaminoRR 39.0 0.87 12.52** 89.9 106.40.86 4.20** 96.7 67.2 1.16** 7.19** 77.7 BMX TitanRR 40.0 0.86 8.38** 92.7 108.10.83 1.94** 98.0 67.9 1.10** 6.06** 77.9 CD212RR 44.7 0.98*** 6.81** 95.8 111.41.13 5.66** 97.5 66.3 1.35 6.59** 83.4 V-MaxRR 42.9 1.02** 2.51** 98.1 113.31.00** 3.39** 98.0 70.2 1.26 1.38ns 90.7 CD214RR 46.1 1.21 4.56 ** 97.7 116.01.19 1.79** 99.1 69.7 1.37 1.08ns 92.6 FTS CMRR 48.6 0.92 2.80 ** 97.4 116.7 1.04* 1.94** 98.7 67.6 1.23 2.32ns 88.5 M7211RR 47.9 1.04* 3.46** 97.6 118.21.08 4.10** 97.9 70.2 1.43 4.76** 87.4 BRS245RR 51.2 0.94 10.17 ** 92.6 118.50.98** 9.52** 95.0 67.0 0.92** 2.07ns 81.7 NK7074RR 50.8 0.94 15.86** 89.3 119.31.11 2.78** 98.5 67.4 1.01** 7.69** 71.4 M7578RR 51.6 1.06 20.28** 89.3 121.11.11 3.92** 98,1 68.8 0.84** 4.04**73.0 Fundacep54RR 49.7 1.23 2.28** 98.7 122.71.12 4.74** 97.8 72.6 1.01** 6.35** 74.2 Fundacep59RR 54.5 0.89 2.16** 97.7 122.90.98** 2.78** 98.1 68.1 0.96** 4.47**76.6 M7908RR 52.9 0.94 0.74* 98.9 123.61.04 4.08** 97.8 70.2 1.05** 6.91** 74.7 P98Y11 52.5 1.04* 2.52** 98.1 123.91.02** 1.40** 98.9 71.2 0.94** 1.77ns 95.8 CD219RR 57.7 0.89 0.29ns 99.1 129.5 0.94 8.15** 95.2 71.6 0.81 5.62** 67.0 ValiosaRR 57.4 1.03 1.57** 98.6 133.00.99** 6.90** 96.3 75.2 0.88** 1.67ns 81.9 TMG103RR 62.9 1.07 7.68** 95.5 134.40.96* 9.28** 94.9 71.1 0.98** 8.42** 68.8 P98Y51 62.6 1.15 3.59** 97.9 136.00.98** 17.58** 91.5 72.9 0.54 18.28** 26.4 P98Y70 62.8 0.93 9.75** 92.8 136.80.76 7.16** 93.7 73.9 0.53 9.45** 37.0 M9144RR 63.4 0.99** 9.00** 94.1 141.90.86 8.60** 94.1 78.2 0.64 8.11**49.3 β1i: linear response of genotype I to environmental variation; : deviation from the regression; R2: coefficient of determination. ns: not significant (p > 0.05); * and **(p < 0.05) and (p < 0.01), respectively. 2 di σ non-significance of their deviations, were P98Y11, CD214 RR, V-Max RR and FTS CAMPO MOURÃO Open Access AJPS 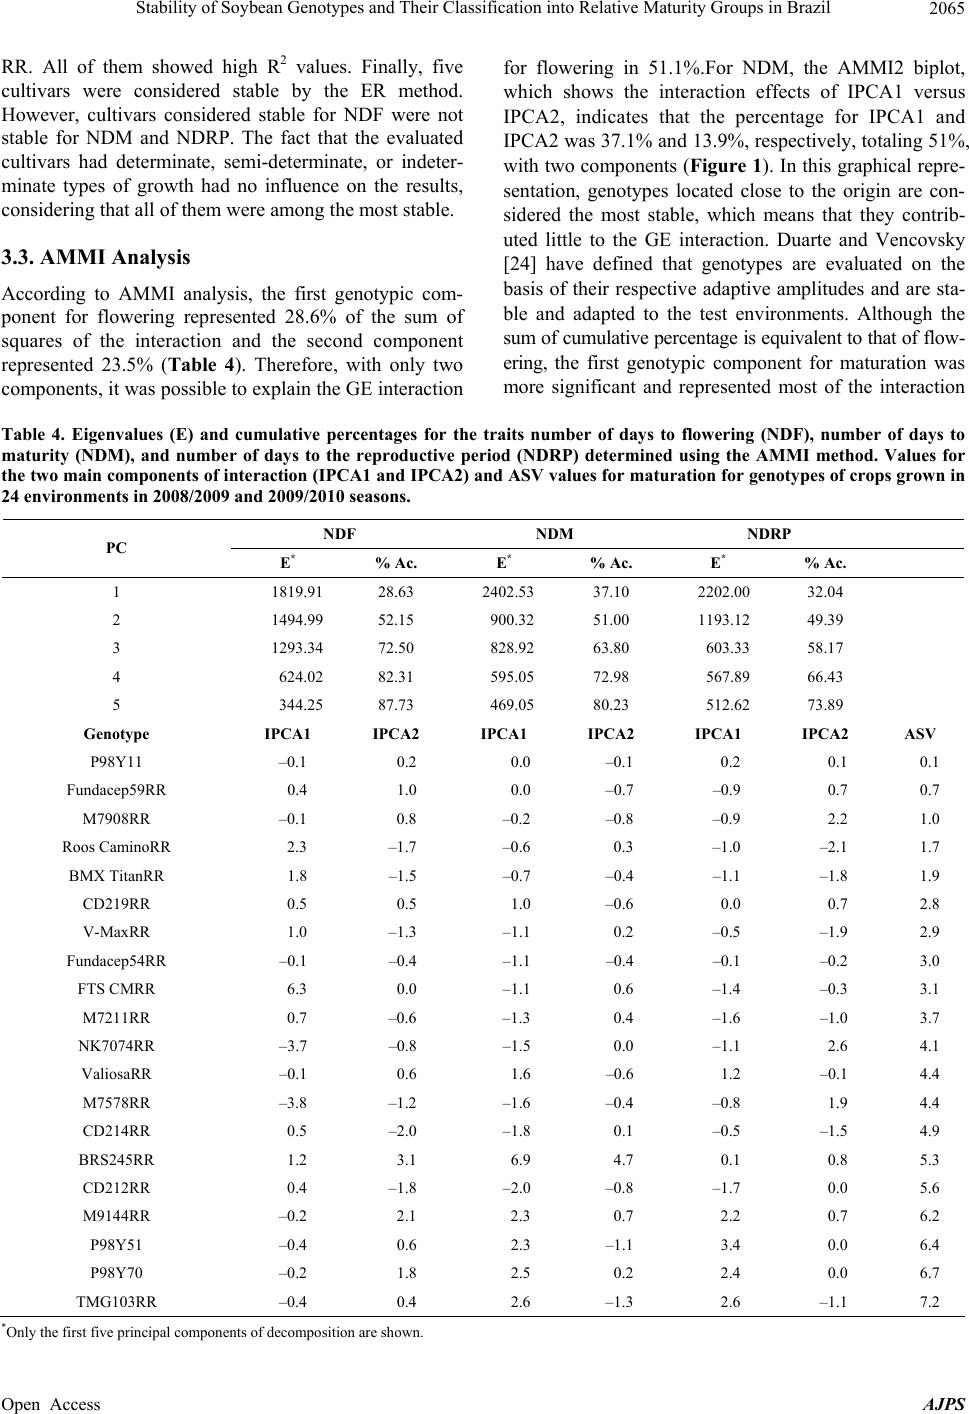 Stability of Soybean Genotypes and Their Classification into Relative Maturity Groups in Brazil 2065 RR. All of them showed high R2 values. Finally, five cultivars were considered stable by the ER method. However, cultivars considered stable for NDF were not stable for NDM and NDRP. The fact that the evaluated cultivars had determinate, semi-determinate, or indeter- minate types of growth had no influence on the results, considering that all of them were among the most stable. 3.3. AMMI Analysis According to AMMI analysis, the first genotypic com- ponent for flowering represented 28.6% of the sum of squares of the interaction and the second component represented 23.5% (Table 4). Therefore, with only two components, it was possible to explain the GE interaction for flowering in 51.1%.For NDM, the AMMI2 biplot, which shows the interaction effects of IPCA1 versus IPCA2, indicates that the percentage for IPCA1 and IPCA2 was 37.1% and 13.9%, respectively, totaling 51%, with two components (Figure 1). In this graphical repre- sentation, genotypes located close to the origin are con- sidered the most stable, which means that they contrib- uted little to the GE interaction. Duarte and Vencovsky [24] have defined that genotypes are evaluated on the basis of their respective adaptive amplitudes and are sta- ble and adapted to the test environments. Although the sum of cumulative percentage is equivalent to that of flow- ering, the first genotypic component for maturation was more significant and represented most of the interaction Table 4. Eigenvalues (E) and cumulative percentages for the traits number of days to flowering (NDF), number of days to maturity (NDM), and number of days to the reproductive period (NDRP) determined using the AMMI method. Values for the two main components of interaction (IPCA1 and IPCA2) and ASV values for maturation for genotypes of crops grown in 24 environments in 2008/2009 and 2009/2010 seasons. NDF NDM NDRP PC E* % Ac. E* % Ac. E* % Ac. 1 1819.91 28.63 2402.53 37.10 2202.00 32.04 2 1494.99 52.15 900.32 51.00 1193.12 49.39 3 1293.34 72.50 828.92 63.80 603.33 58.17 4 624.02 82.31 595.05 72.98 567.89 66.43 5 344.25 87.73 469.05 80.23 512.62 73.89 Genotype IPCA1 IPCA2 IPCA1 IPCA2 IPCA1 IPCA2 ASV P98Y11 –0.1 0.2 0.0 –0.1 0.2 0.1 0.1 Fundacep59RR 0.4 1.0 0.0 –0.7 –0.9 0.7 0.7 M7908RR –0.1 0.8 –0.2 –0.8 –0.9 2.2 1.0 Roos CaminoRR 2.3 –1.7 –0.6 0.3 –1.0 –2.1 1.7 BMX TitanRR 1.8 –1.5 –0.7 –0.4 –1.1 –1.8 1.9 CD219RR 0.5 0.5 1.0 –0.6 0.0 0.7 2.8 V-MaxRR 1.0 –1.3 –1.1 0.2 –0.5 –1.9 2.9 Fundacep54RR –0.1 –0.4 –1.1 –0.4 –0.1 –0.2 3.0 FTS CMRR 6.3 0.0 –1.1 0.6 –1.4 –0.3 3.1 M7211RR 0.7 –0.6 –1.3 0.4 –1.6 –1.0 3.7 NK7074RR –3.7 –0.8 –1.5 0.0 –1.1 2.6 4.1 ValiosaRR –0.1 0.6 1.6 –0.6 1.2 –0.1 4.4 M7578RR –3.8 –1.2 –1.6 –0.4 –0.8 1.9 4.4 CD214RR 0.5 –2.0 –1.8 0.1 –0.5 –1.5 4.9 BRS245RR 1.2 3.1 6.9 4.7 0.1 0.8 5.3 CD212RR 0.4 –1.8 –2.0 –0.8 –1.7 0.0 5.6 M9144RR –0.2 2.1 2.3 0.7 2.2 0.7 6.2 P98Y51 –0.4 0.6 2.3 –1.1 3.4 0.0 6.4 P98Y70 –0.2 1.8 2.5 0.2 2.4 0.0 6.7 TMG103RR –0.4 0.4 2.6 –1.3 2.6 –1.1 7.2 *Only the first five principal components of decomposition are shown. Open Access AJPS 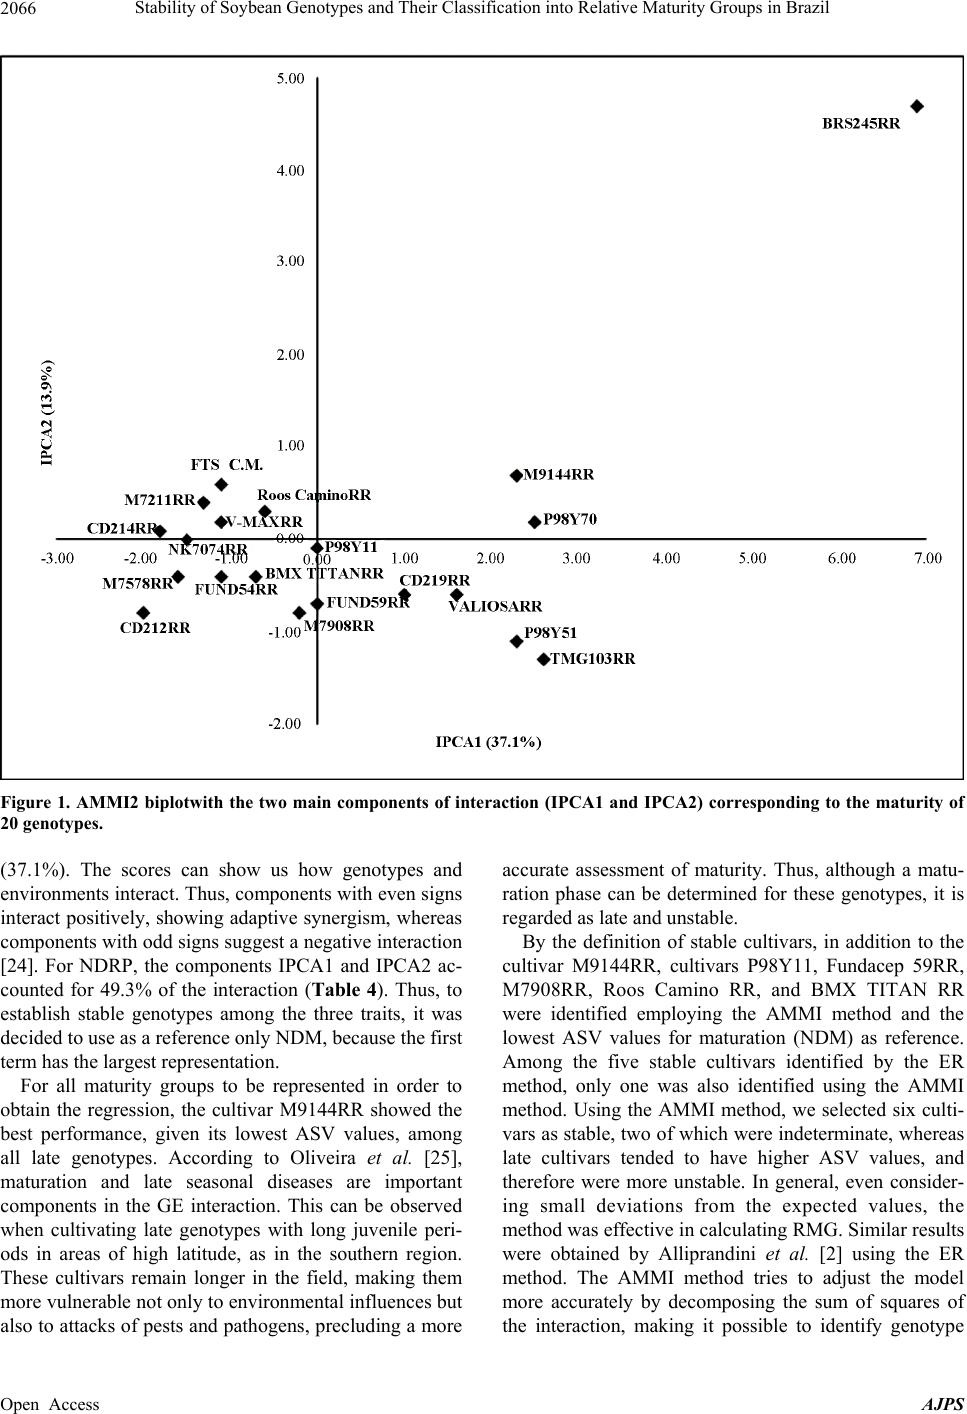 Stability of Soybean Genotypes and Their Classification into Relative Maturity Groups in Brazil 2066 Figure 1. AMMI2 biplotwith the two main components of interaction (IPCA1 and IPCA2) corresponding to the maturity of 20 genotypes. (37.1%). The scores can show us how genotypes and environments interact. Thus, components with even signs interact positively, showing adaptive synergism, whereas components with odd signs suggest a negative interaction [24]. For NDRP, the components IPCA1 and IPCA2 ac- counted for 49.3% of the interaction (Table 4). Thus, to establish stable genotypes among the three traits, it was decided to use as a reference only NDM, because the first term has the largest representation. For all maturity groups to be represented in order to obtain the regression, the cultivar M9144RR showed the best performance, given its lowest ASV values, among all late genotypes. According to Oliveira et al. [25], maturation and late seasonal diseases are important components in the GE interaction. This can be observed when cultivating late genotypes with long juvenile peri- ods in areas of high latitude, as in the southern region. These cultivars remain longer in the field, making them more vulnerable not only to environmental influences but also to attacks of pests and pathogens, precluding a more accurate assessment of maturity. Thus, although a matu- ration phase can be determined for these genotypes, it is regarded as late and unstable. By the definition of stable cultivars, in addition to the cultivar M9144RR, cultivars P98Y11, Fundacep 59RR, M7908RR, Roos Camino RR, and BMX TITAN RR were identified employing the AMMI method and the lowest ASV values for maturation (NDM) as reference. Among the five stable cultivars identified by the ER method, only one was also identified using the AMMI method. Using the AMMI method, we selected six culti- vars as stable, two of which were indeterminate, whereas late cultivars tended to have higher ASV values, and therefore were more unstable. In general, even consider- ing small deviations from the expected values, the method was effective in calculating RMG. Similar results were obtained by Alliprandini et al. [2] using the ER method. The AMMI method tries to adjust the model more accurately by decomposing the sum of squares of the interaction, making it possible to identify genotype Open Access AJPS 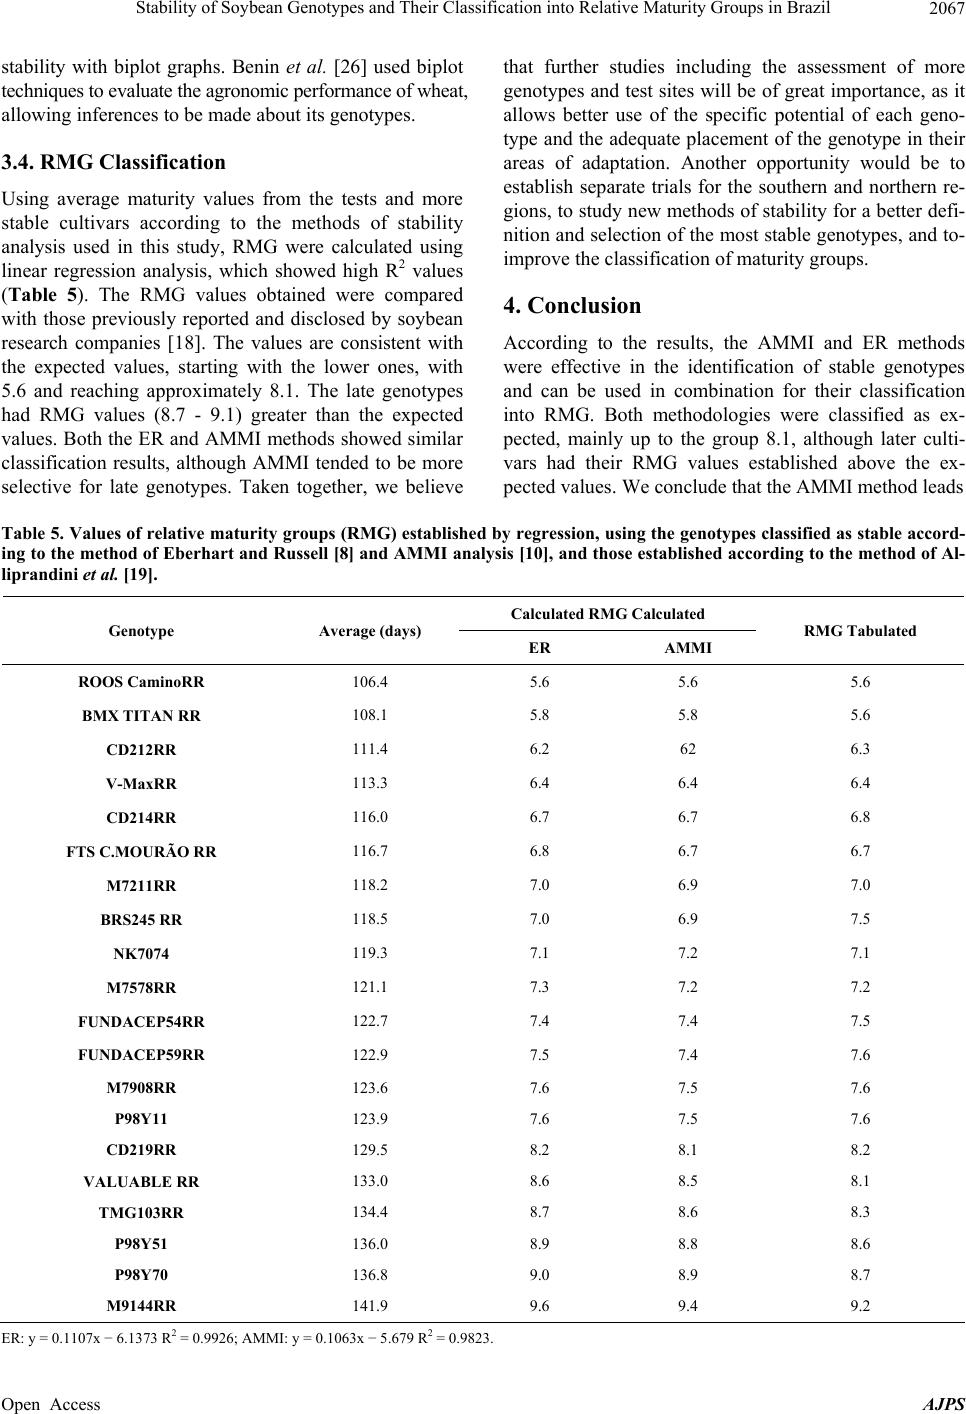 Stability of Soybean Genotypes and Their Classification into Relative Maturity Groups in Brazil 2067 stability with biplot graphs. Benin et al. [26] used biplot techniques to evaluate the agronomic performance of wheat, allowing inferences to be made about its genotypes. 3.4. RMG Classification Using average maturity values from the tests and more stable cultivars according to the methods of stability analysis used in this study, RMG were calculated using linear regression analysis, which showed high R2 values (Table 5). The RMG values obtained were compared with those previously reported and disclosed by soybean research companies [18]. The values are consistent with the expected values, starting with the lower ones, with 5.6 and reaching approximately 8.1. The late genotypes had RMG values (8.7 - 9.1) greater than the expected values. Both the ER and AMMI methods showed similar classification results, although AMMI tended to be more selective for late genotypes. Taken together, we believe that further studies including the assessment of more genotypes and test sites will be of great importance, as it allows better use of the specific potential of each geno- type and the adequate placement of the genotype in their areas of adaptation. Another opportunity would be to establish separate trials for the southern and northern re- gions, to study new methods of stability for a better defi- nition and selection of the most stable genotypes, and to- improve the classification of maturity groups. 4. Conclusion According to the results, the AMMI and ER methods were effective in the identification of stable genotypes and can be used in combination for their classification into RMG. Both methodologies were classified as ex- pected, mainly up to the group 8.1, although later culti- vars had their RMG values established above the ex- pected values. We conclude that the AMMI method leads Table 5. Values of relative maturity groups (RMG) established by regression, using the genoty pes classified as stable accord- ing to the method of Eberhart and Russell [8] and AMMI analysis [10], and those established according to the method of Al- liprandini et al. [19]. Calculated RMG Calculated Genotype Average (days) ER AMMI RMG Tabulated ROOS CaminoRR 106.4 5.6 5.6 5.6 BMX TITAN RR 108.1 5.8 5.8 5.6 CD212RR 111.4 6.2 62 6.3 V-MaxRR 113.3 6.4 6.4 6.4 CD214RR 116.0 6.7 6.7 6.8 FTS C .MOURÃO RR 116.7 6.8 6.7 6.7 M7211RR 118.2 7.0 6.9 7.0 BRS245 RR 118.5 7.0 6.9 7.5 NK7074 119.3 7.1 7.2 7.1 M7578RR 121.1 7.3 7.2 7.2 FUNDACEP54RR 122.7 7.4 7.4 7.5 FUNDACEP59RR 122.9 7.5 7.4 7.6 M7908RR 123.6 7.6 7.5 7.6 P98Y11 123.9 7.6 7.5 7.6 CD219RR 129.5 8.2 8.1 8.2 VALUABLE RR 133.0 8.6 8.5 8.1 TMG103RR 134.4 8.7 8.6 8.3 P98Y51 136.0 8.9 8.8 8.6 P98Y70 136.8 9.0 8.9 8.7 M9144RR 141.9 9.6 9.4 9.2 E R: y = 0.1107x − 6.1373 R2 = 0.9926; AMMI: y = 0.1063x − 5.679 R2 = 0.9823. Open Access AJPS  Stability of Soybean Genotypes and Their Classification into Relative Maturity Groups in Brazil 2068 to a better interpretation of the GE interactions. We sug- gest furthering these studies by employing other method- ologies and by separating the southern and northern en- vironments to determine the best fit for RMG. 5. Acknowledgements We thank the following researchers and institutions for their valuable contribution to the study: Leonardo Oliveira and Eduardo Lambert (MONSOY), Marco Rott (COODETEC), Andreomar Kurek (Syngenta), Cleiton Steckling (FUNDACEP), Carlos Pitol (FUNDAÇÃO MS), Nizio Giasson and Marcos Matsumoto (DON MARIO), Paulo Bertagnolli and Maria do Rosário Teixeira (EMBRAPA), Anderson Dona (WEHRTEC), and Luis Stabile (SOYTECH). REFERENCES [1] L. F. Alliprandini, J. F. F. Toledo, N. Fonseca Jr., L. A. Almeida and R. A. S. Kiihl, “Effects of Genotype- Environment Interaction on Soybean Yield in the Paraná State,” Pesquisa Agropecuária Brasileira, Vol. 29, No. 9, 1994, pp. 1433-1444. [2] L. F. Alliprandini, C. Abatti, P. F. Bertagnolli, J. E. Ca- vassim, H. L. Gabe, A. Kurek, M. N. Matsumoto, M. A. R. Oliveira, C. Pitol, L. C. Prado and C. Steckling, “Un- derstanding Soybean Maturity Groups in Brazil: Environ- ment, Cultivar Classification, and Stability,” Crop Science, Vol. 49, No. 3, 2009, pp. 801-808. http://dx.doi.org/10.2135/cropsci2008.07.0390 [3] L. X. Zhang, S. Kyei-Boahen, J. Zhang, M. H. Zhang, T. B. Freeland, C. E. Watson Jr. and X. M. Liu, “Modifica- tions of Optimum Adaptation Zones for Soybean Matur- ity Groups in the USA,” Crop Management. (Online) http://dx.doi.org/10.1094/CM-2007-0927-01-RS [4] H. A. Bruns, “A Survey of Factors Involved in Crop Ma- turity,” Agronomy Journal, Vol. 101, No. 1, 2009, pp. 60- 66. http://dx.doi.org/10.2134/agronj2007.0271R [5] Brazil, “Ministry of Agriculture, Livestock and Supply. Cultivar Protection in Brazil,” MAPA/ACS, Brasília, 2011, p. 202. [6] Céleres, “Biotechnology Report,” Céleres Consulting, Uberlandia, 2012, p. 9. [7] G. V. Meotti, G. Benin, R. R. Silva, E. Beche and L. B. Munaro, “Sowing Dates and Agronomic Performance of Soybean Cultivars,” Pesquisa Agropecuária Brasileira, Vol. 47, No. 1, 2012, pp. 14-21. http://dx.doi.org/10.1590/S0100-204X2012000100003 [8] S. A. Eberhart and W. A. Russell, “Stability Parameters for Comparing Varieties,” Crop Science, Vol. 6, No. 1, 1966, pp. 36-40. http://dx.doi.org/10.2135/cropsci1966.0011183X0006000 10011x [9] R. A. Kempton, “The Use of Biplots in Interpreting Vari- ety by Environment Interactions,” Journal of Agricultural Science, Vol. 103, No. 1, 1984, pp. 123-135. http://dx.doi.org/10.1017/S0021859600043392 [10] R. W. Zobel, M. J. Wright and H. G. Gauch, “Statistical Analysis of a Yield Trial,” Agronomy Journal, Vol. 80, No. 3, 1988, pp. 388-393. http://dx.doi.org/10.2134/agronj1988.0002196200800003 0002x [11] H. G. Gauch and R. W. Zobel, “AMMI Analysis of Yield Trials,” In: M. S. Kang and H. G. Gauch, Eds., Genotype- by-Environment Interaction, CRC Press, New York, 1996, p. 416. [12] M. Cucolotto, V. C. Pípolo, D. D. Garbuglio, N. S. Fonseca Jr., D. Destro and M. K. Kamikoga, “Genotype × Environment Interaction in Soybean: Evaluation through Three Methodologies,” Crop Breeding and Applied Bio- technology, Vol. 7, No. 3, 2007, pp. 270-277. [13] M. C. C. Maia, N. A. Vello, M. M. Rocha, J. B. Pinheiro and N. F. Silva Jr., “Adaptability and Stability of Soybean Experimental Lines Selected for Agronomic Traits and Insect Resistance by Uni-Multivariate Method,” Bragantia, Vol. 65, No. 2, 2006, pp. 215-226. http://dx.doi.org/10.1590/S0006-87052006000200004 [14] W. C. J. Silva and J. B. Duarte, “Statistical Methods to Study Phenotypic Adaptability and Stability in Soybean,” Pesquisa Agropecuária Brasileira, Vol. 41, No. 1, 2006, pp. 23-30. http://dx.doi.org/10.1590/S0100-204X2006000100004 [15] W. R. Fehr and C. E. Caviness, “Stages of Soybean De- velopment,” Special Report 80, Iowa State University, Ames, 1977. [16] C. D. Cruz, “Genes Program: Windows Version: Ap- plication in Genetics and Statistics,” Editora UFV, Viçosa, 2001, p. 648. [17] SAS Institute, “SAS User’s Guide,” SAS Institute, Cary, 1999. [18] J. L. Purchase, H. Hatting and C. S. Van Deventer, “Genotype × Environment Interaction of Winter Wheat in South Africa: II. Stability Analysis of Yield Perform- ance,” South African Journal of Plant Soil, Vol. 17, No. 3, 2000, pp. 101-107. http://dx.doi.org/10.1080/02571862.2000.10634878 [19] L. F. Alliprandini, J. E.Cavassim, M. A. R. Oliveira, M. N. Matsumoto, L. C. Prado, C. Pitol, C. Steckling, P. F. Bertagnoli, A. Kurek, M. K. Kamikoga, A. Dona, N. F. Giasson, C. Abatti, G. D. Silveira and C. Takeda, “Classification of Soybean Cultivarsin to Relative Maturity Groups in Brazil, during 2001/2002-2011/2012 Seasons,” 7th Congress of Plant Breeding, SBMP, Uberlandia, 2013. [20] C. G. P. Carvalho, C. A. A. Arias, J. F. F. Toledo, L. A. Almeida, R. A. S. Kiihl and M. F. Oliveira, “Genotypex Environment Interaction on Soybean Production Perform- ance in Paraná,” Pesquisa Agropecuária Brasileira, Vol. 37, No. 7, 2002, pp. 989-1000. http://dx.doi.org/10.1590/S0100-204X2002000700013 [21] Simepar, “Condições do Tempo,” 2013. http://www.simepar.br/tempo/clima/aviso_verao2009.htm [22] D. Destro, V. Carpentieri-Pípolo, R. A. S. Kiihl and L. A. Almeida, “Photoperiodic and Genetic Control of the Long Open Access AJPS  Stability of Soybean Genotypes and Their Classification into Relative Maturity Groups in Brazil 2069 Juvenile Period in Soybean: A Review,” Crop Breeding and Applied Biotechnology, Vol. 1, No. 1, 2001, pp. 72- 92. http://dx.doi.org/10.13082/1984-7033.v01n01a10 [23] T. George, D. P. Bartholomew and P. W. Singleton, “Ef- fect of Temperature and Maturity Group on Phenology of Field Grown Nodulating and Nonnodulating Soybean Isolines,” Biotronics, Vol. 19, 1990, pp. 49-59. [24] J. B. Duarte and R. Vencovsky, “Genotypex Environment Interaction: An Introduction to AMMI Analysis,” Série Monograph Series, Brazilian Society of Genetics, Ribeirao Preto, 1999. [25] A. B. Oliveira, J. B. Duarte, L. J. Chaves and M. A. Couto, “Environmental and Genotypic Factors Associated with Genotype by Environment Interactions in Soybean,” Crop Breeding and Applied Biotechnology, Vol. 6, 2006, pp. 79-86. [26] G. Benin, C. Pinnow, C. L. Silva, E. S. Pagliosa, E. Beche, E. Bornhofen, L. B. Munaro and R. R. Silva, “Biplot Analysis in the Evaluation of Wheat Cultivarsat Different Levels of Management,” Bragantia, Campinas, Vol. 71, No. 1, 2012, pp. 28-36. Open Access AJPS
|